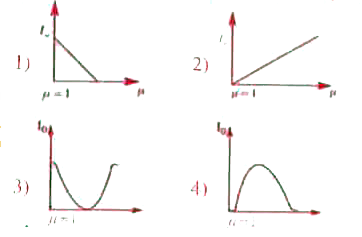
In YDSE if a slab whose refractive index can be varied is placed in front of one of the slits. Then, the variation of resultant intensity at mid-point of screen with μ will be best represented by (mu is greater than or equal to 1)
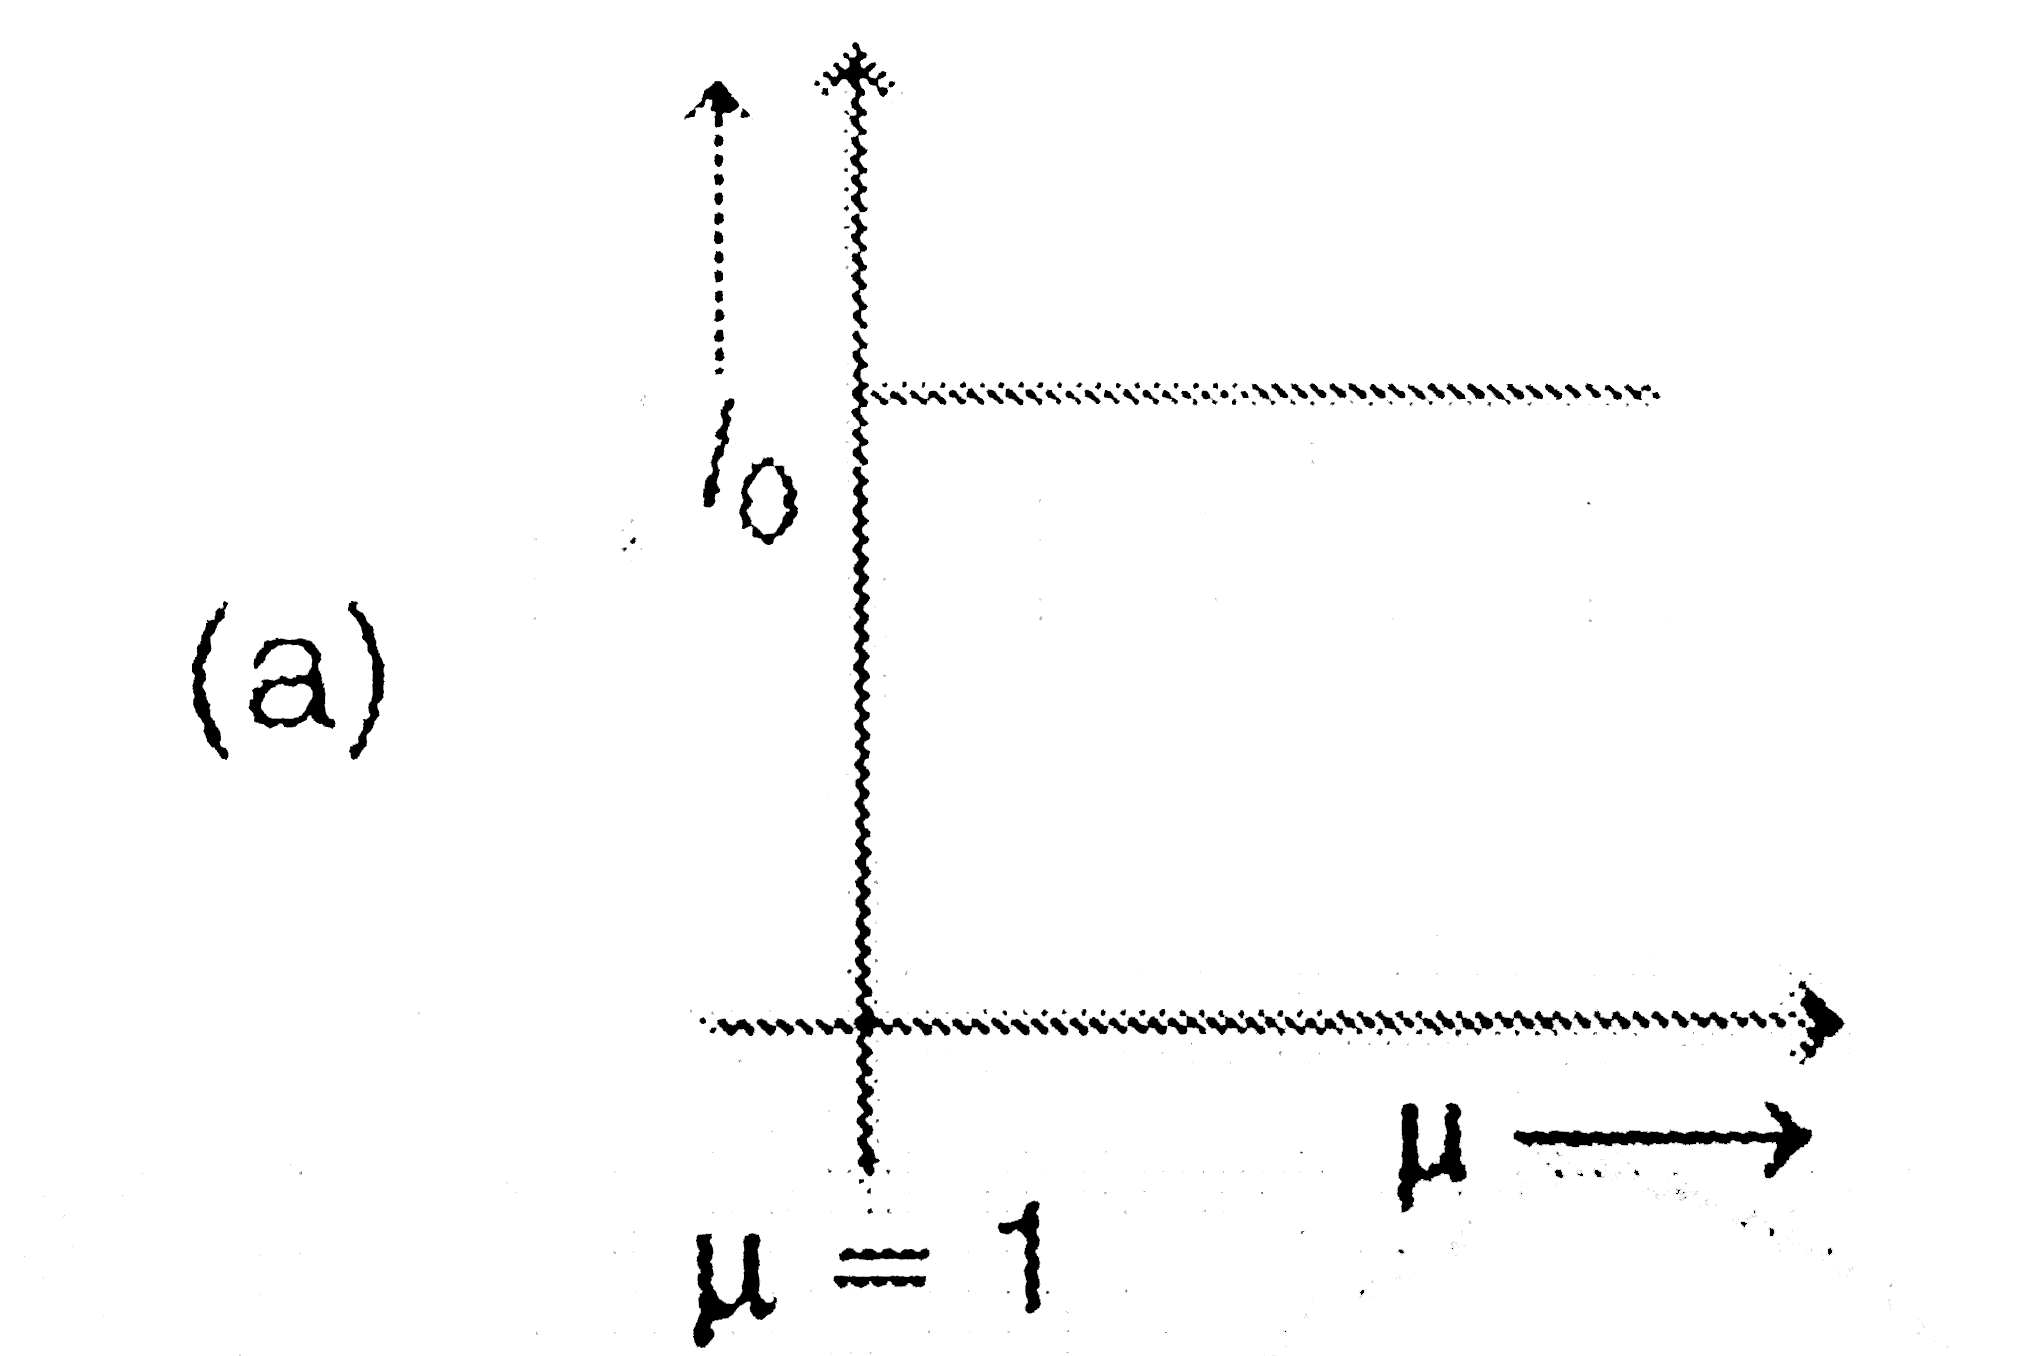
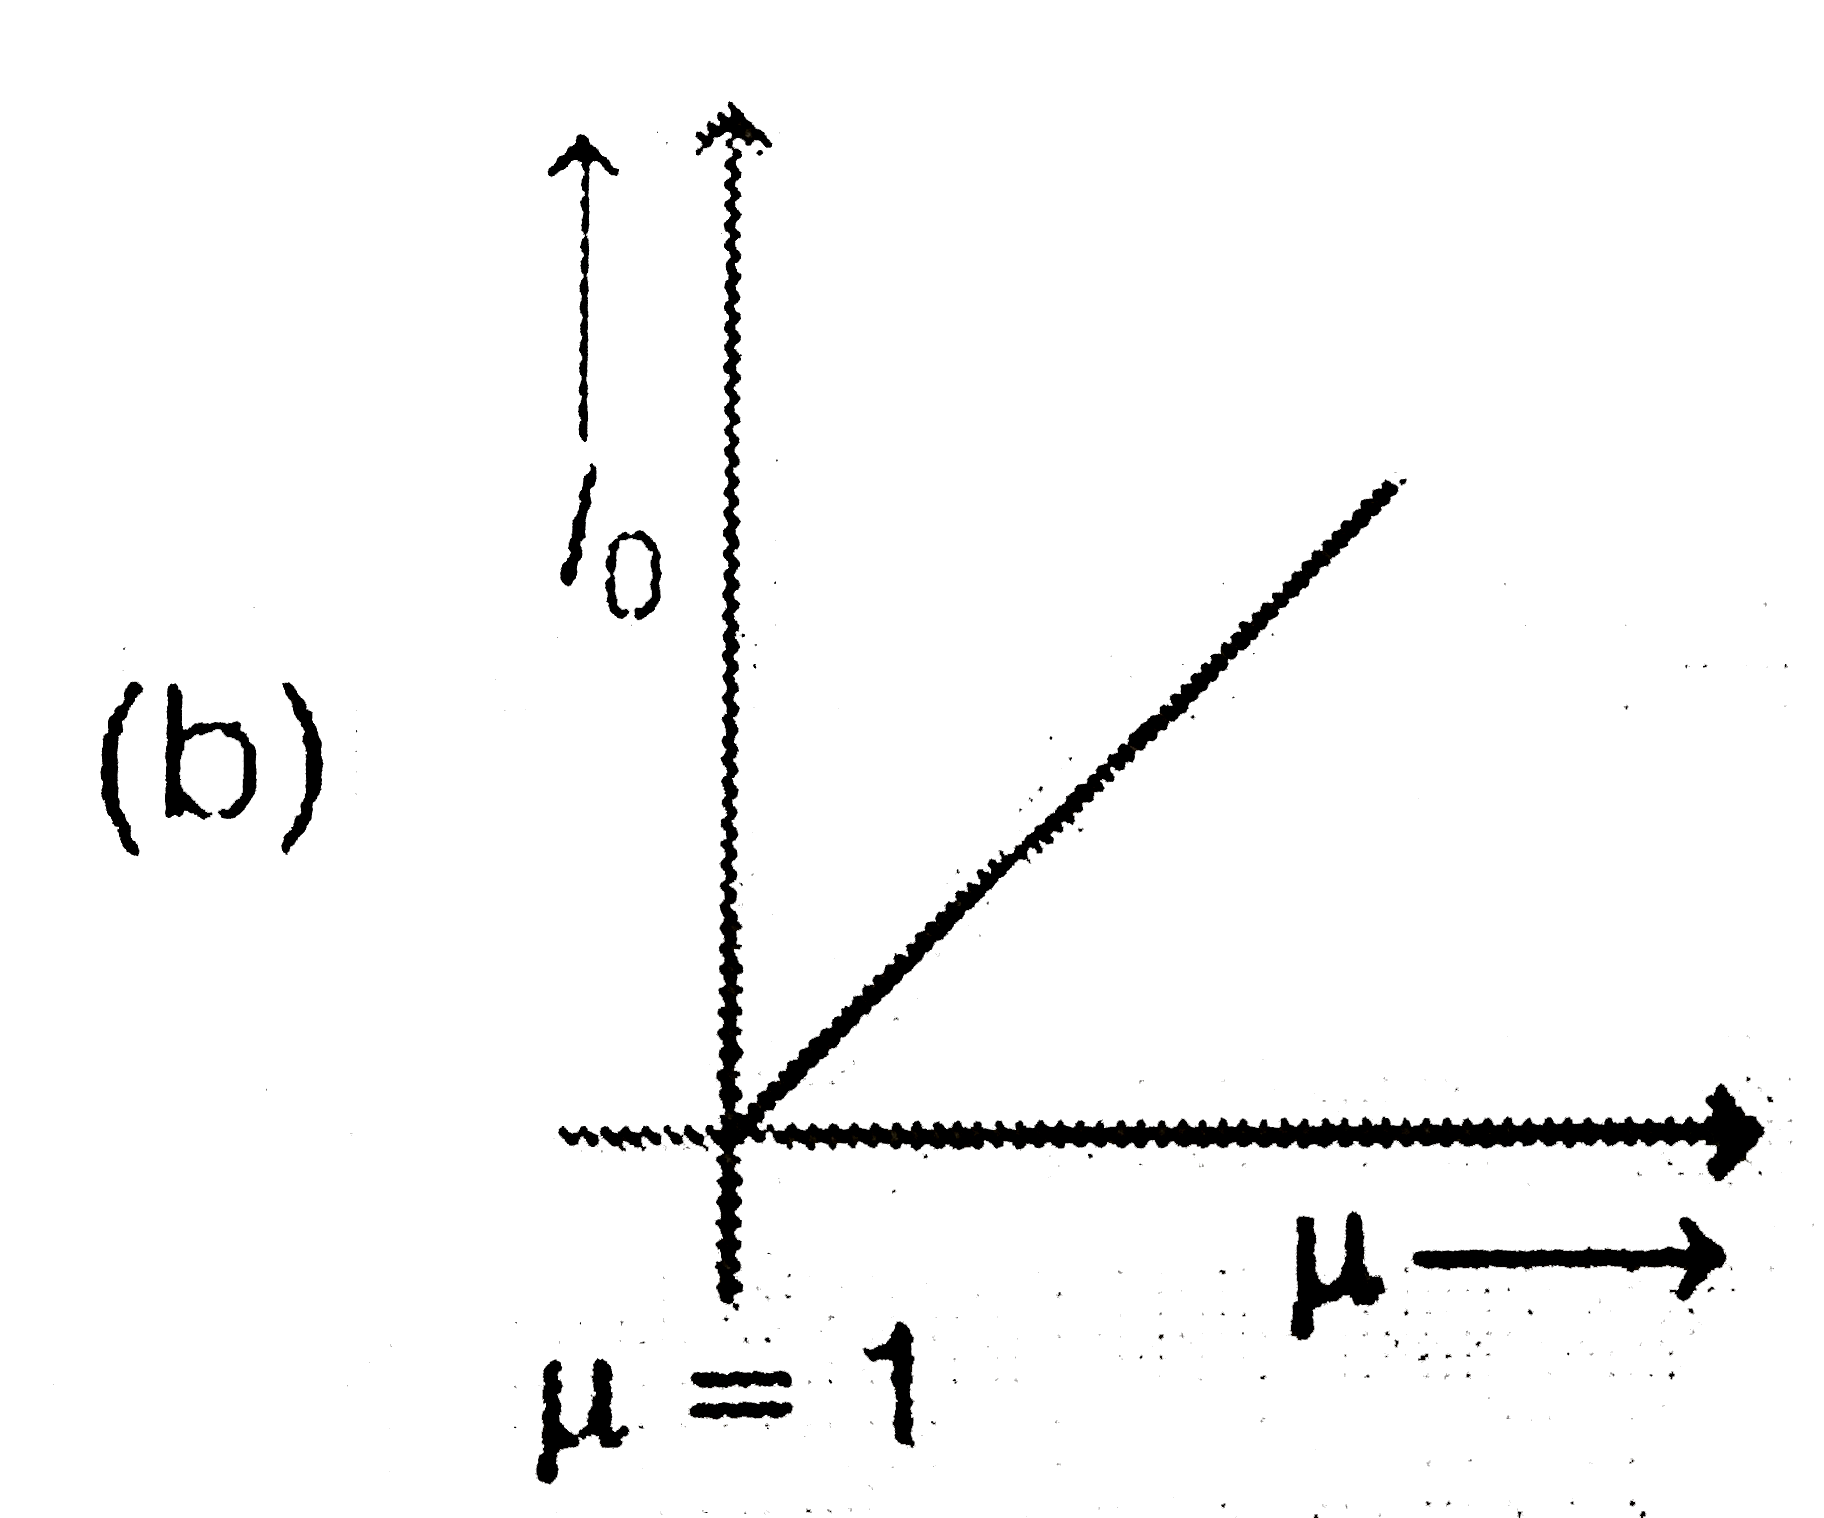
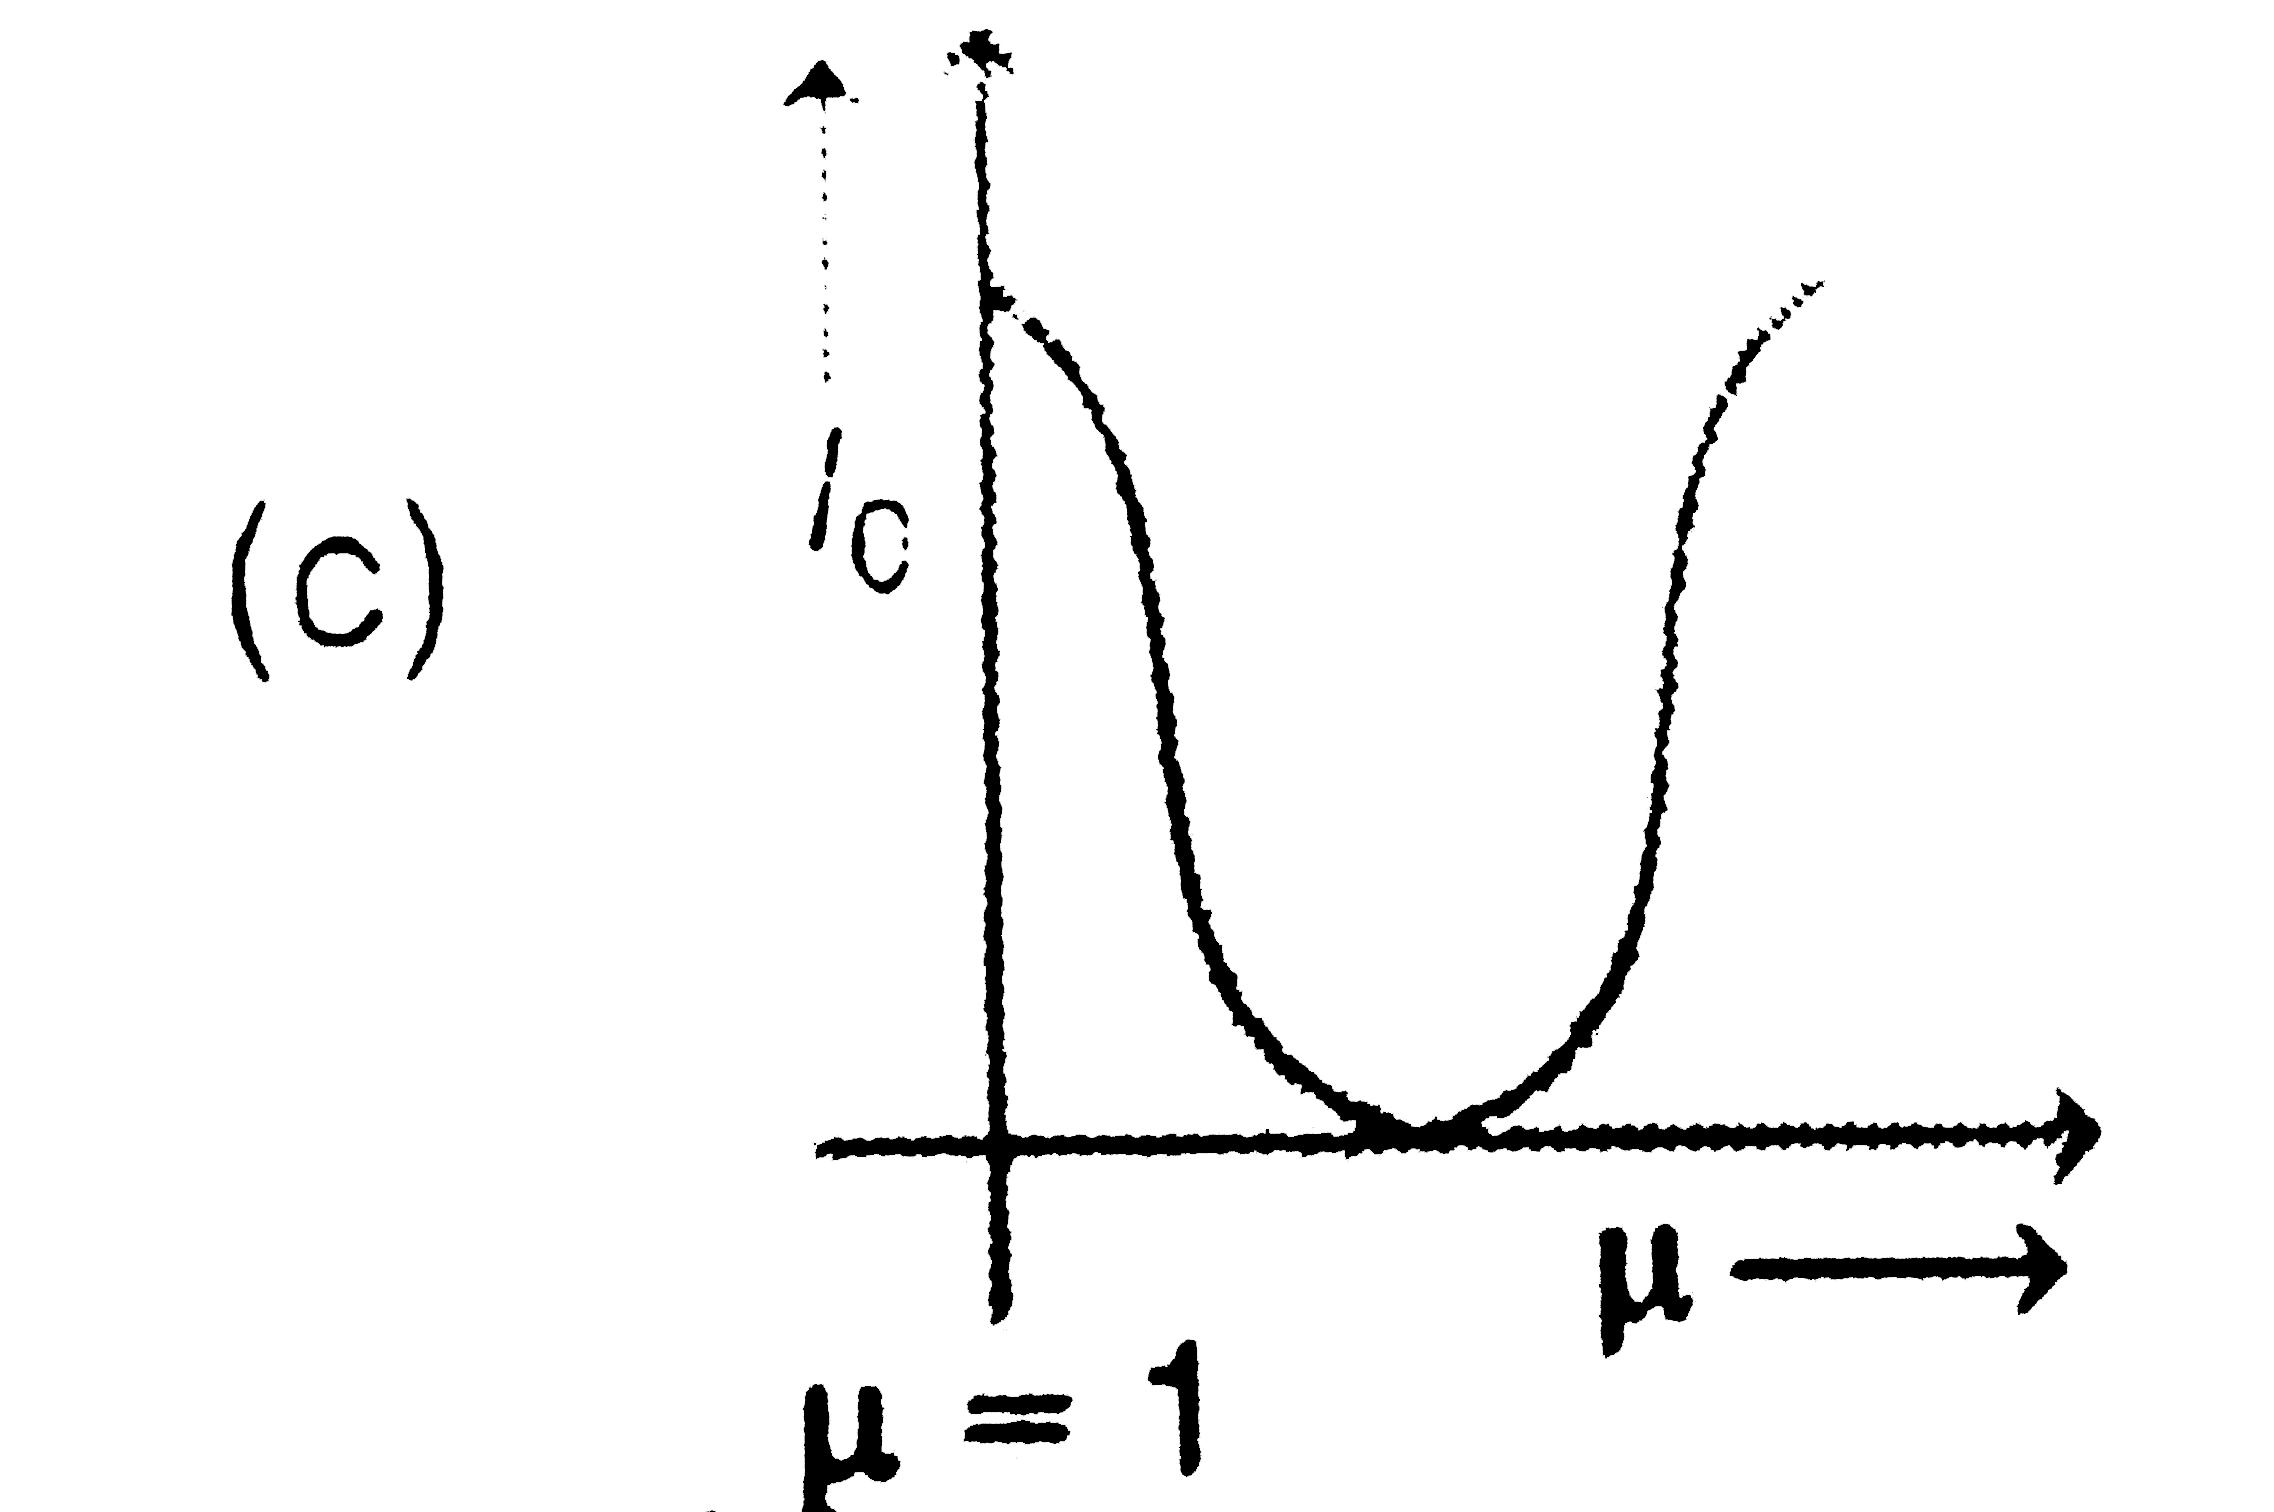
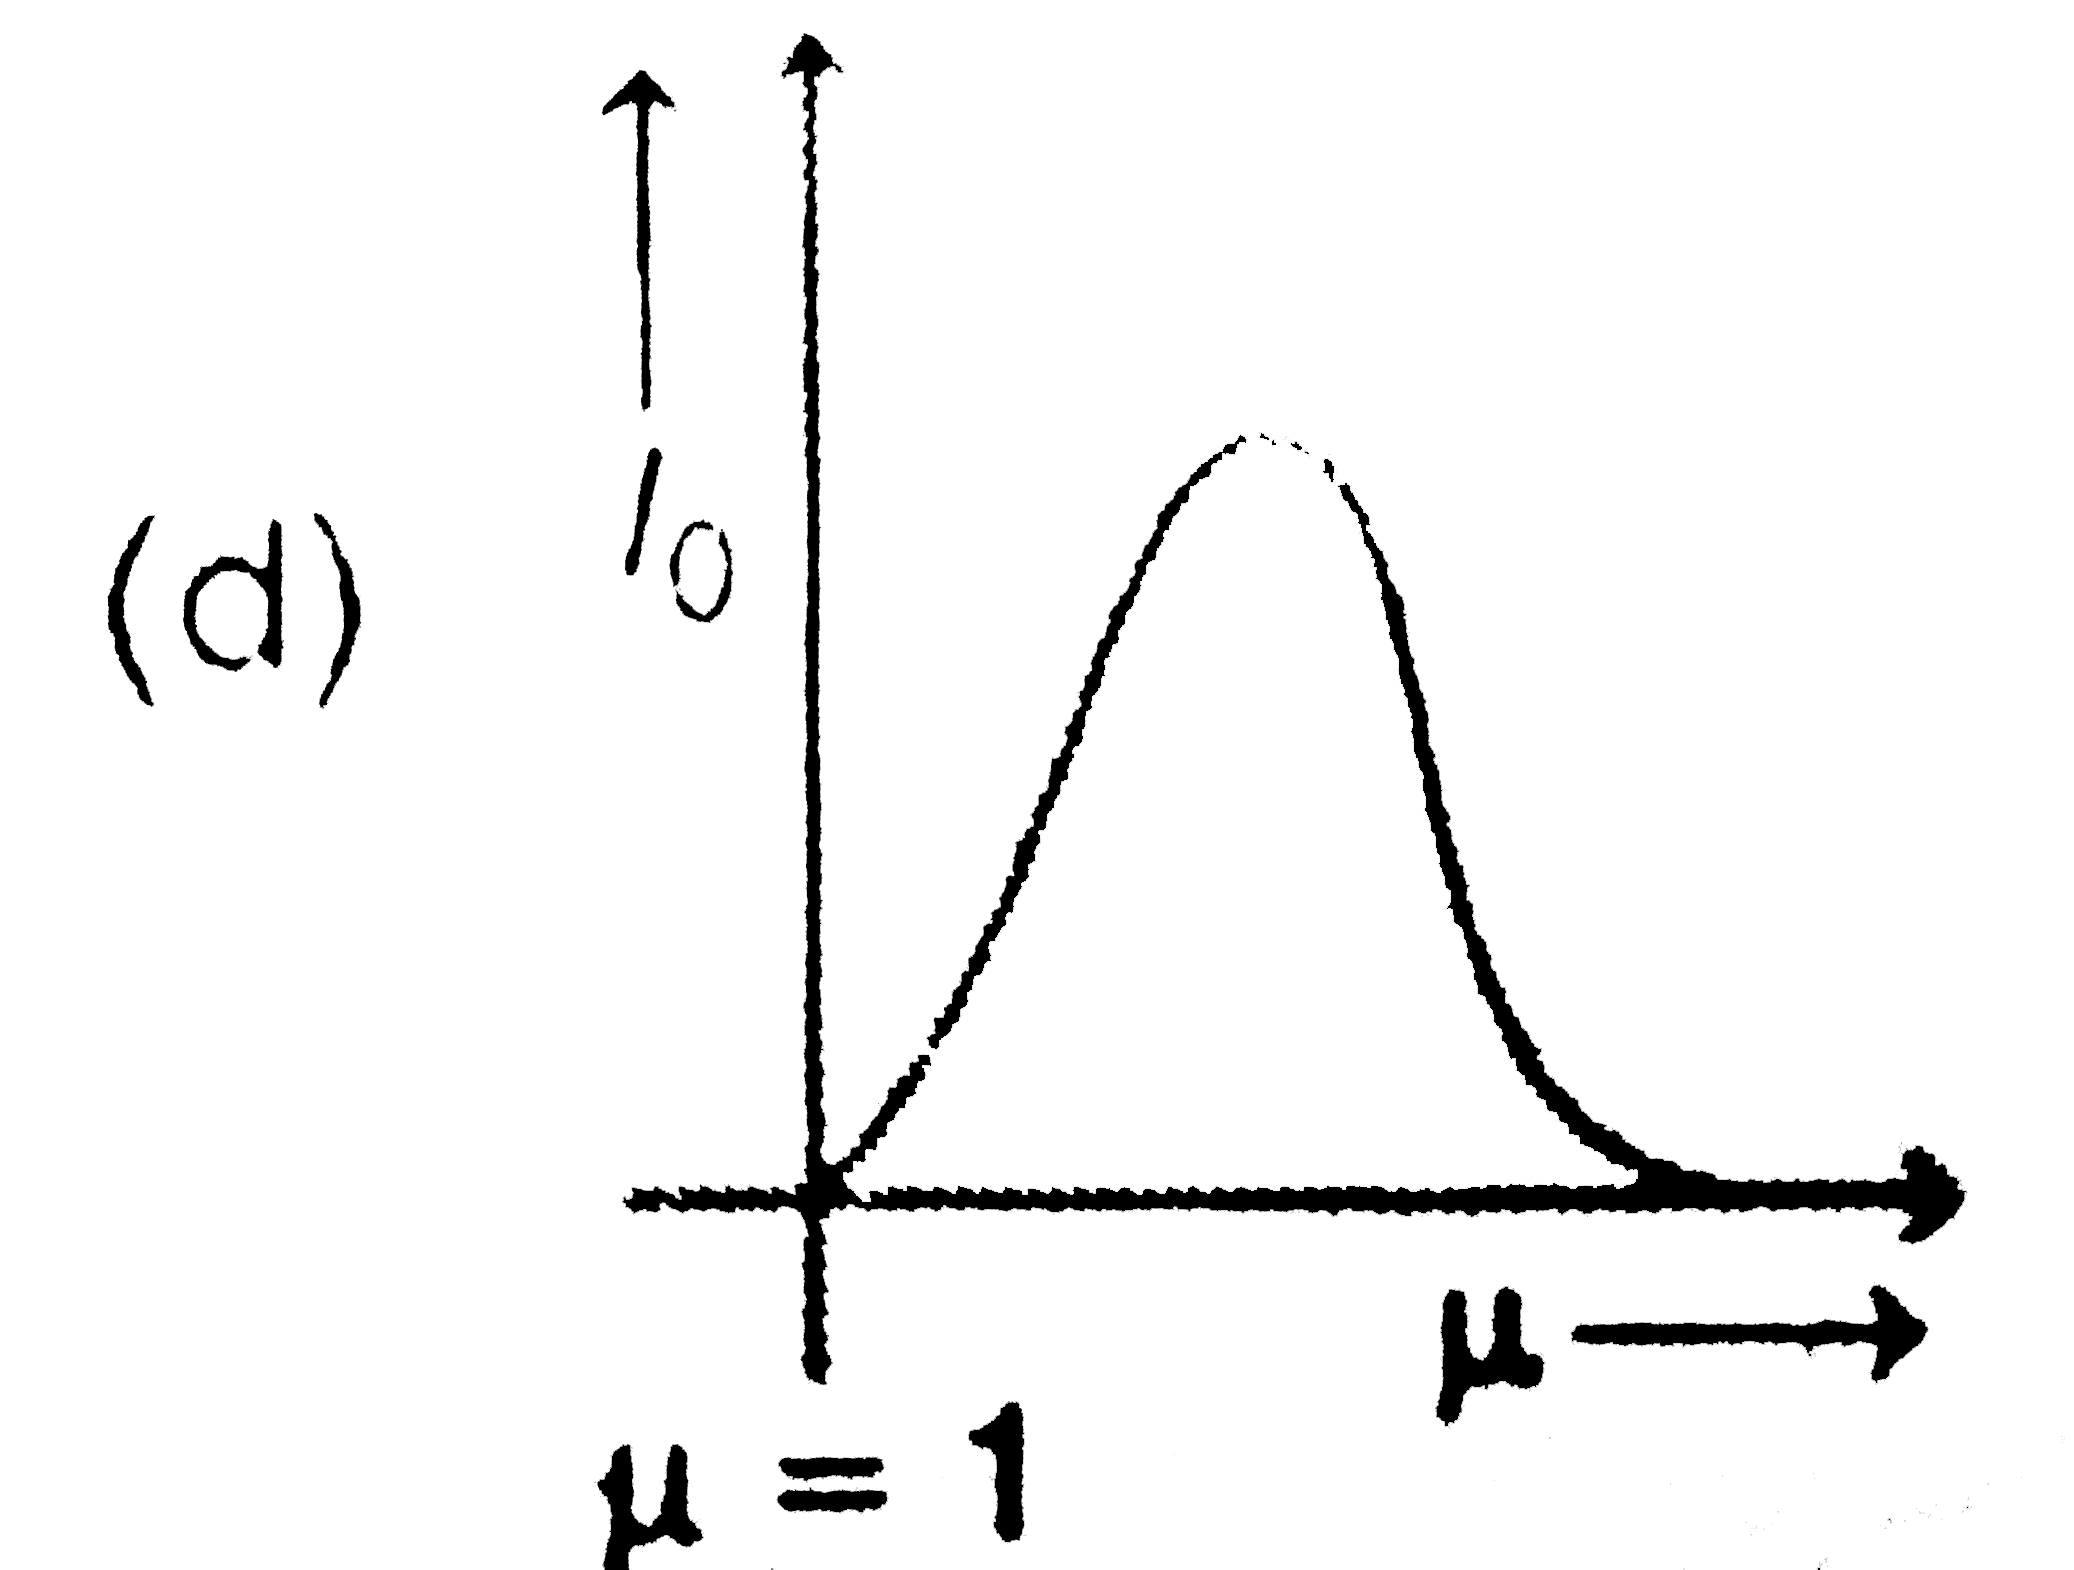
The correct Answer is:C
To solve the problem, we need to analyze the Young's Double Slit Experiment (YDSE) with a variable refractive index slab placed in front of one of the slits. The goal is to determine how the resultant intensity at the midpoint of the screen varies with the refractive index μ.
1. Understanding Path Difference:
In YDSE, when a slab of thickness t and refractive index μ is placed in front of one of the slits, the path difference Δx introduced by the slab is given by:
Δx=(μ−1)t
Hint: Remember that the path difference is influenced by the refractive index of the medium.
2. Calculating Phase Difference:
The phase difference ϕ corresponding to the path difference can be calculated using the formula:
ϕ=2πλΔx=2πλ(μ−1)t
Hint: Phase difference is directly related to path difference and wavelength.
3. Resultant Intensity:
The intensity I at the midpoint of the screen can be expressed in terms of the maximum intensity Imax and the phase difference:
I=Imaxcos2(ϕ2)
Substituting for ϕ:
I=Imaxcos2(πλ(μ−1)t)
Hint: The intensity is a function of the cosine squared of the phase difference.
4. Analyzing the Behavior of Intensity:
As μ varies:
- When μ=1, the path difference becomes zero, leading to maximum intensity:
I=Imaxcos2(0)=Imax
- As μ increases from 1, the path difference increases, causing the intensity to oscillate between maximum and minimum values.
Hint: Consider the behavior of the cosine function as its argument changes.
5. Graphical Representation:
The intensity will vary in a periodic manner as μ increases. The graph of intensity versus μ will show maxima at μ=1 and will oscillate as μ increases further.
Hint: Sketch the graph of cos2(x) to visualize the oscillation of intensity.
6. Conclusion:
The variation of resultant intensity at the midpoint of the screen with varying μ can be summarized as:
- For μ≥1, the intensity will oscillate, reaching maximum at μ=1.
Final Answer:
The variation of resultant intensity at the midpoint of the screen with μ is best represented by the oscillatory behavior of cos2 function, starting from maximum intensity at μ=1.
---
In YDSE, when a slab of thickness t and refractive index μ is placed in front of one of the slits, the path difference Δx introduced by the slab is given by:
Δx=(μ−1)t
The phase difference ϕ corresponding to the path difference can be calculated using the formula:
ϕ=2πλΔx=2πλ(μ−1)t
The intensity I at the midpoint of the screen can be expressed in terms of the maximum intensity Imax and the phase difference:
I=Imaxcos2(ϕ2)
Substituting for ϕ:
I=Imaxcos2(πλ(μ−1)t)
As μ varies:
- When μ=1, the path difference becomes zero, leading to maximum intensity:
I=Imaxcos2(0)=Imax
- As μ increases from 1, the path difference increases, causing the intensity to oscillate between maximum and minimum values.
The intensity will vary in a periodic manner as μ increases. The graph of intensity versus μ will show maxima at μ=1 and will oscillate as μ increases further.
The variation of resultant intensity at the midpoint of the screen with varying μ can be summarized as:
- For μ≥1, the intensity will oscillate, reaching maximum at μ=1.
The variation of resultant intensity at the midpoint of the screen with μ is best represented by the oscillatory behavior of cos2 function, starting from maximum intensity at μ=1.
Topper's Solved these Questions
- WAVE OPTICSBOOK - DC PANDEY ENGLISHCHAPTER - WAVE OPTICSEXERCISE - For JEE Advanced B. More than one option is correct
4 Videos
- WAVE OPTICSBOOK - DC PANDEY ENGLISHCHAPTER - WAVE OPTICSEXERCISE - For JEE Advanced C. Comprehension Type Questions. Passage (I)
2 Videos
- WAVE OPTICSBOOK - DC PANDEY ENGLISHCHAPTER - WAVE OPTICSEXERCISE - For JEE main (Only one option is Correct )
22 Videos
- SOLVED PAPERS 2018BOOK - DC PANDEY ENGLISHCHAPTER - SOLVED PAPERS 2018EXERCISE - JIPMER
22 Videos
Similar Questions
In a YDSE if a slab whose refractive index can be varied is palced in fron of one of the slits then the variation of resultant intensity of mid-point of screen with μ will be represented by (assume slits of equal width and there is no absorption by slab)
View SolutionIn YDSE when slab of thickness t and refractive index μ is placed in front of one slit then central maxima shifts by one fringe width. Find out t in terms of λ and μ.
View SolutionIn YDSE, slab of thickness t and refractive index μ is placed in front of any slit. Then displacement of central maximu is terms of fringe width when light of wavelength λ is incident on system is
View SolutionMinimum thickness of a mica sheet having μ=32 which should be placed in front of one of the slits in YDSE is required to reduce the intensity at the centre of screen to half of maximum intensity is
View SolutionIn young's double-slit experiment, both the slits produce equal intensities on a screen. A 100% transparent thin film of refractive index μ=1.5 is kept in front of one of the slits, due to which the intensity at the point O on the screen becomes 75% of its initial value. If the wavelength of monochromatic light is 720 nm, then what is the minimum thickness (in nm) of the film?
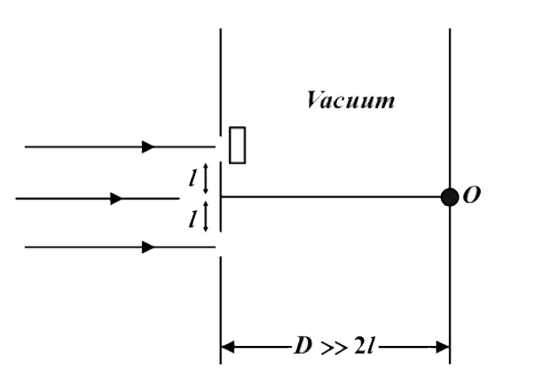
View SolutionThe slits in a double-slit interference experiment are illuminated by orange light (λ=60nm). A thin transparent plastic of thickness t is placed in front of one of the slits. The nunber of fringes shifting on screen is plotted versus the refractive index μ of the plastic in graph shown in figure. The value of t is
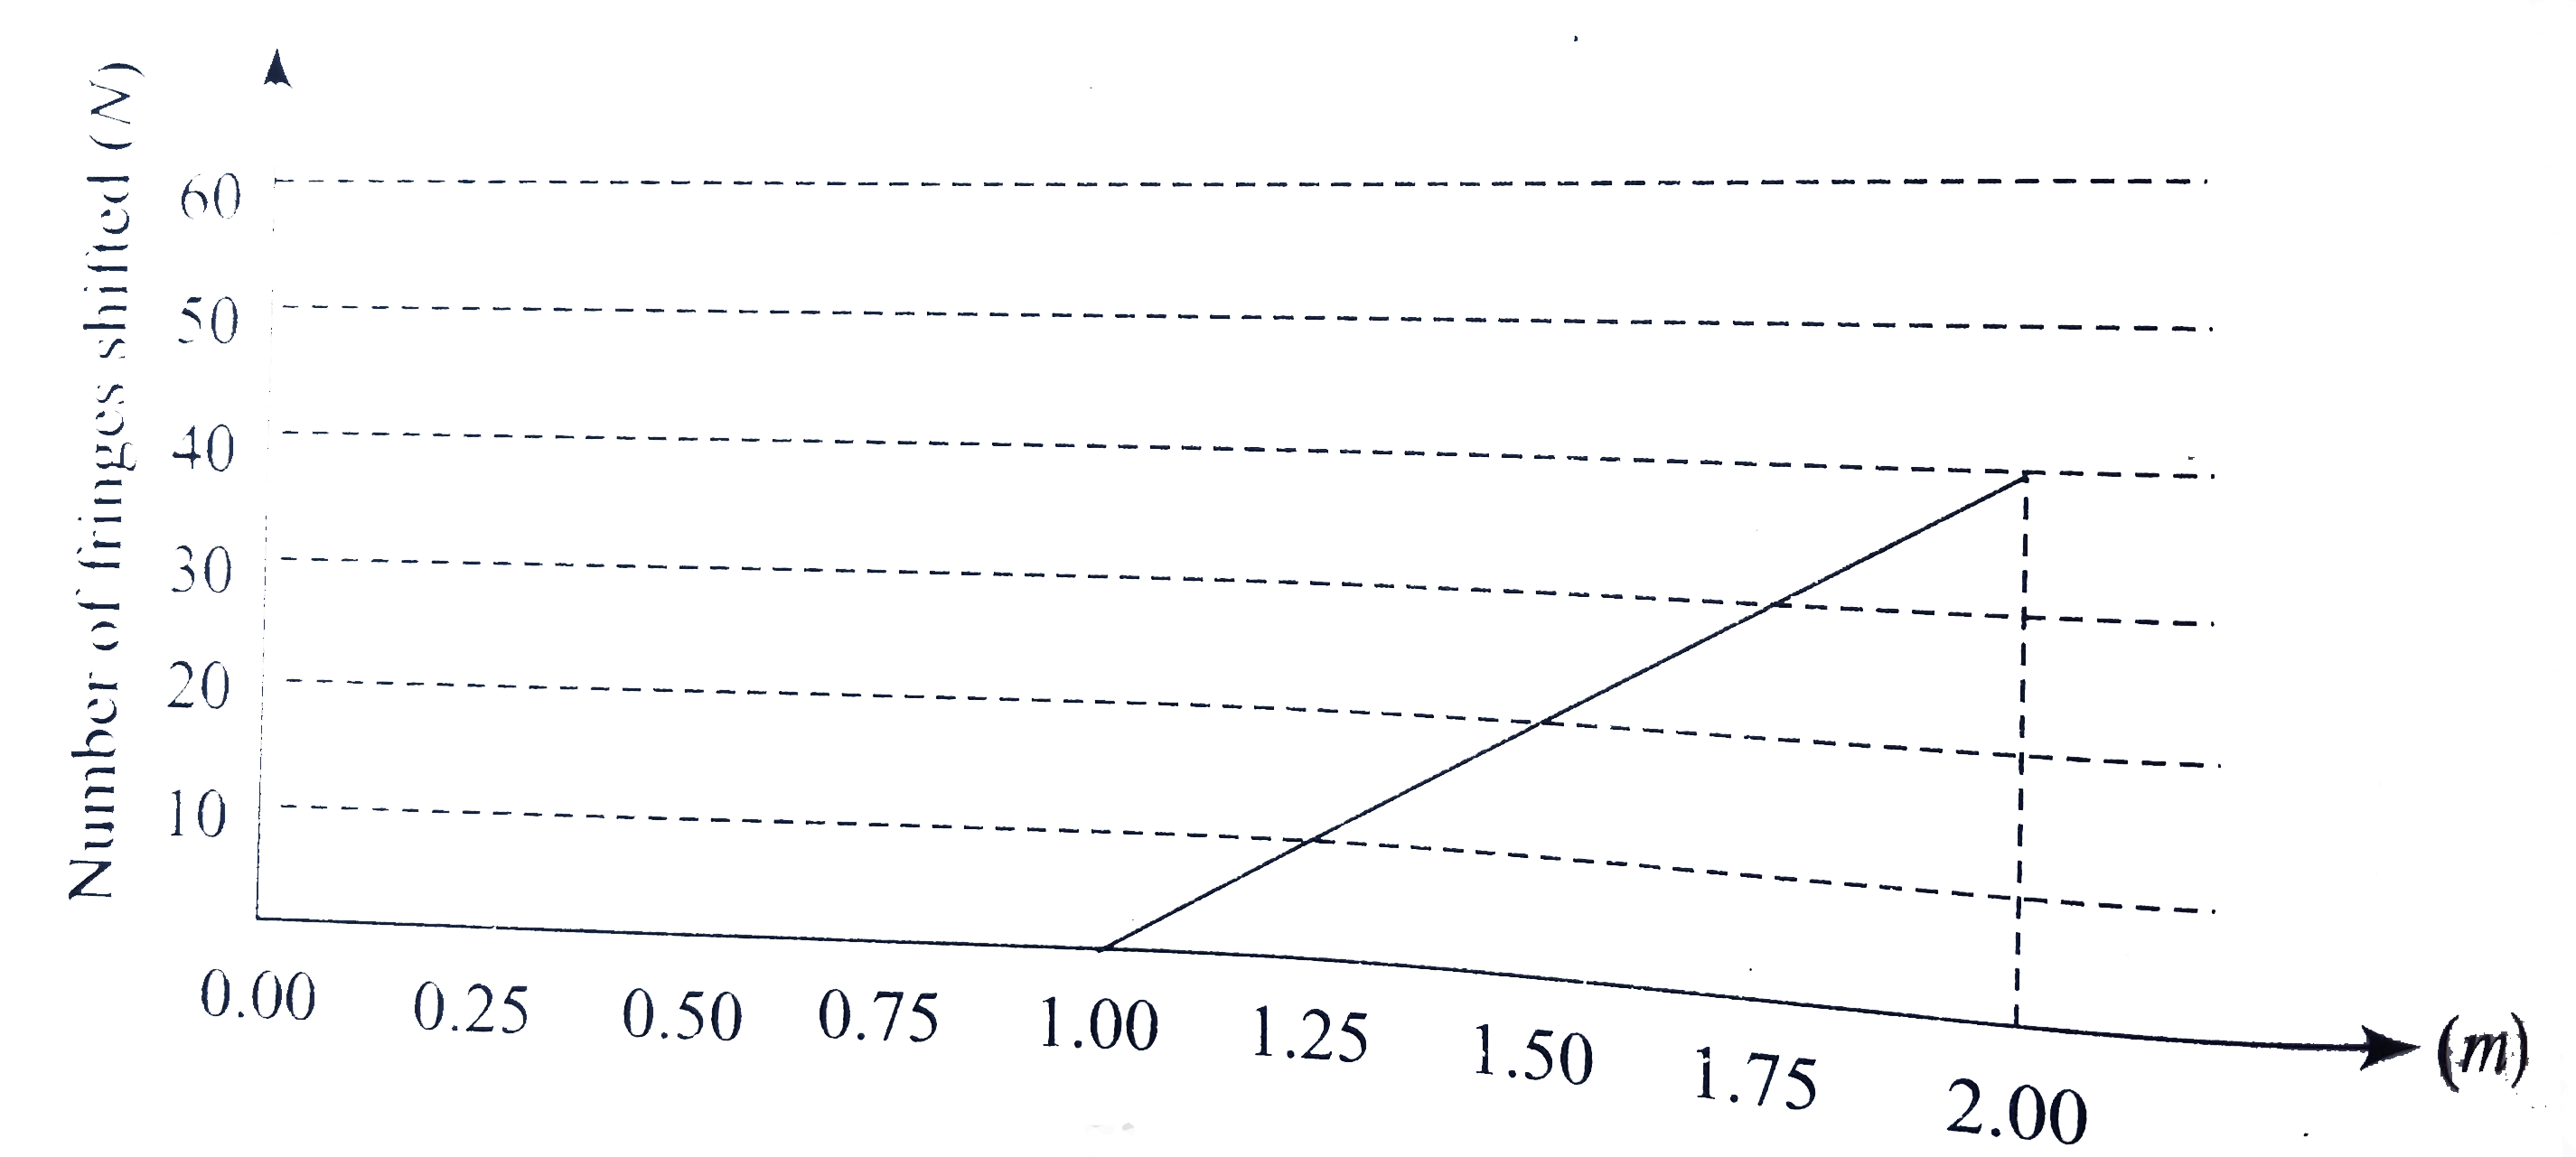
View SolutionIn YDSE, both slits produce equal intensities on the screen. A 100% transparent thin film is placed in front of one of the slits. Now, the intensity on the centre becomes 75% of the previous intensity. The wavelength of light is 6000Å and refractive index of glass is 1.5. Thus, minimum thickness of the glass slab is
View SolutionA monochromatic light of λ=500nm is incident on two identical slits separated by a distance of 5×10⁻⁴m. The interference pattern is seen on a screen placed at a distance of 1m from the plane of slits. A thin glass plate of thickness 1.5×10⁻⁶m and refractive index μ=1.5 is placed between one of the slits and the screen. Find the intensity at the center of the screen if the intensity is I0 in the absence of the plate. Also find the lateral shift of the central maxima and number of fringes crossed through center.
View SolutionA thin glass plate of thickness t and refractive index μ is inserted between screen and one of the slits in a young's experiment. If the intensity at the centre of the screen is I, what was the intensity at the same point prior to the introduction of the sheet.
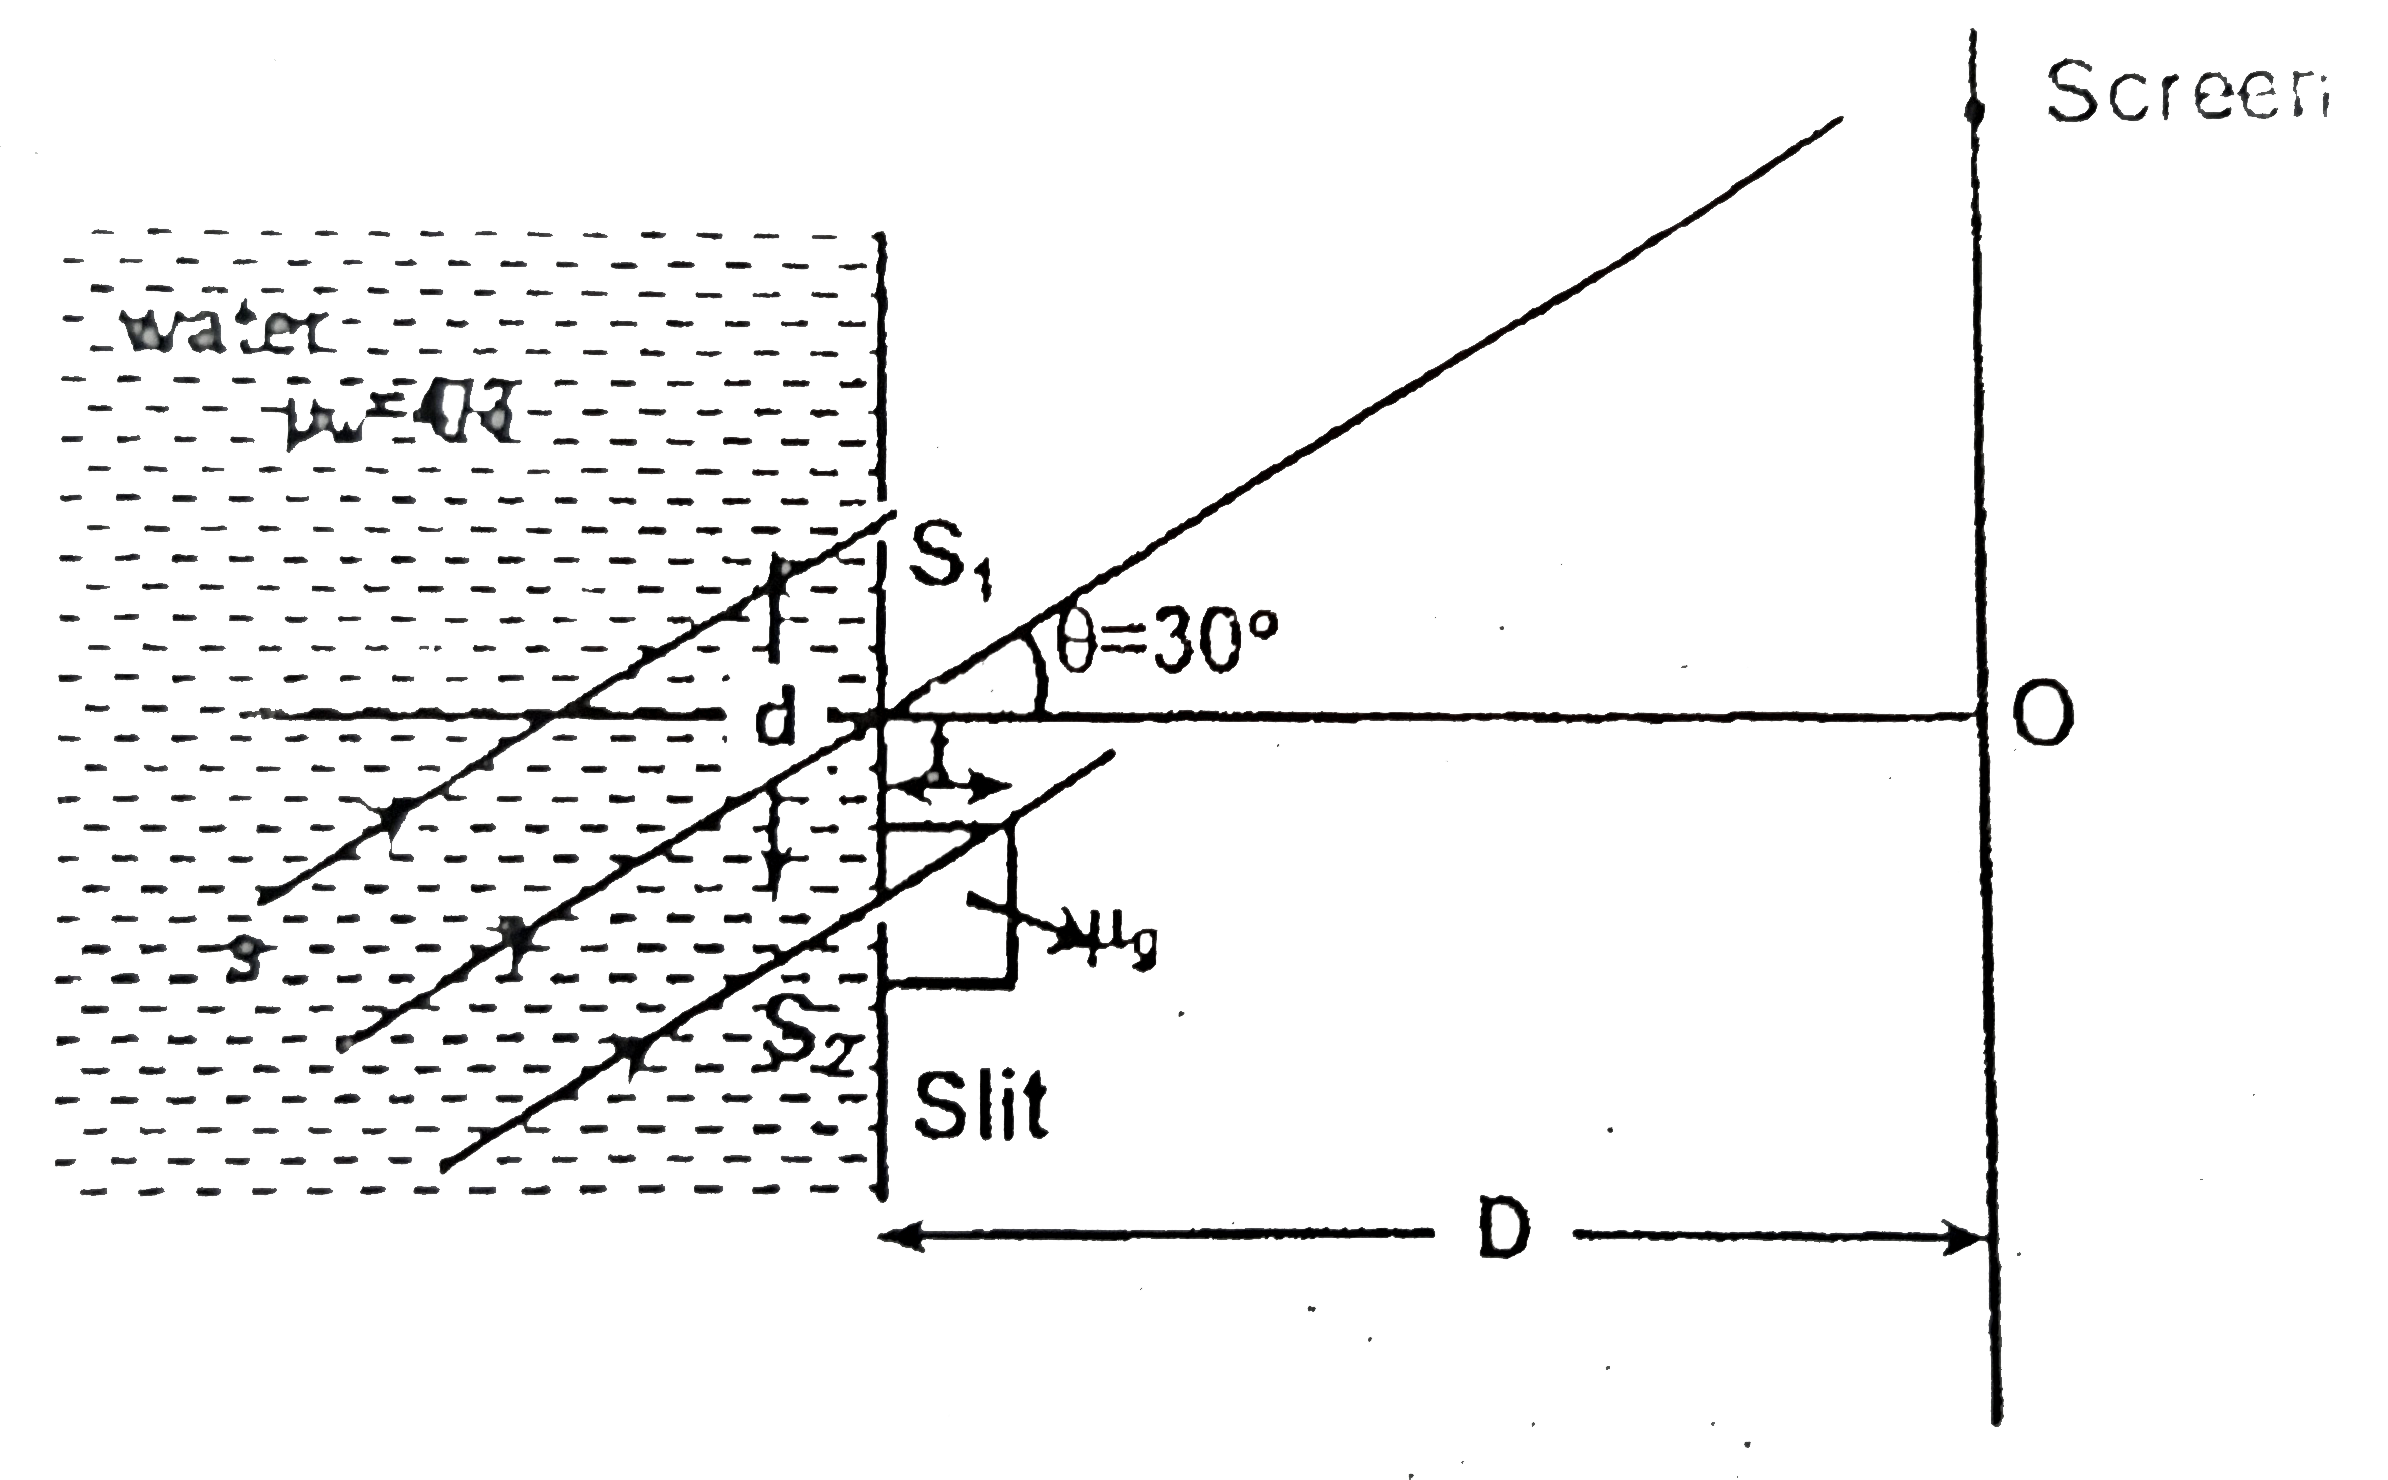
View SolutionIn a YDSE experiment the two slits are covered with a transparent membrane of negligible thickness which allows light to pass through it but does not allow water. A glass slab of thickness t=0.41mm and refractive index μg=1.5 is placed infront of one of the slits as shown in the figure. The separation between the slits is d=0.30mm. The entire space to the left of the slits is filled with water of refractive index μw=4/3.
A coherent light of intensity I and absolute wavelength λ=5000Å is being incident on the slits making an angle 30∘ with horizontal. If screen is placed at a distance D=1m from the slits, find
(a) the position of central maxima.
(b) the intensity at point O.
View Solution
