Draw a graph showing the variation of g with depth and height from the surface of earth. Assume that the density of the earth is a constant.
Text Solution
A graph showing the variation of g with depth and height from the surface of earth- 
|
Similar Questions
Knowledge Check
The graph that represents variation of g with depth (d) from the surface of the earth is
A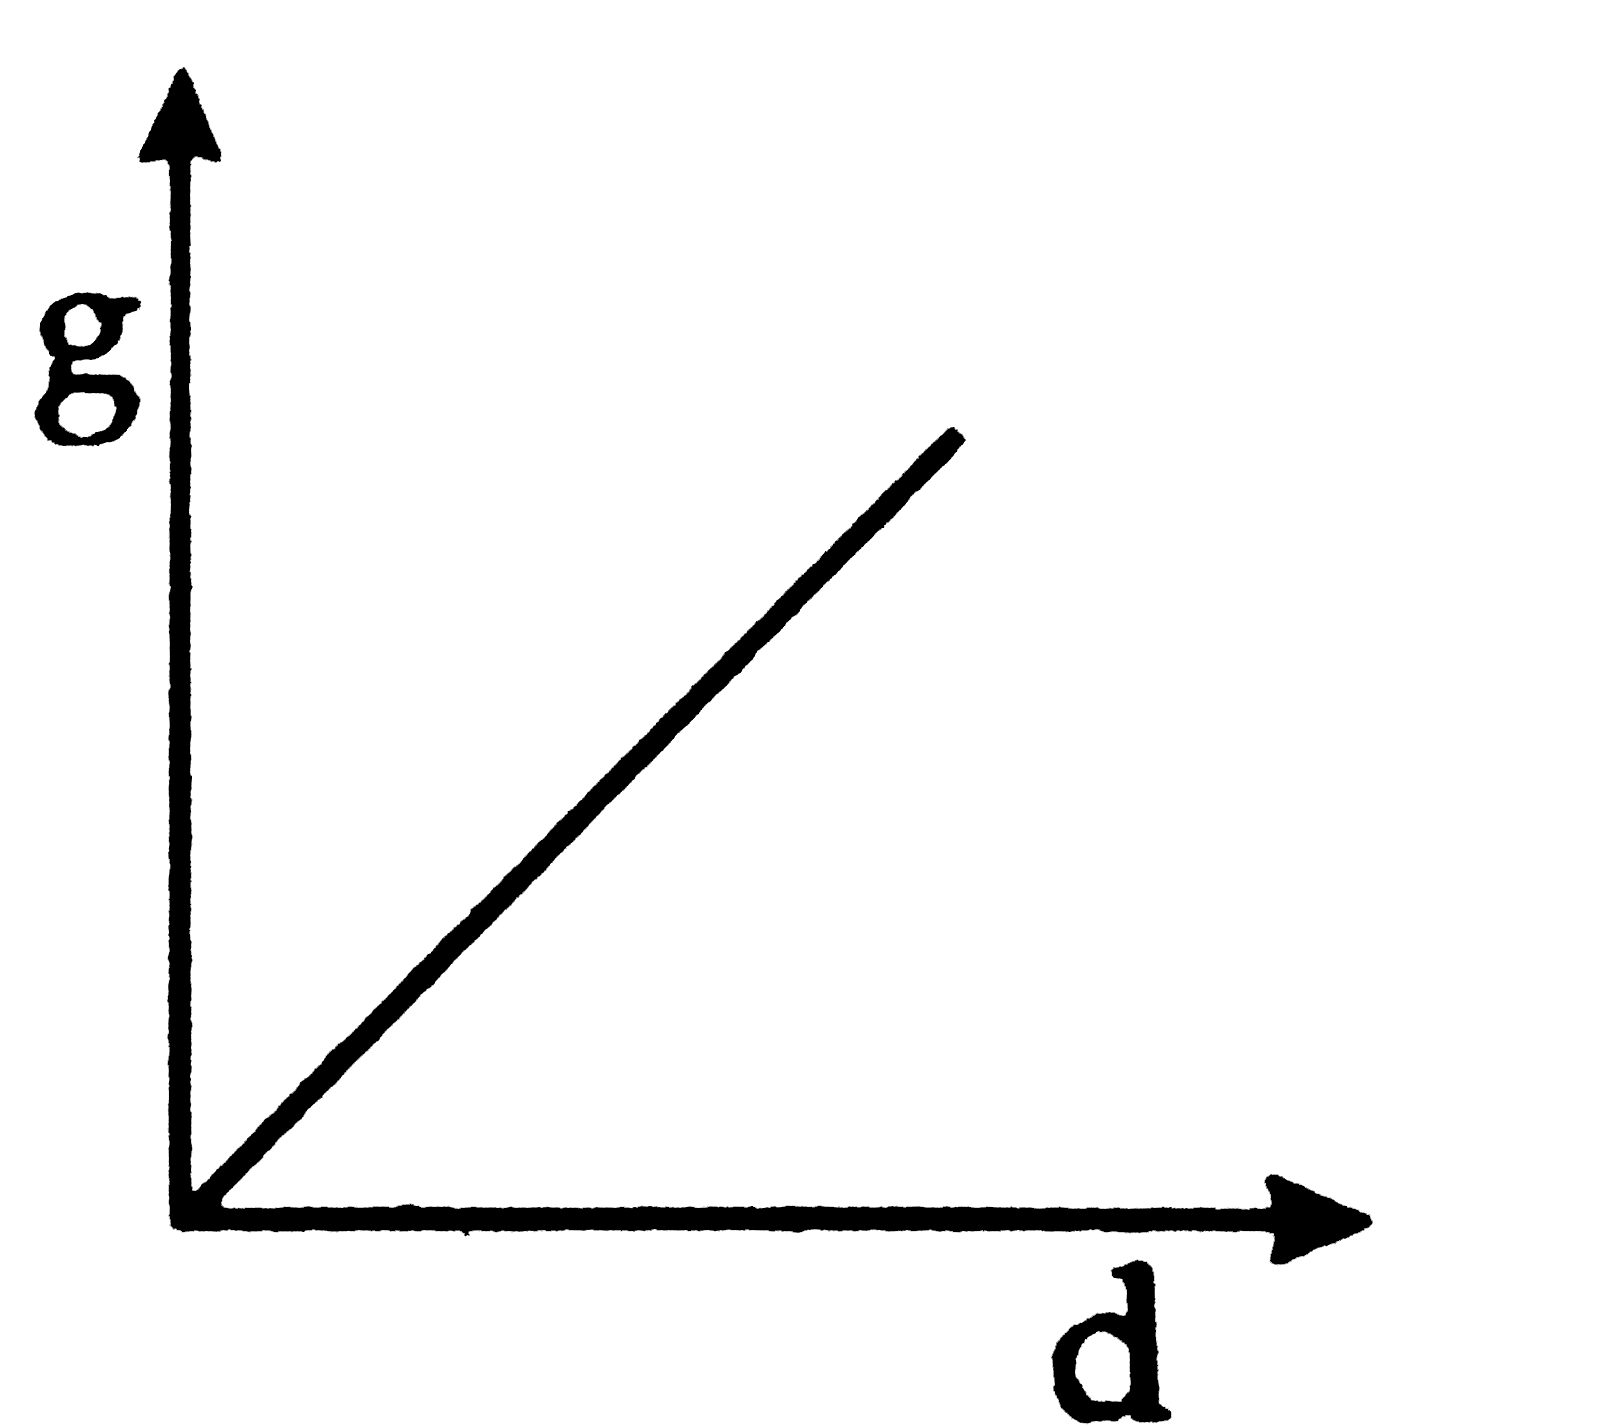 B
B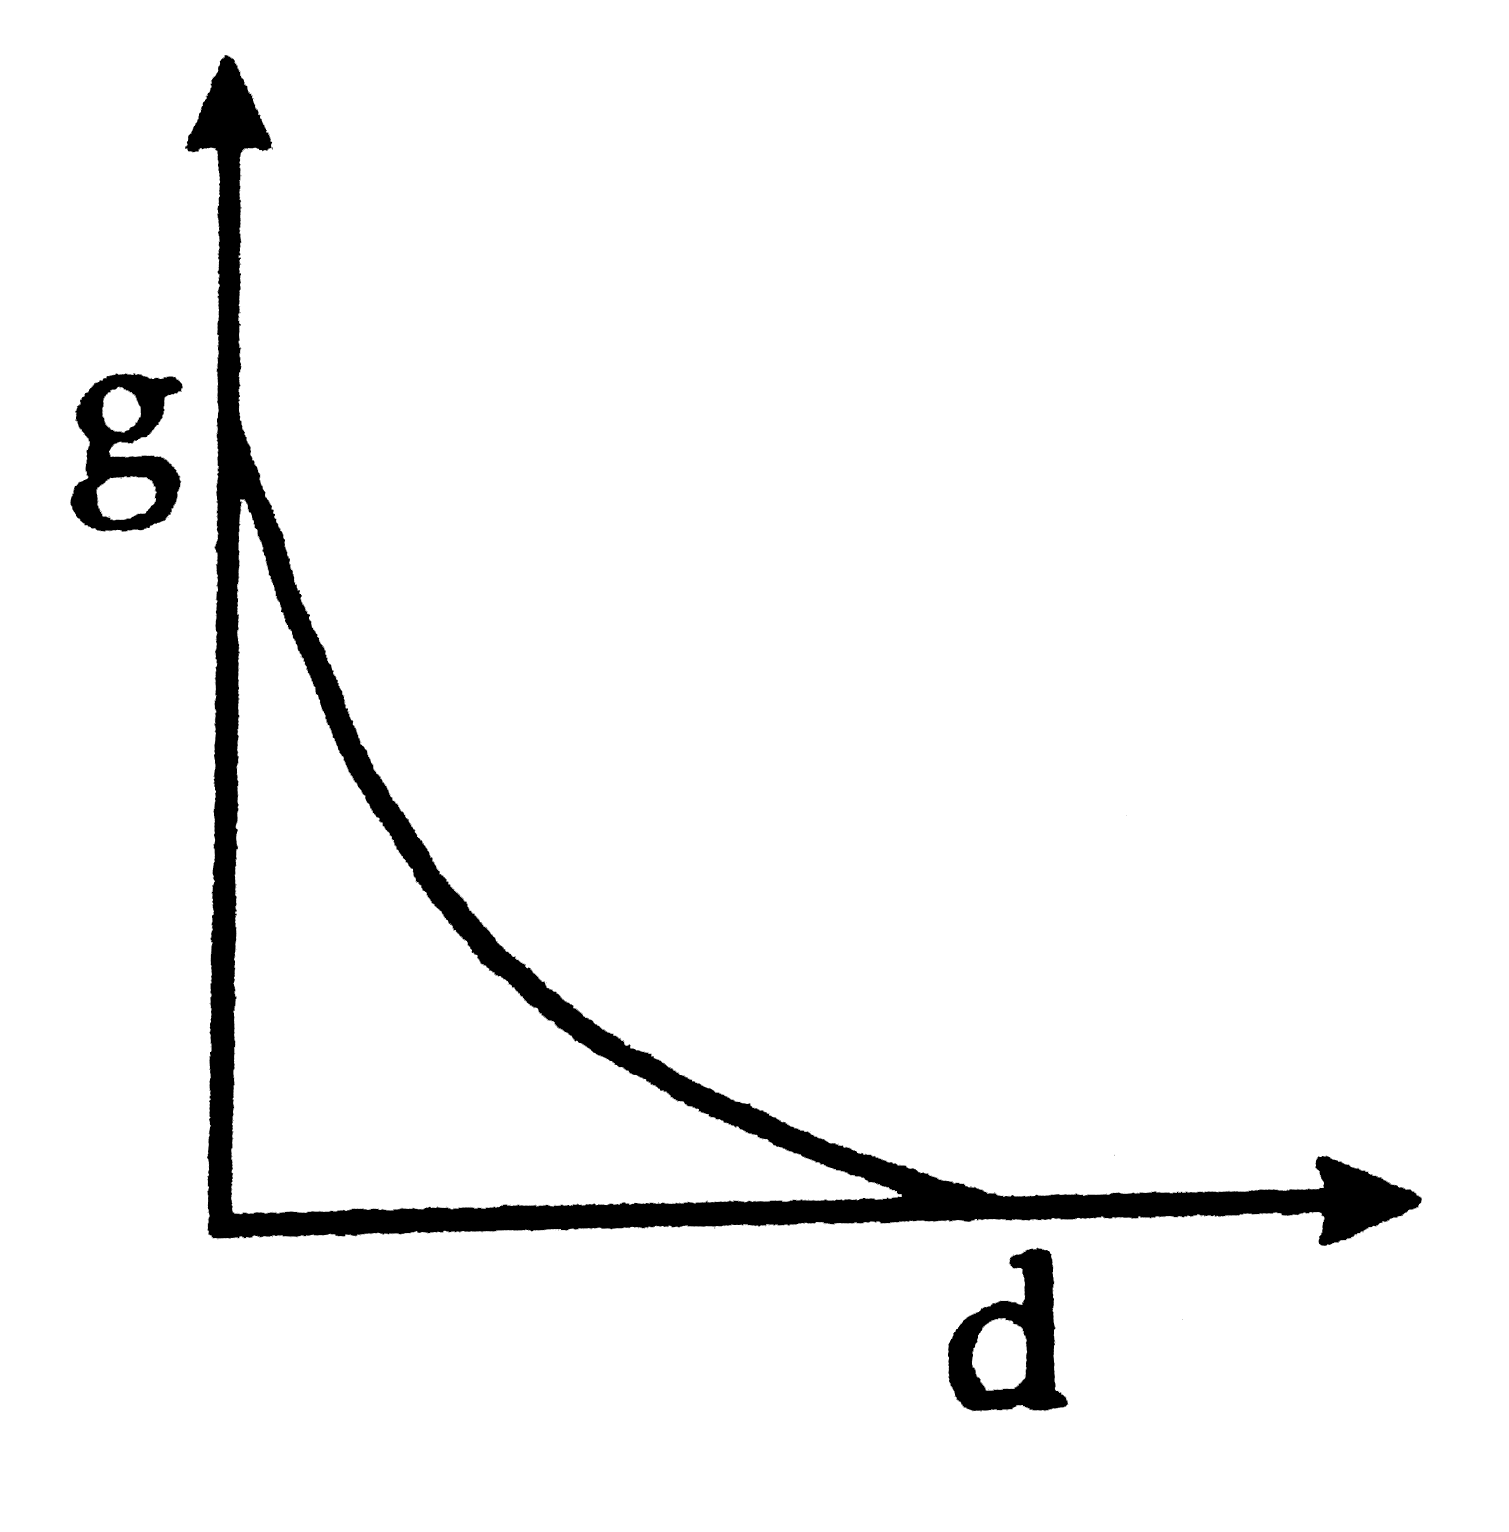 C
C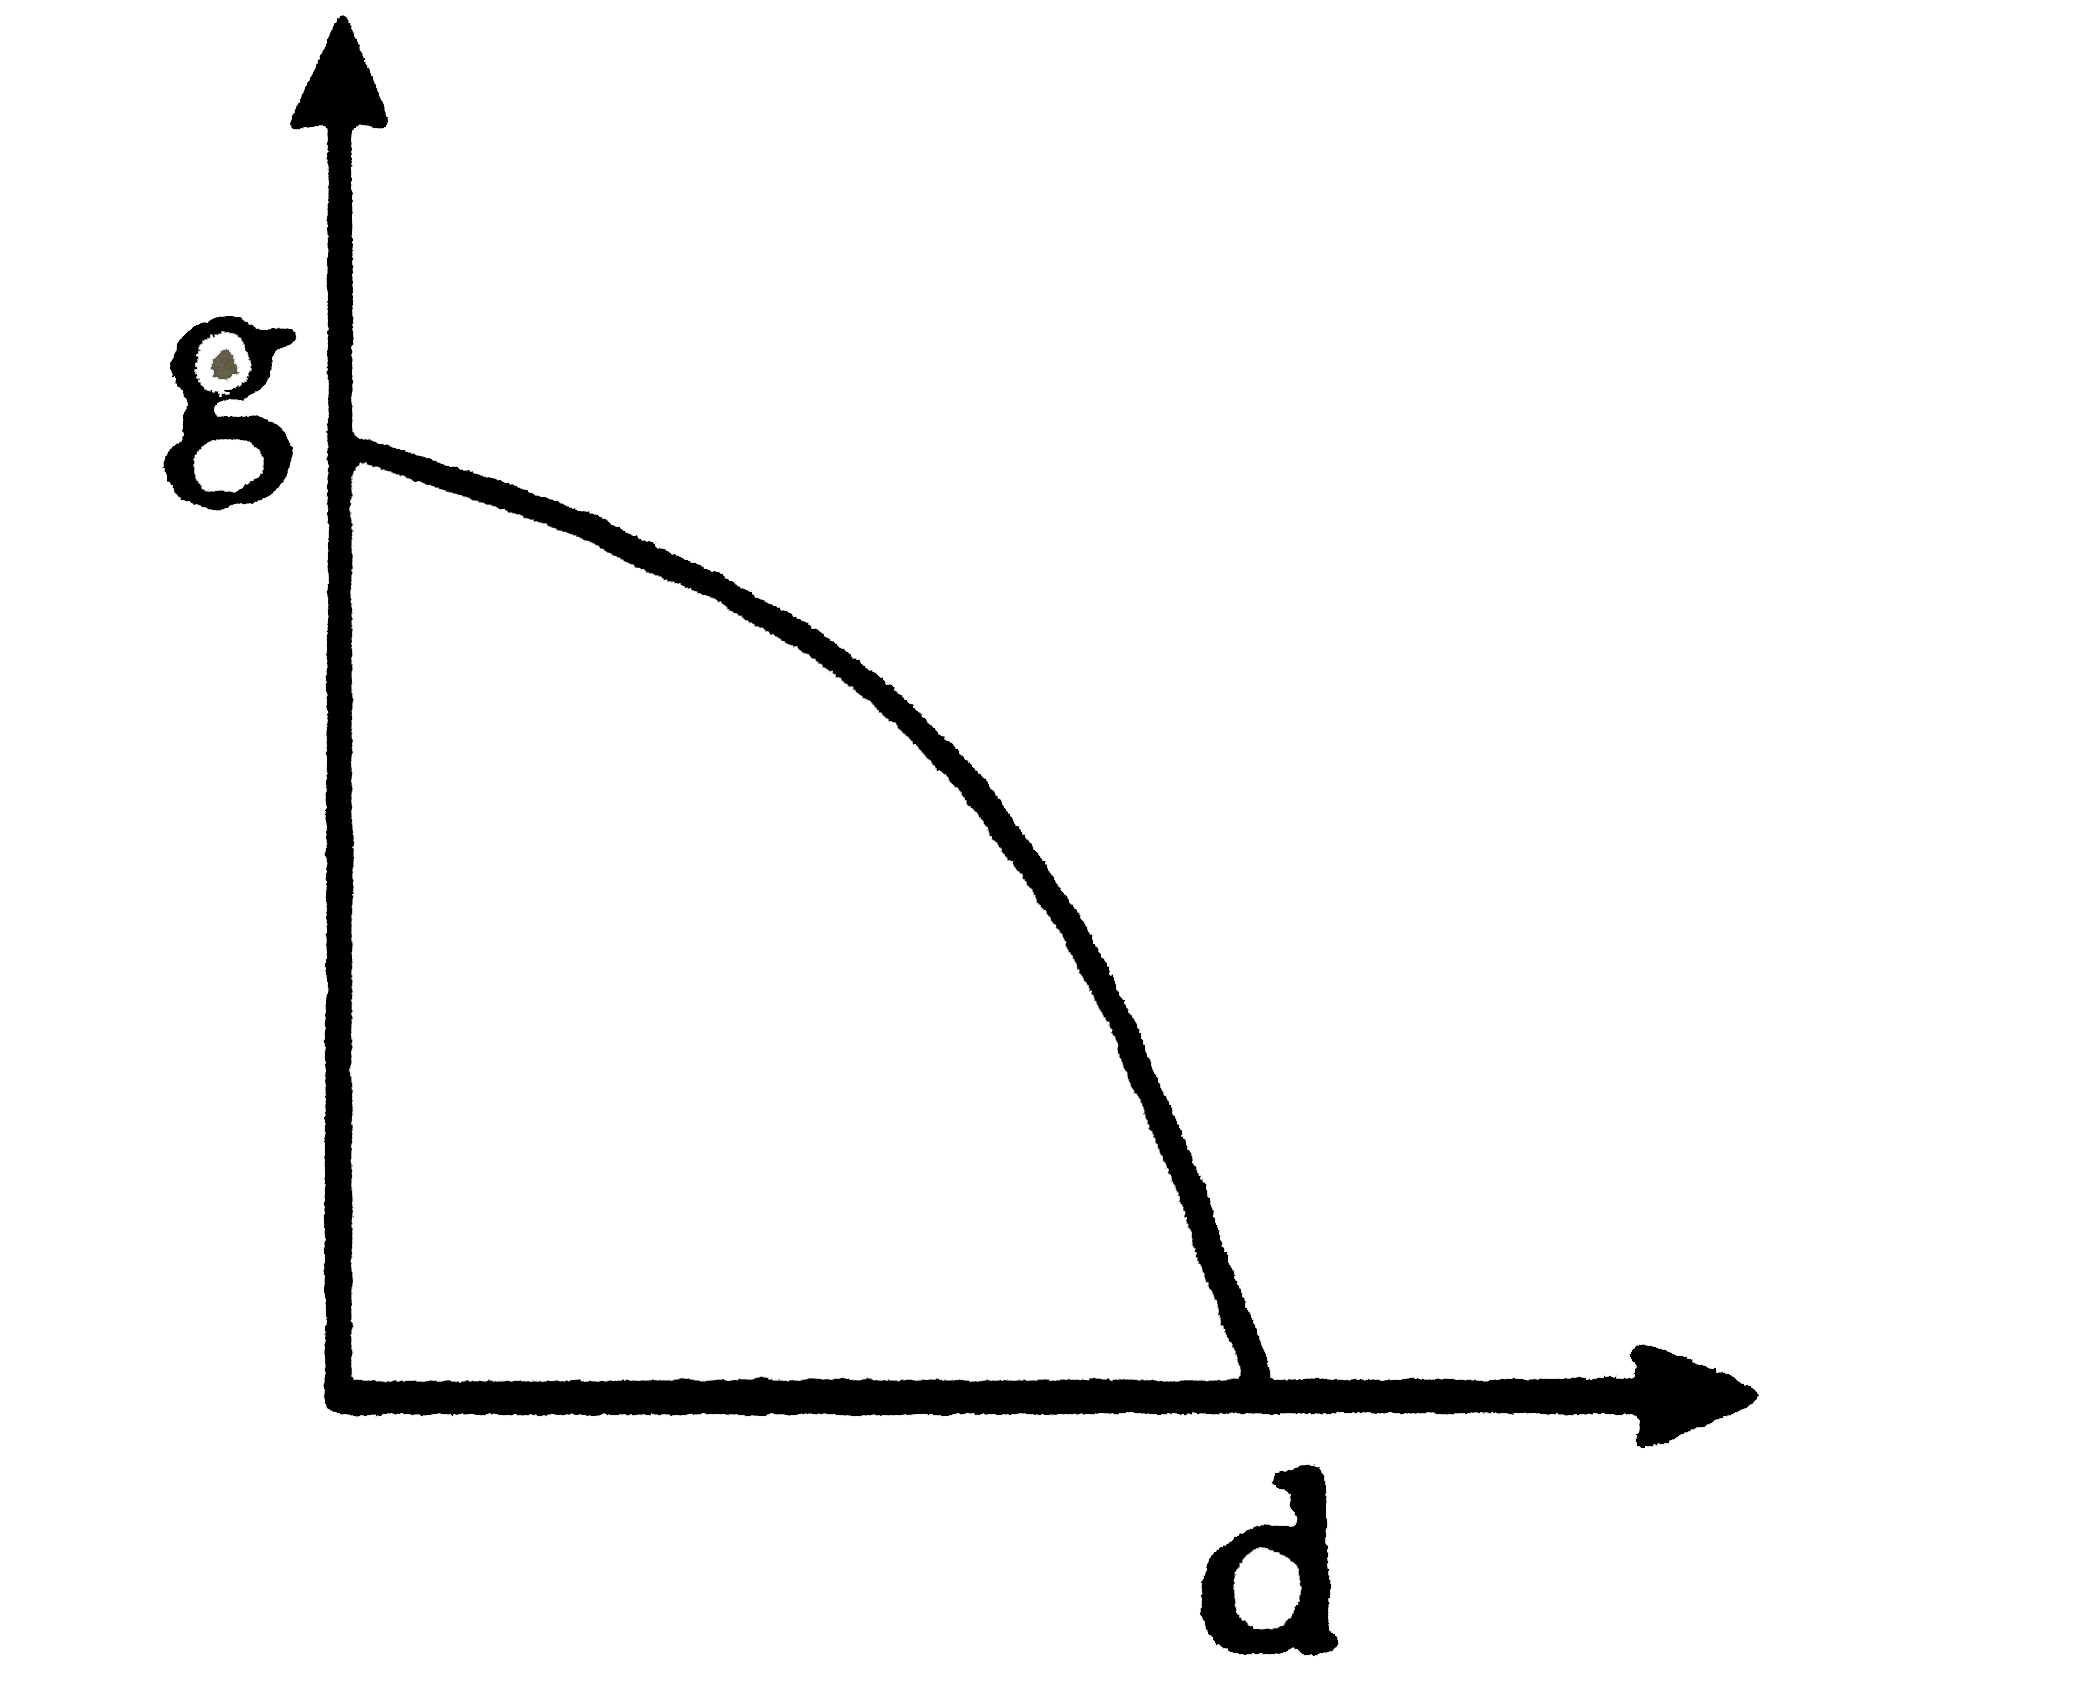 D
D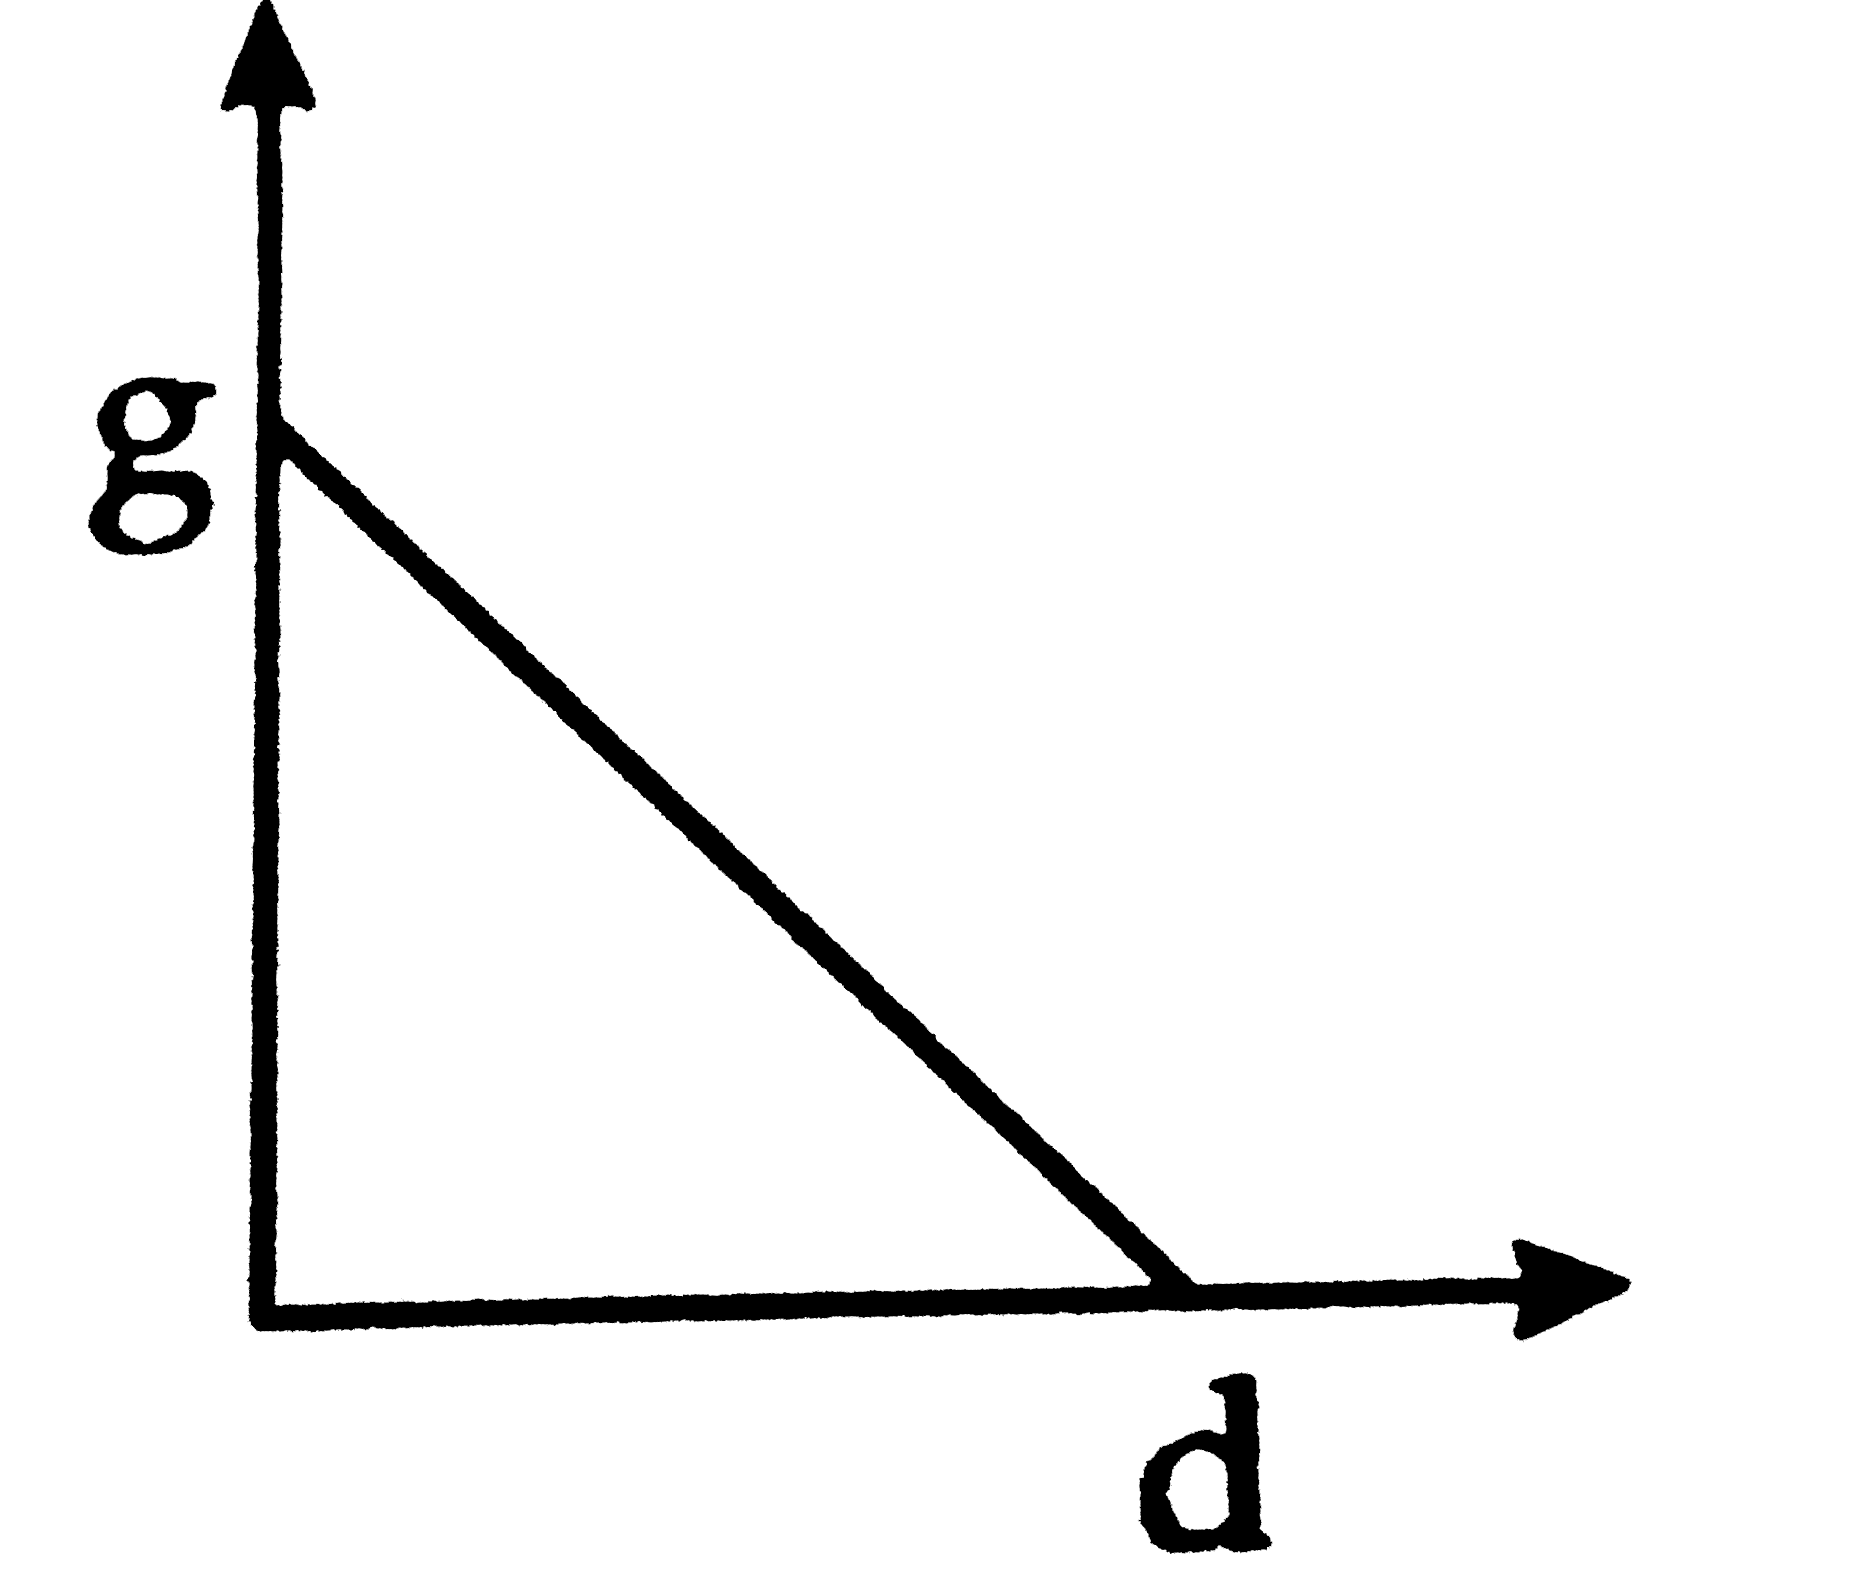
The graph that represents variation of g with height (h) from the surface of the earth is
A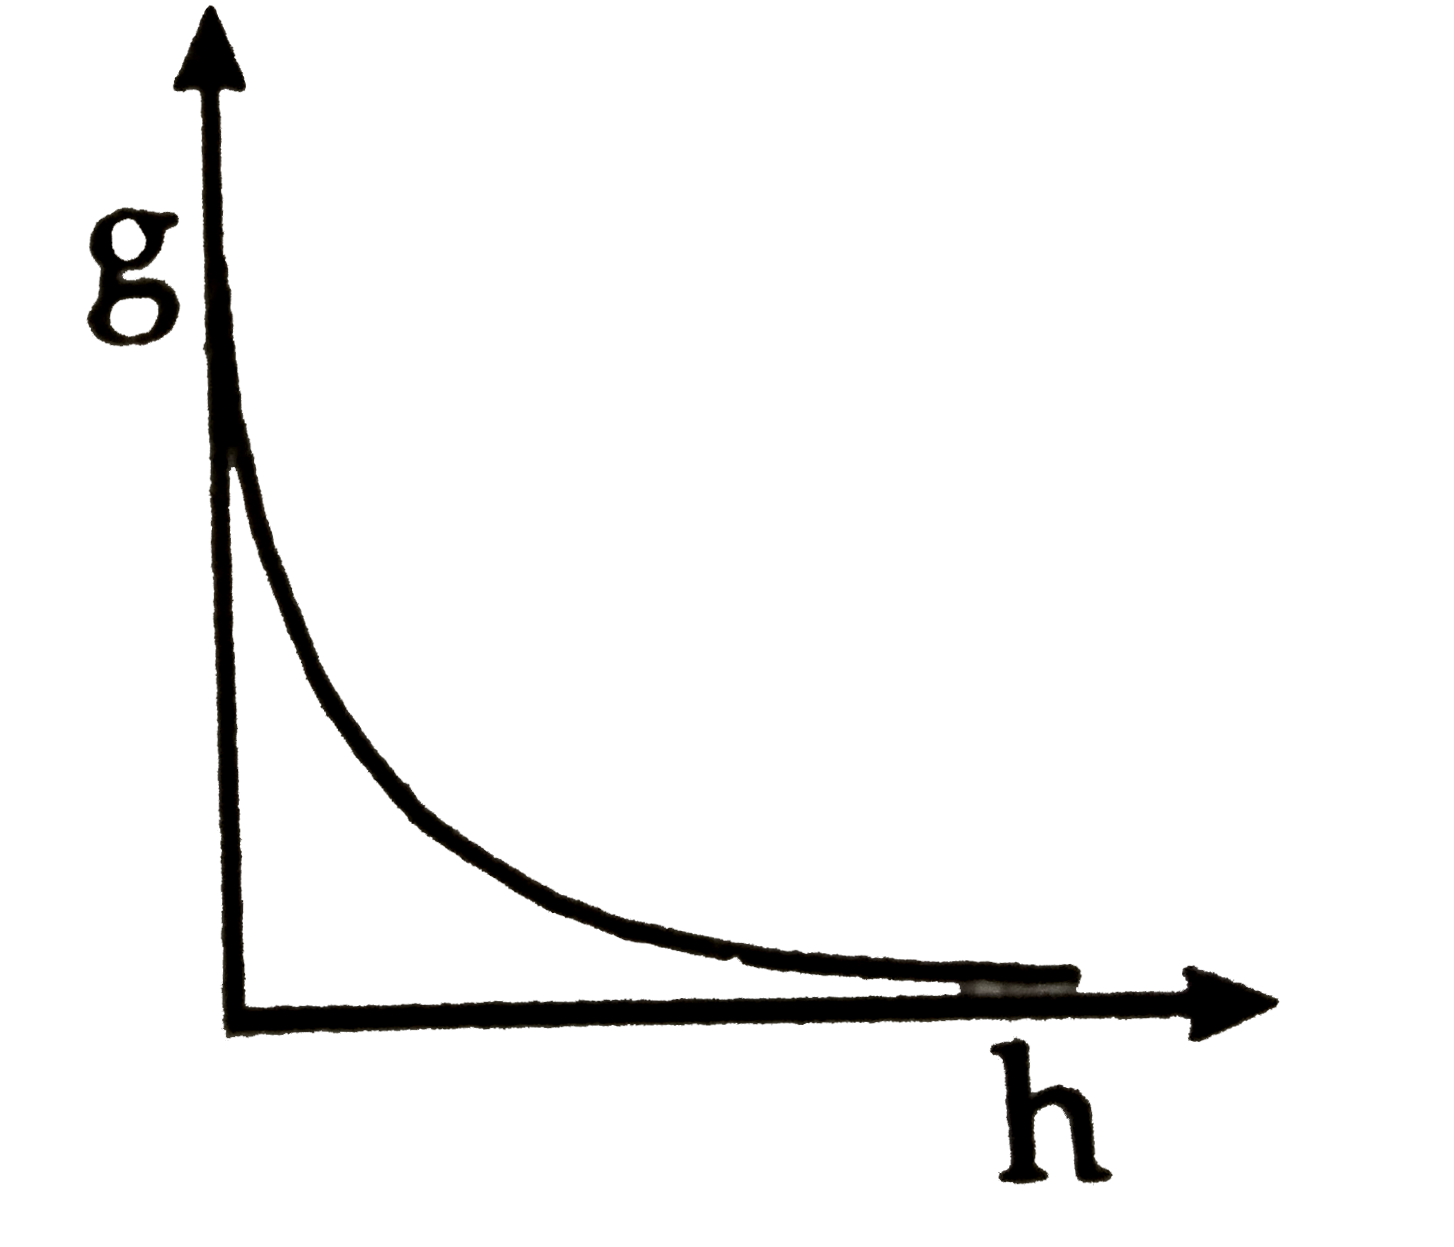 B
B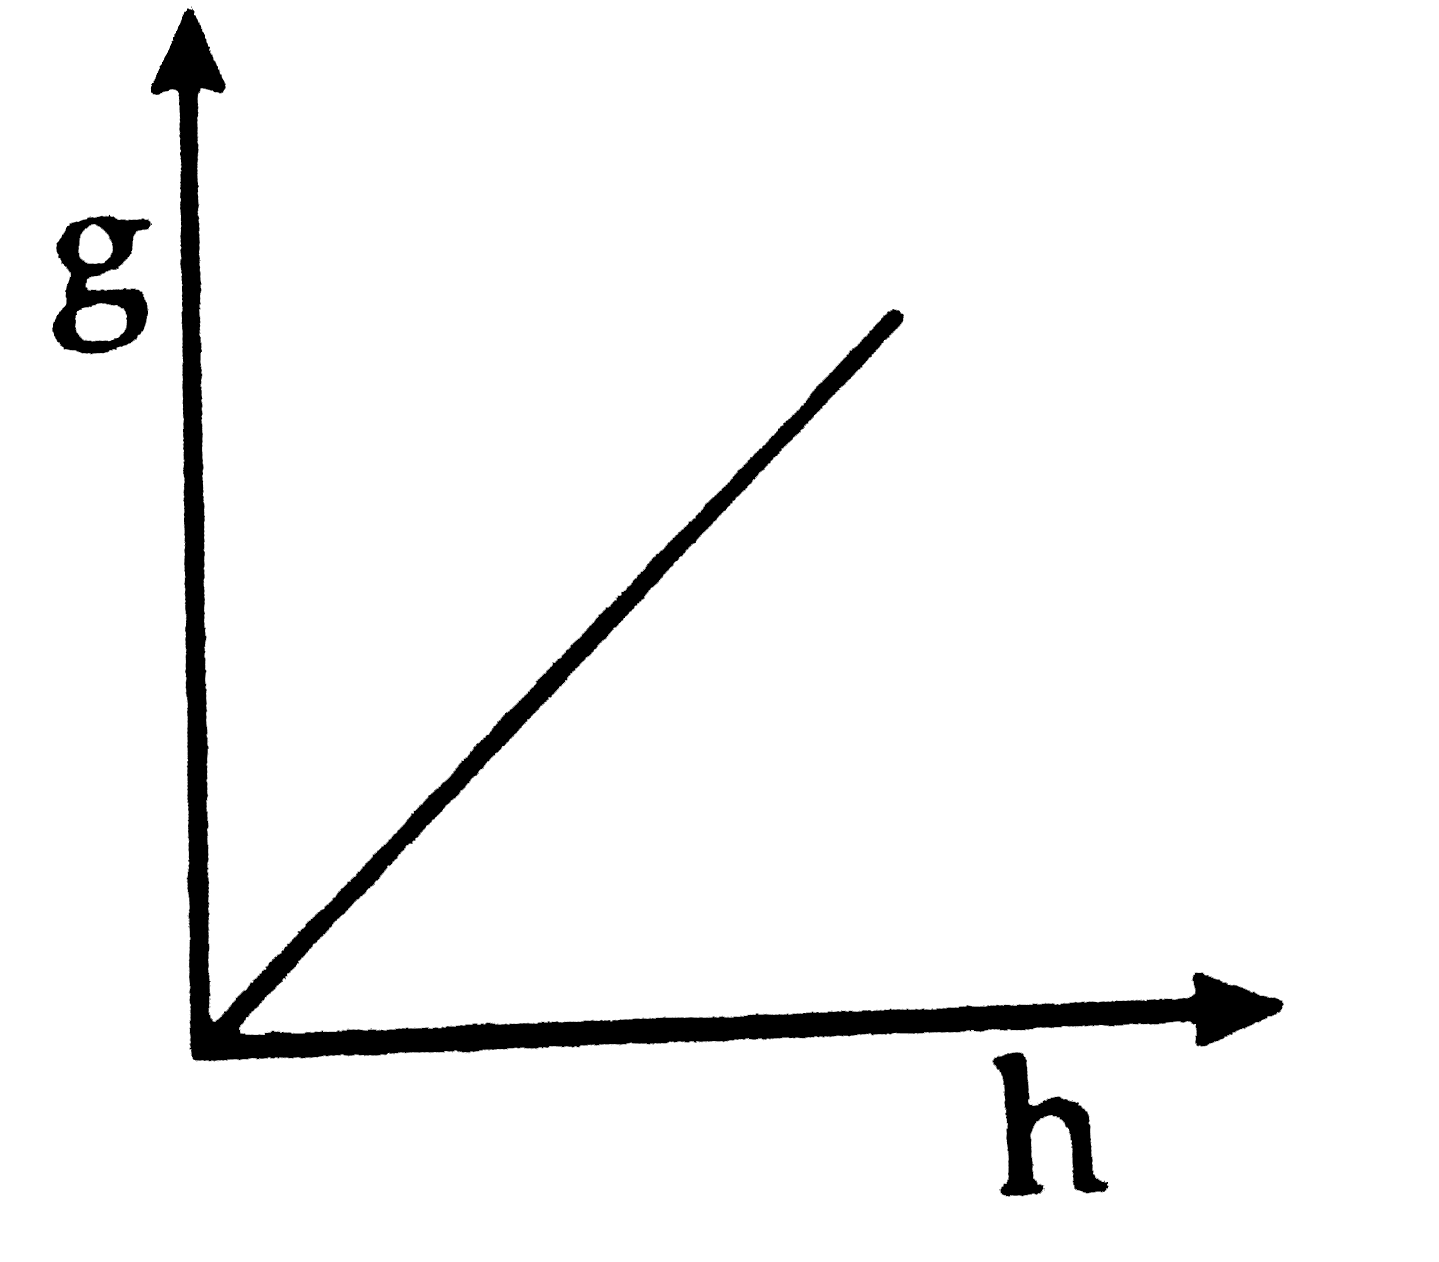 C
C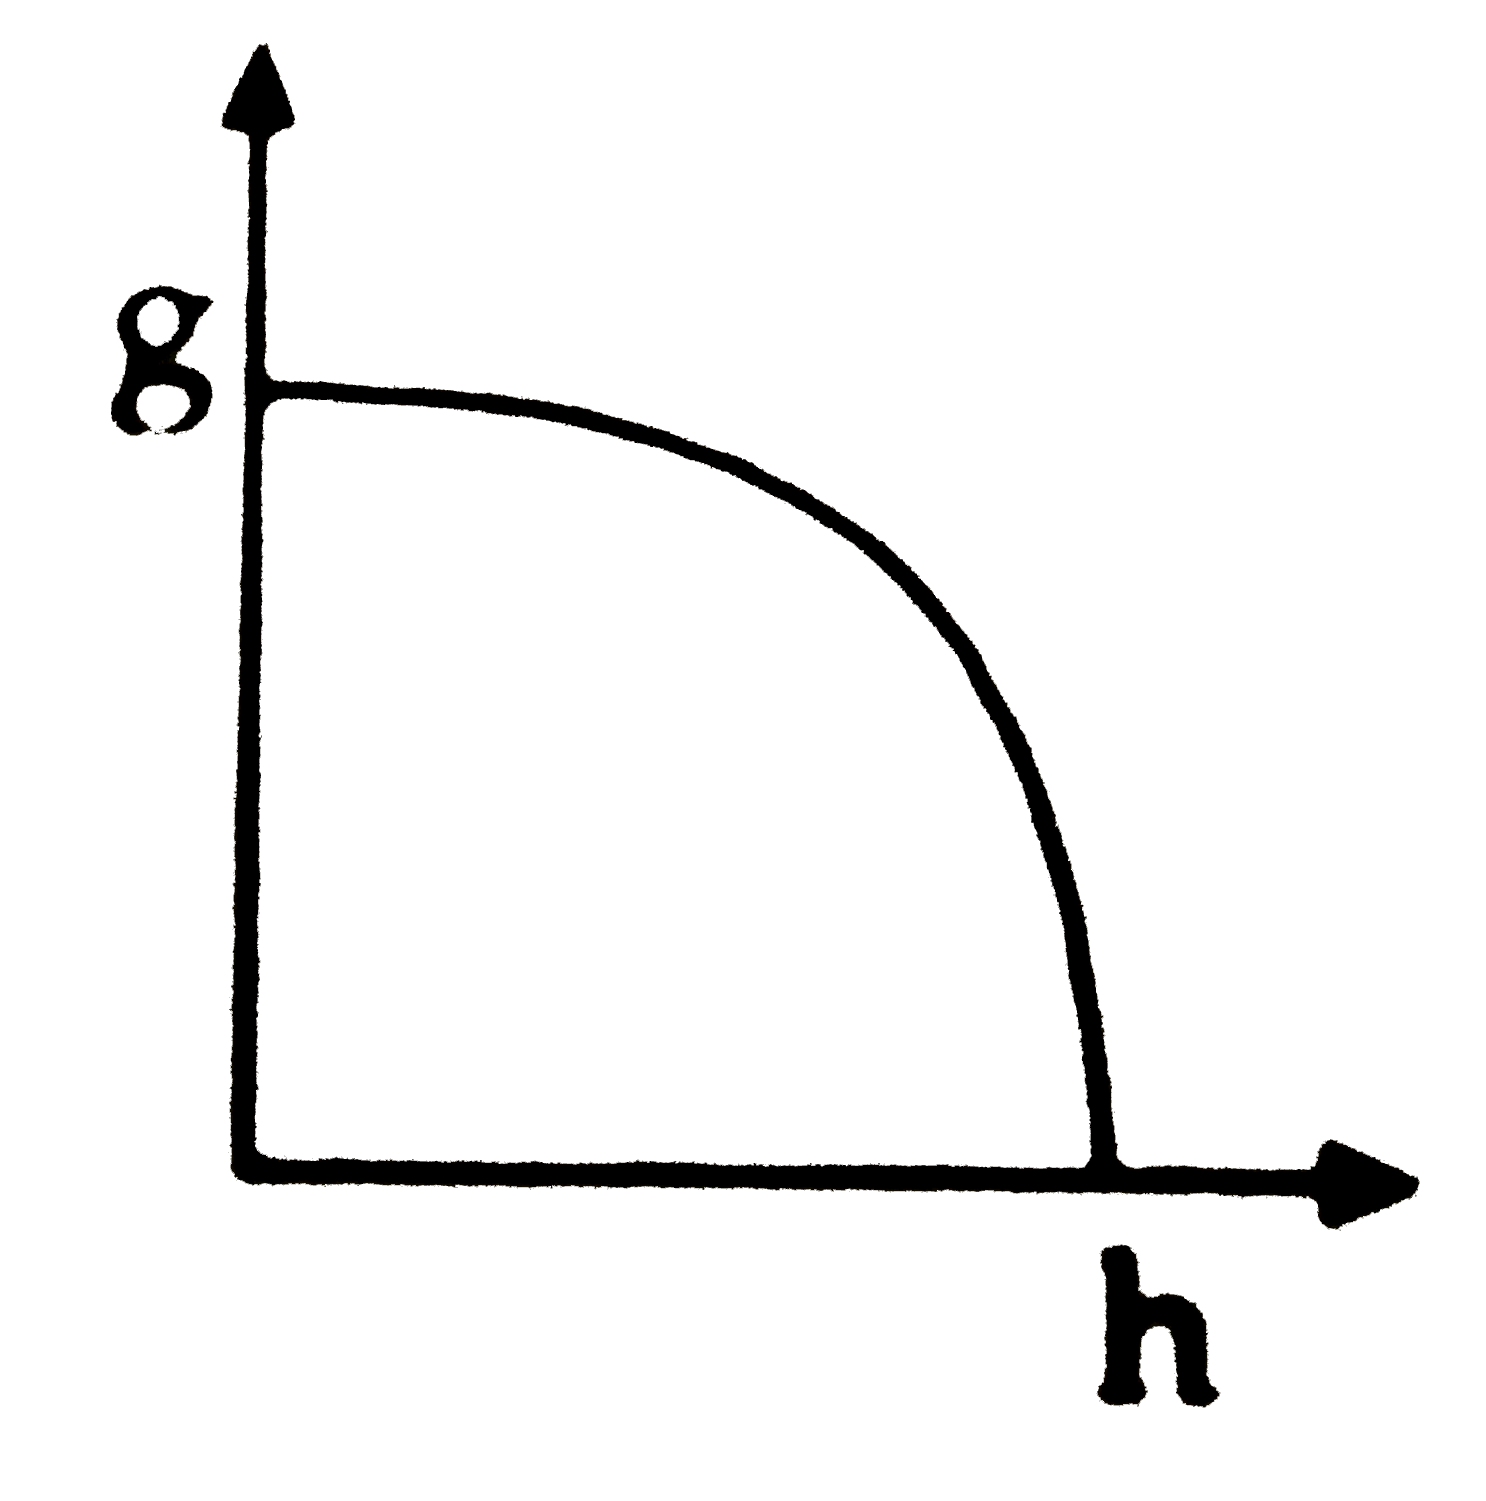 D
D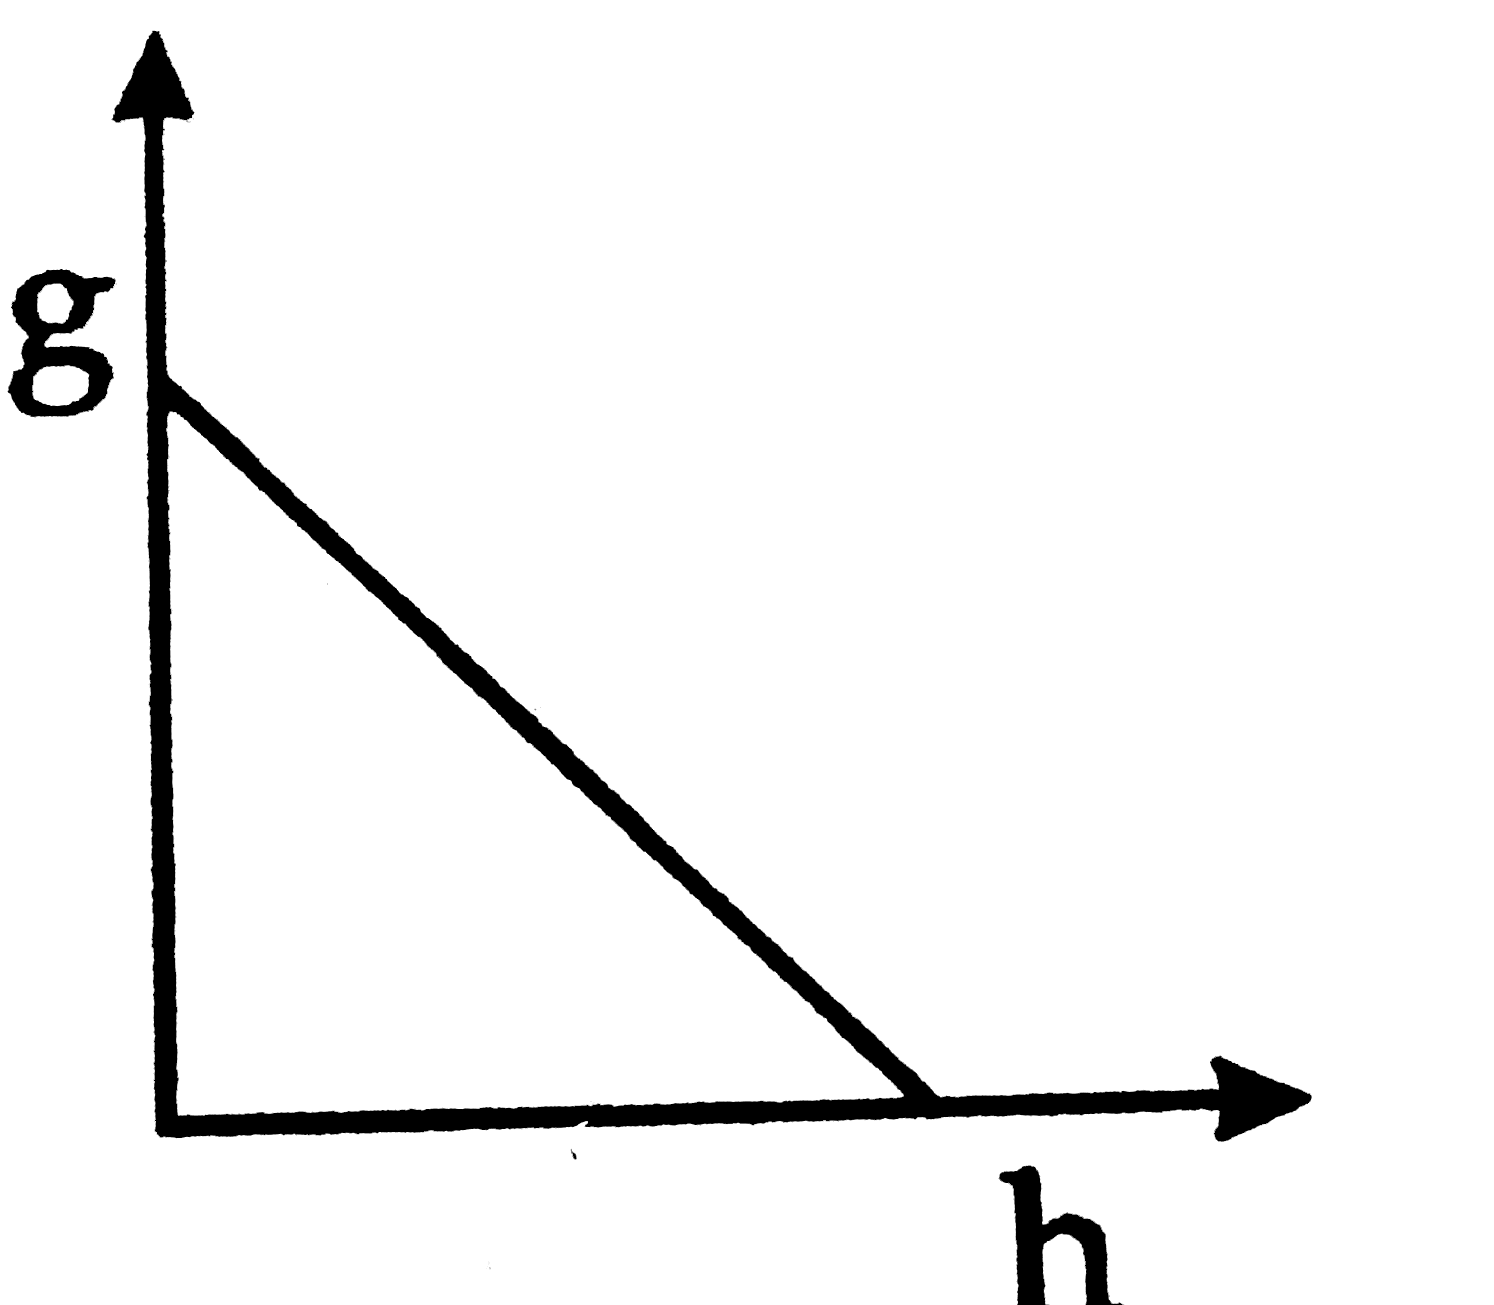
The height from the surface of earth and electron density of D layer of earth's atmosphere are
A65km,109m−3B100km,109m−3C180km,1011m−3Dnone of these
At what depth is the value of 'g' same as at a height of 40 km from the surface of earth.
View SolutionDraw graphs showing the variation of acceleration due to gravity with depth below the earth's surface.
View SolutionDraw graphs showing the variation of accleeration due to gravity with (a) height above the Earth's surface, (b) depth below the Earth's surface.
View SolutionDraw a graph showing the variation of the gravitational acceleration due to the Earth with depth and altitude.
View SolutionDraw graphs showing the variation of acceleration due to gravity with depth below the earth's surface.
View Solution
