State Stefan's law. Sketch graphs showing the distribution of energy in the spectrum of black body radiation at three temperatures, and indicate which curve corresponds to the highest temperature.
Step-by-Step Solution:
Step 1: State Stefan's Law
Stefan's Law, also known as the Stefan-Boltzmann Law, states that the total energy emitted per unit surface area of a black body across all wavelengths per unit time (also known as the power per unit area) is directly proportional to the fourth power of the black body's absolute temperature (T). Mathematically, it can be expressed as:
E=σT4
where:
- E is the total energy emitted per unit area,
- T is the absolute temperature in Kelvin,
- σ is the Stefan-Boltzmann constant, approximately 5.67×10⁻⁸W/m2K4.
Step 2: Sketch the Graphs
To illustrate the distribution of energy in the spectrum of black body radiation at three different temperatures, we will sketch three curves on a graph where the x-axis represents the wavelength (λ) and the y-axis represents the energy emitted per unit wavelength.
1. Label the Axes:
- X-axis: Wavelength (λ)
- Y-axis: Energy per unit wavelength
2. Draw the Curves:
- Curve 1: Represents the lowest temperature (T1). This curve will be the lowest on the graph.
- Curve 2: Represents a medium temperature (T2). This curve will be higher than Curve 1.
- Curve 3: Represents the highest temperature (T3). This curve will be the highest on the graph.
3. Indicate the Temperature Relationship:
- Label the curves as T1, T2, and T3 respectively.
- Indicate that T3>T2>T1 based on the height of the curves.
Step 3: Conclusion
From the graphs, it can be concluded that as the temperature of the black body increases, the total energy emitted increases, and the peak of the emission spectrum shifts towards shorter wavelengths (higher frequencies).
Stefan's Law, also known as the Stefan-Boltzmann Law, states that the total energy emitted per unit surface area of a black body across all wavelengths per unit time (also known as the power per unit area) is directly proportional to the fourth power of the black body's absolute temperature (T). Mathematically, it can be expressed as:
- E is the total energy emitted per unit area,
- T is the absolute temperature in Kelvin,
- σ is the Stefan-Boltzmann constant, approximately 5.67×10⁻⁸W/m2K4.
To illustrate the distribution of energy in the spectrum of black body radiation at three different temperatures, we will sketch three curves on a graph where the x-axis represents the wavelength (λ) and the y-axis represents the energy emitted per unit wavelength.
- X-axis: Wavelength (λ)
- Y-axis: Energy per unit wavelength
- Curve 1: Represents the lowest temperature (T1). This curve will be the lowest on the graph.
- Curve 2: Represents a medium temperature (T2). This curve will be higher than Curve 1.
- Curve 3: Represents the highest temperature (T3). This curve will be the highest on the graph.
- Label the curves as T1, T2, and T3 respectively.
- Indicate that T3>T2>T1 based on the height of the curves.
From the graphs, it can be concluded that as the temperature of the black body increases, the total energy emitted increases, and the peak of the emission spectrum shifts towards shorter wavelengths (higher frequencies).
Topper's Solved these Questions
- THERMAL RADIATION BOOK - ICSECHAPTER - THERMAL RADIATION EXERCISE - SHORT ANSWER QUESTIONS
25 Videos
- THERMAL RADIATION BOOK - ICSECHAPTER - THERMAL RADIATION EXERCISE - VERY SHORT ANSWER QUESTIONS
8 Videos
- THERMAL RADIATION BOOK - ICSECHAPTER - THERMAL RADIATION EXERCISE - CONCEPTUAL SHORT ANSWER QUESTIONS WITH ANSWERS
10 Videos
- THERMAL CONDUCTIONBOOK - ICSECHAPTER - THERMAL CONDUCTIONEXERCISE - SELECTED PROBLEMS (Taken from the Previous Years ISC, AISSCE, HSSCE various States. Boards Roorke Qns & NCERT text) FROM EXPERIMENT TO DETERMINE K
2 Videos
- UNITSBOOK - ICSECHAPTER - UNITSEXERCISE - MODULE 3 (SELECTED PROBLEMS)
38 Videos
Similar Questions
State Stefan's law and Wien's displacement law. Draw graphs showing the distribution of energy in the spectrum of a black body. Explain what quantity is plotted against the wavelength . By considering how this energy distribution varies with tempaerature expalin the colour changes which occur when a piece of iron is heated from cold to near the melting point.
View SolutionWhich of the Maxwell distribution curves (obtained at different temperatures) shown in the following figure corresponds to the highest temperature of the gas ?
View SolutionName the law which helps us to explain the distribution of energy in the spectrum of a black body for
(i) short wavelength only (ii) long wavelength only.
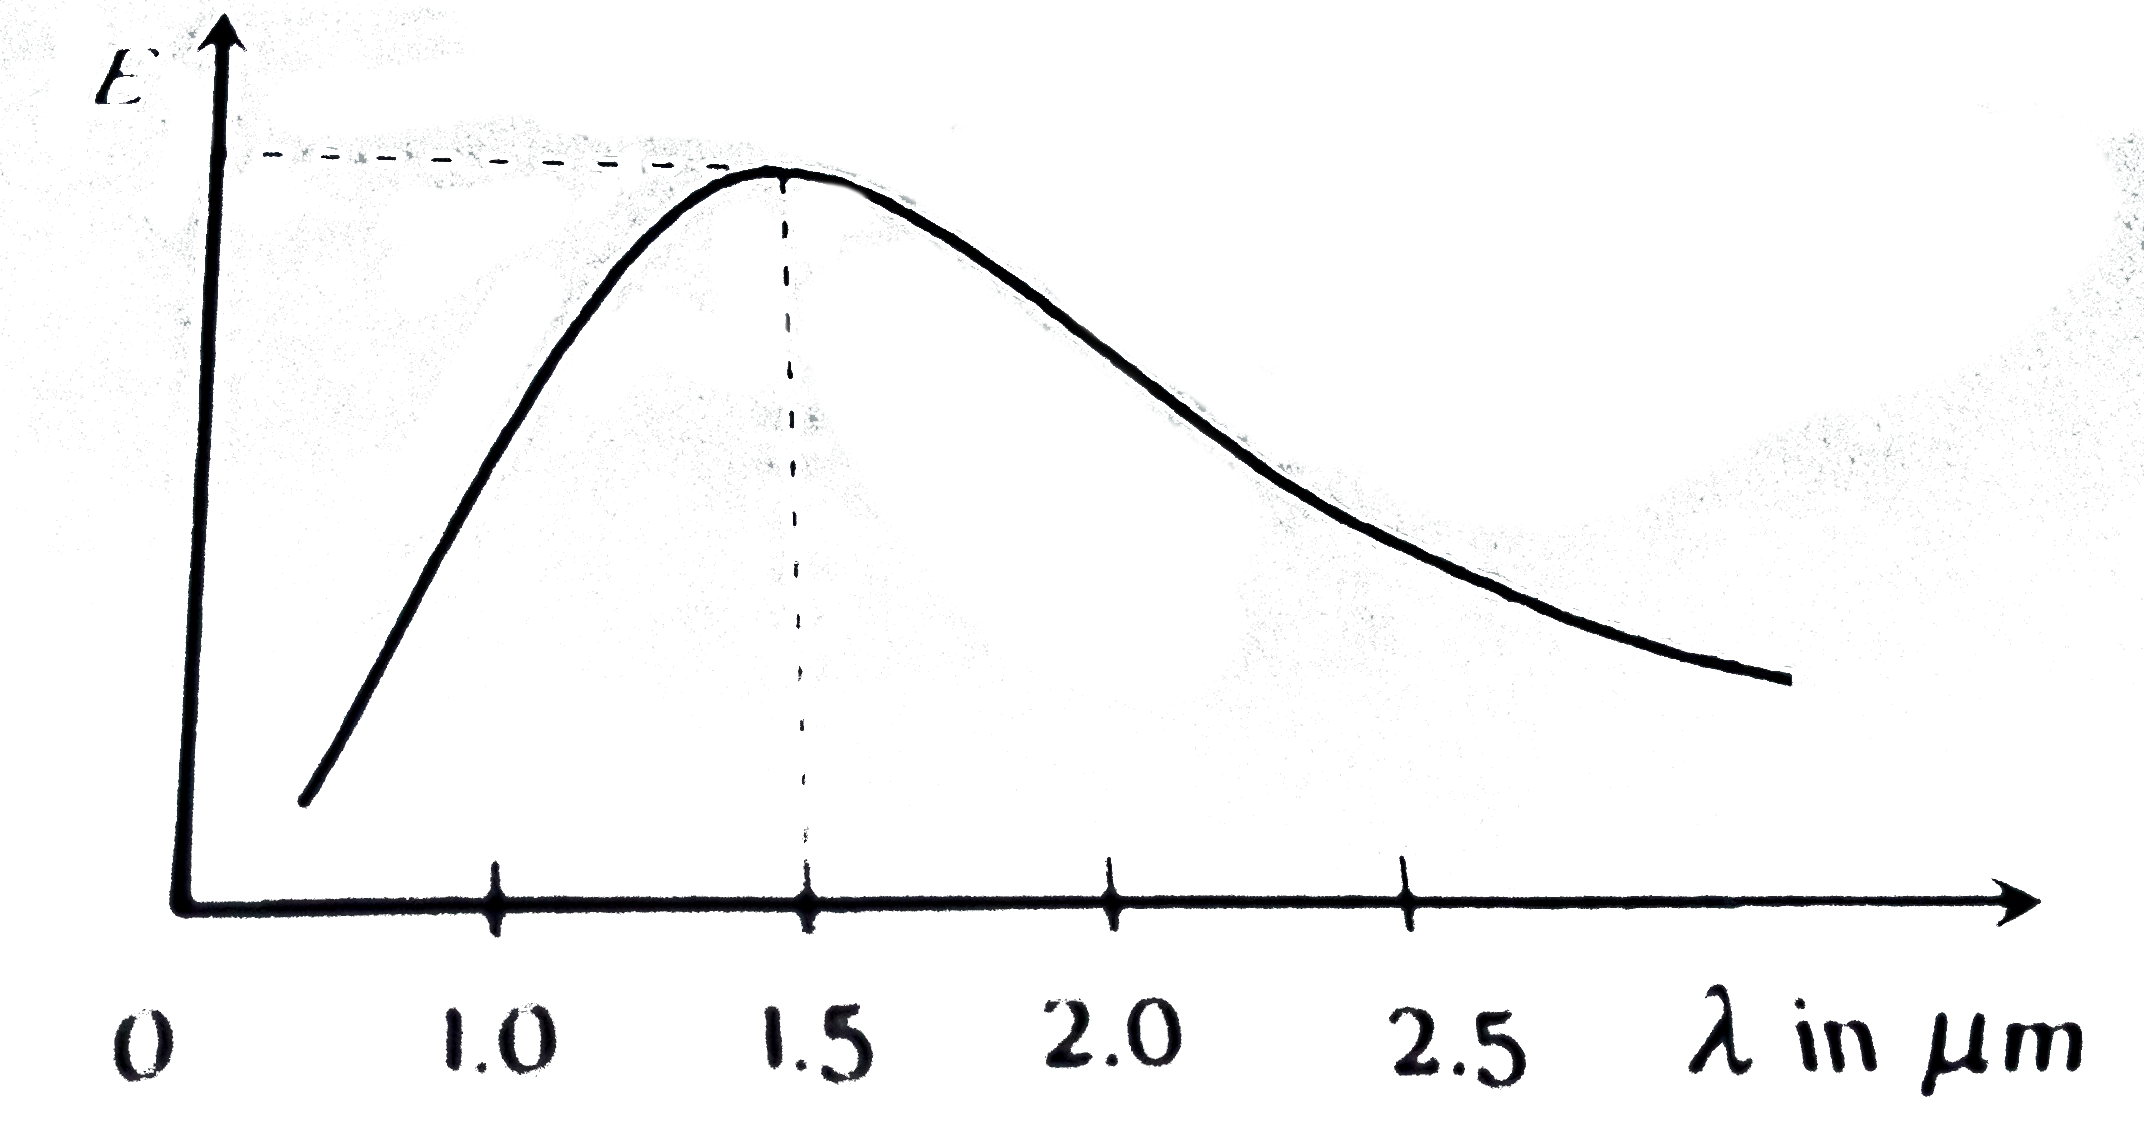
View SolutionIn the figure, the distribution of energy density of the radiation emitted by a black body at a given temperature is shown. The possible temperature of the black body is

View SolutionA black body is at temperature of 500K. It emits energy at rate which is proportional to
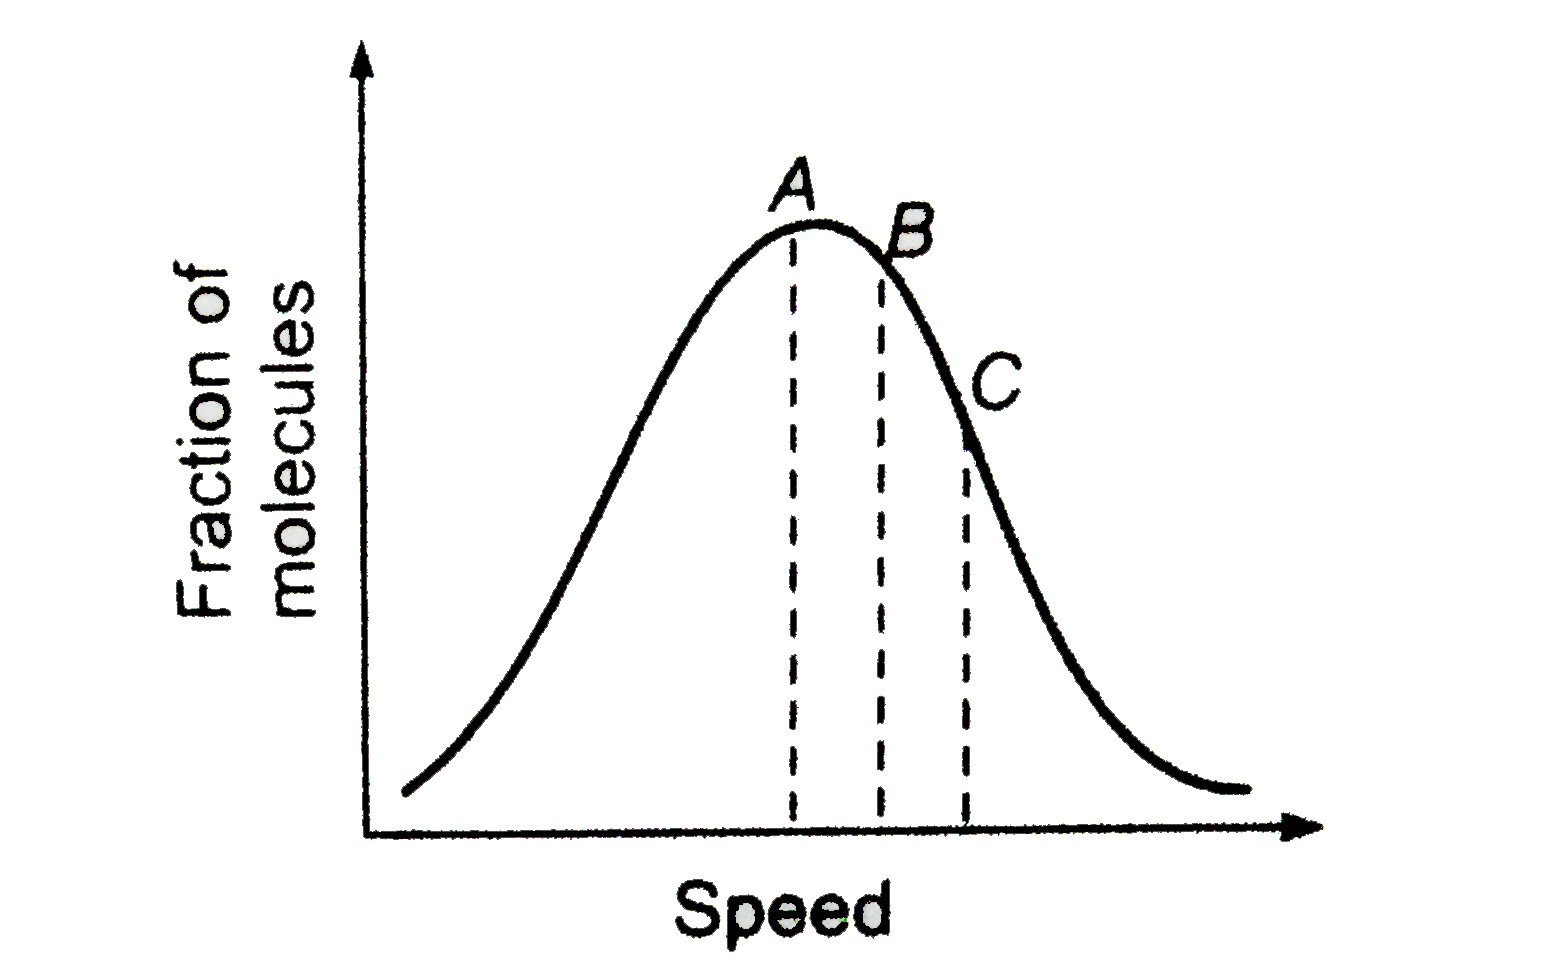
View SolutionAt a definit temperature (T), the distribution of speeds is given by the curve. In the curve points A, B and C indicates the speeds corresponding to :

View SolutionA black body is at a temperature 300K. It emits energy at a rate, which is proportional to
View SolutionIf the radius of a star is R and it acts as a black body, what would b the temperature of the star, in which the rate of energy production is Q?
View SolutionIf the radius of a star is R and it acts as a black body, what would b the temperature of the star, in which the rate of energy production is Q?
View SolutionFollowing graphs shows the variation in the intensity of heat radiations by the the black body and frequency at a fixed temperature . Choose the correct option.
View Solution
