On a phase diagram draw the fusion curve, vaporisation curve and sublimation curve. Define triple point.
To solve the question, we will follow these steps:
Step 1: Understand the Phase Diagram
A phase diagram represents the state of a substance under varying temperature and pressure conditions. It typically includes regions for solid, liquid, and gas phases, and the lines between these regions represent phase transitions.
Step 2: Draw the Axes
- Draw a vertical axis labeled "Pressure" (P).
- Draw a horizontal axis labeled "Temperature" (T).
Step 3: Identify the Regions
- The area to the left of the fusion curve represents the solid phase.
- The area between the fusion curve and the vaporization curve represents the liquid phase.
- The area above the vaporization curve represents the gas phase.
Step 4: Draw the Fusion Curve
- The fusion curve (or melting curve) separates the solid and liquid phases. It slopes upwards from left to right, indicating that increasing pressure raises the melting point of the solid.
Step 5: Draw the Vaporization Curve
- The vaporization curve (or boiling curve) separates the liquid and gas phases. It also slopes upwards from left to right, indicating that increasing pressure raises the boiling point of the liquid.
Step 6: Draw the Sublimation Curve
- The sublimation curve separates the solid and gas phases. It typically slopes downwards from left to right, indicating that decreasing pressure allows solid to transition directly to gas.
Step 7: Mark the Triple Point
- The triple point is the point where all three curves meet. It represents the specific temperature and pressure at which solid, liquid, and gas phases of a substance can coexist in thermodynamic equilibrium.
Step 8: Mark the Critical Point
- The critical point is the end of the vaporization curve, beyond which the liquid and gas phases become indistinguishable.
Final Diagram
- Your final diagram should clearly show the fusion curve, vaporization curve, sublimation curve, triple point, and critical point.
Definitions
- Fusion Curve: The line on the phase diagram that separates the solid and liquid phases.
- Vaporization Curve: The line that separates the liquid and gas phases.
- Sublimation Curve: The line that separates the solid and gas phases.
- Triple Point: The unique set of conditions (temperature and pressure) at which all three phases of a substance coexist in equilibrium.
---
A phase diagram represents the state of a substance under varying temperature and pressure conditions. It typically includes regions for solid, liquid, and gas phases, and the lines between these regions represent phase transitions.
- Draw a vertical axis labeled "Pressure" (P).
- Draw a horizontal axis labeled "Temperature" (T).
- The area to the left of the fusion curve represents the solid phase.
- The area between the fusion curve and the vaporization curve represents the liquid phase.
- The area above the vaporization curve represents the gas phase.
- The fusion curve (or melting curve) separates the solid and liquid phases. It slopes upwards from left to right, indicating that increasing pressure raises the melting point of the solid.
- The vaporization curve (or boiling curve) separates the liquid and gas phases. It also slopes upwards from left to right, indicating that increasing pressure raises the boiling point of the liquid.
- The sublimation curve separates the solid and gas phases. It typically slopes downwards from left to right, indicating that decreasing pressure allows solid to transition directly to gas.
- The triple point is the point where all three curves meet. It represents the specific temperature and pressure at which solid, liquid, and gas phases of a substance can coexist in thermodynamic equilibrium.
- The critical point is the end of the vaporization curve, beyond which the liquid and gas phases become indistinguishable.
- Your final diagram should clearly show the fusion curve, vaporization curve, sublimation curve, triple point, and critical point.
- Fusion Curve: The line on the phase diagram that separates the solid and liquid phases.
- Vaporization Curve: The line that separates the liquid and gas phases.
- Sublimation Curve: The line that separates the solid and gas phases.
- Triple Point: The unique set of conditions (temperature and pressure) at which all three phases of a substance coexist in equilibrium.
Topper's Solved these Questions
- INTERNAL ENERGY BOOK - ICSECHAPTER - INTERNAL ENERGY EXERCISE - VERY SHORT ANSWER QUESTIONS
17 Videos
- INTERNAL ENERGY BOOK - ICSECHAPTER - INTERNAL ENERGY EXERCISE - SELECTED PROBLEMS (FROM FIRST LAW OF THERMODYNAMICS )
6 Videos
- INTERNAL ENERGY BOOK - ICSECHAPTER - INTERNAL ENERGY EXERCISE - LONG ANSWER QUESTIONS
8 Videos
- GRAVITATIONBOOK - ICSECHAPTER - GRAVITATIONEXERCISE - FROM THE HUBBLE TELESCOP
2 Videos
- MOTION IN FLUIDS BOOK - ICSECHAPTER - MOTION IN FLUIDS EXERCISE - SELECTED PROBLEMS (FROM POISEUILLE.S FORMULA)
19 Videos
Similar Questions
Draw the curve y=ex
View Solution
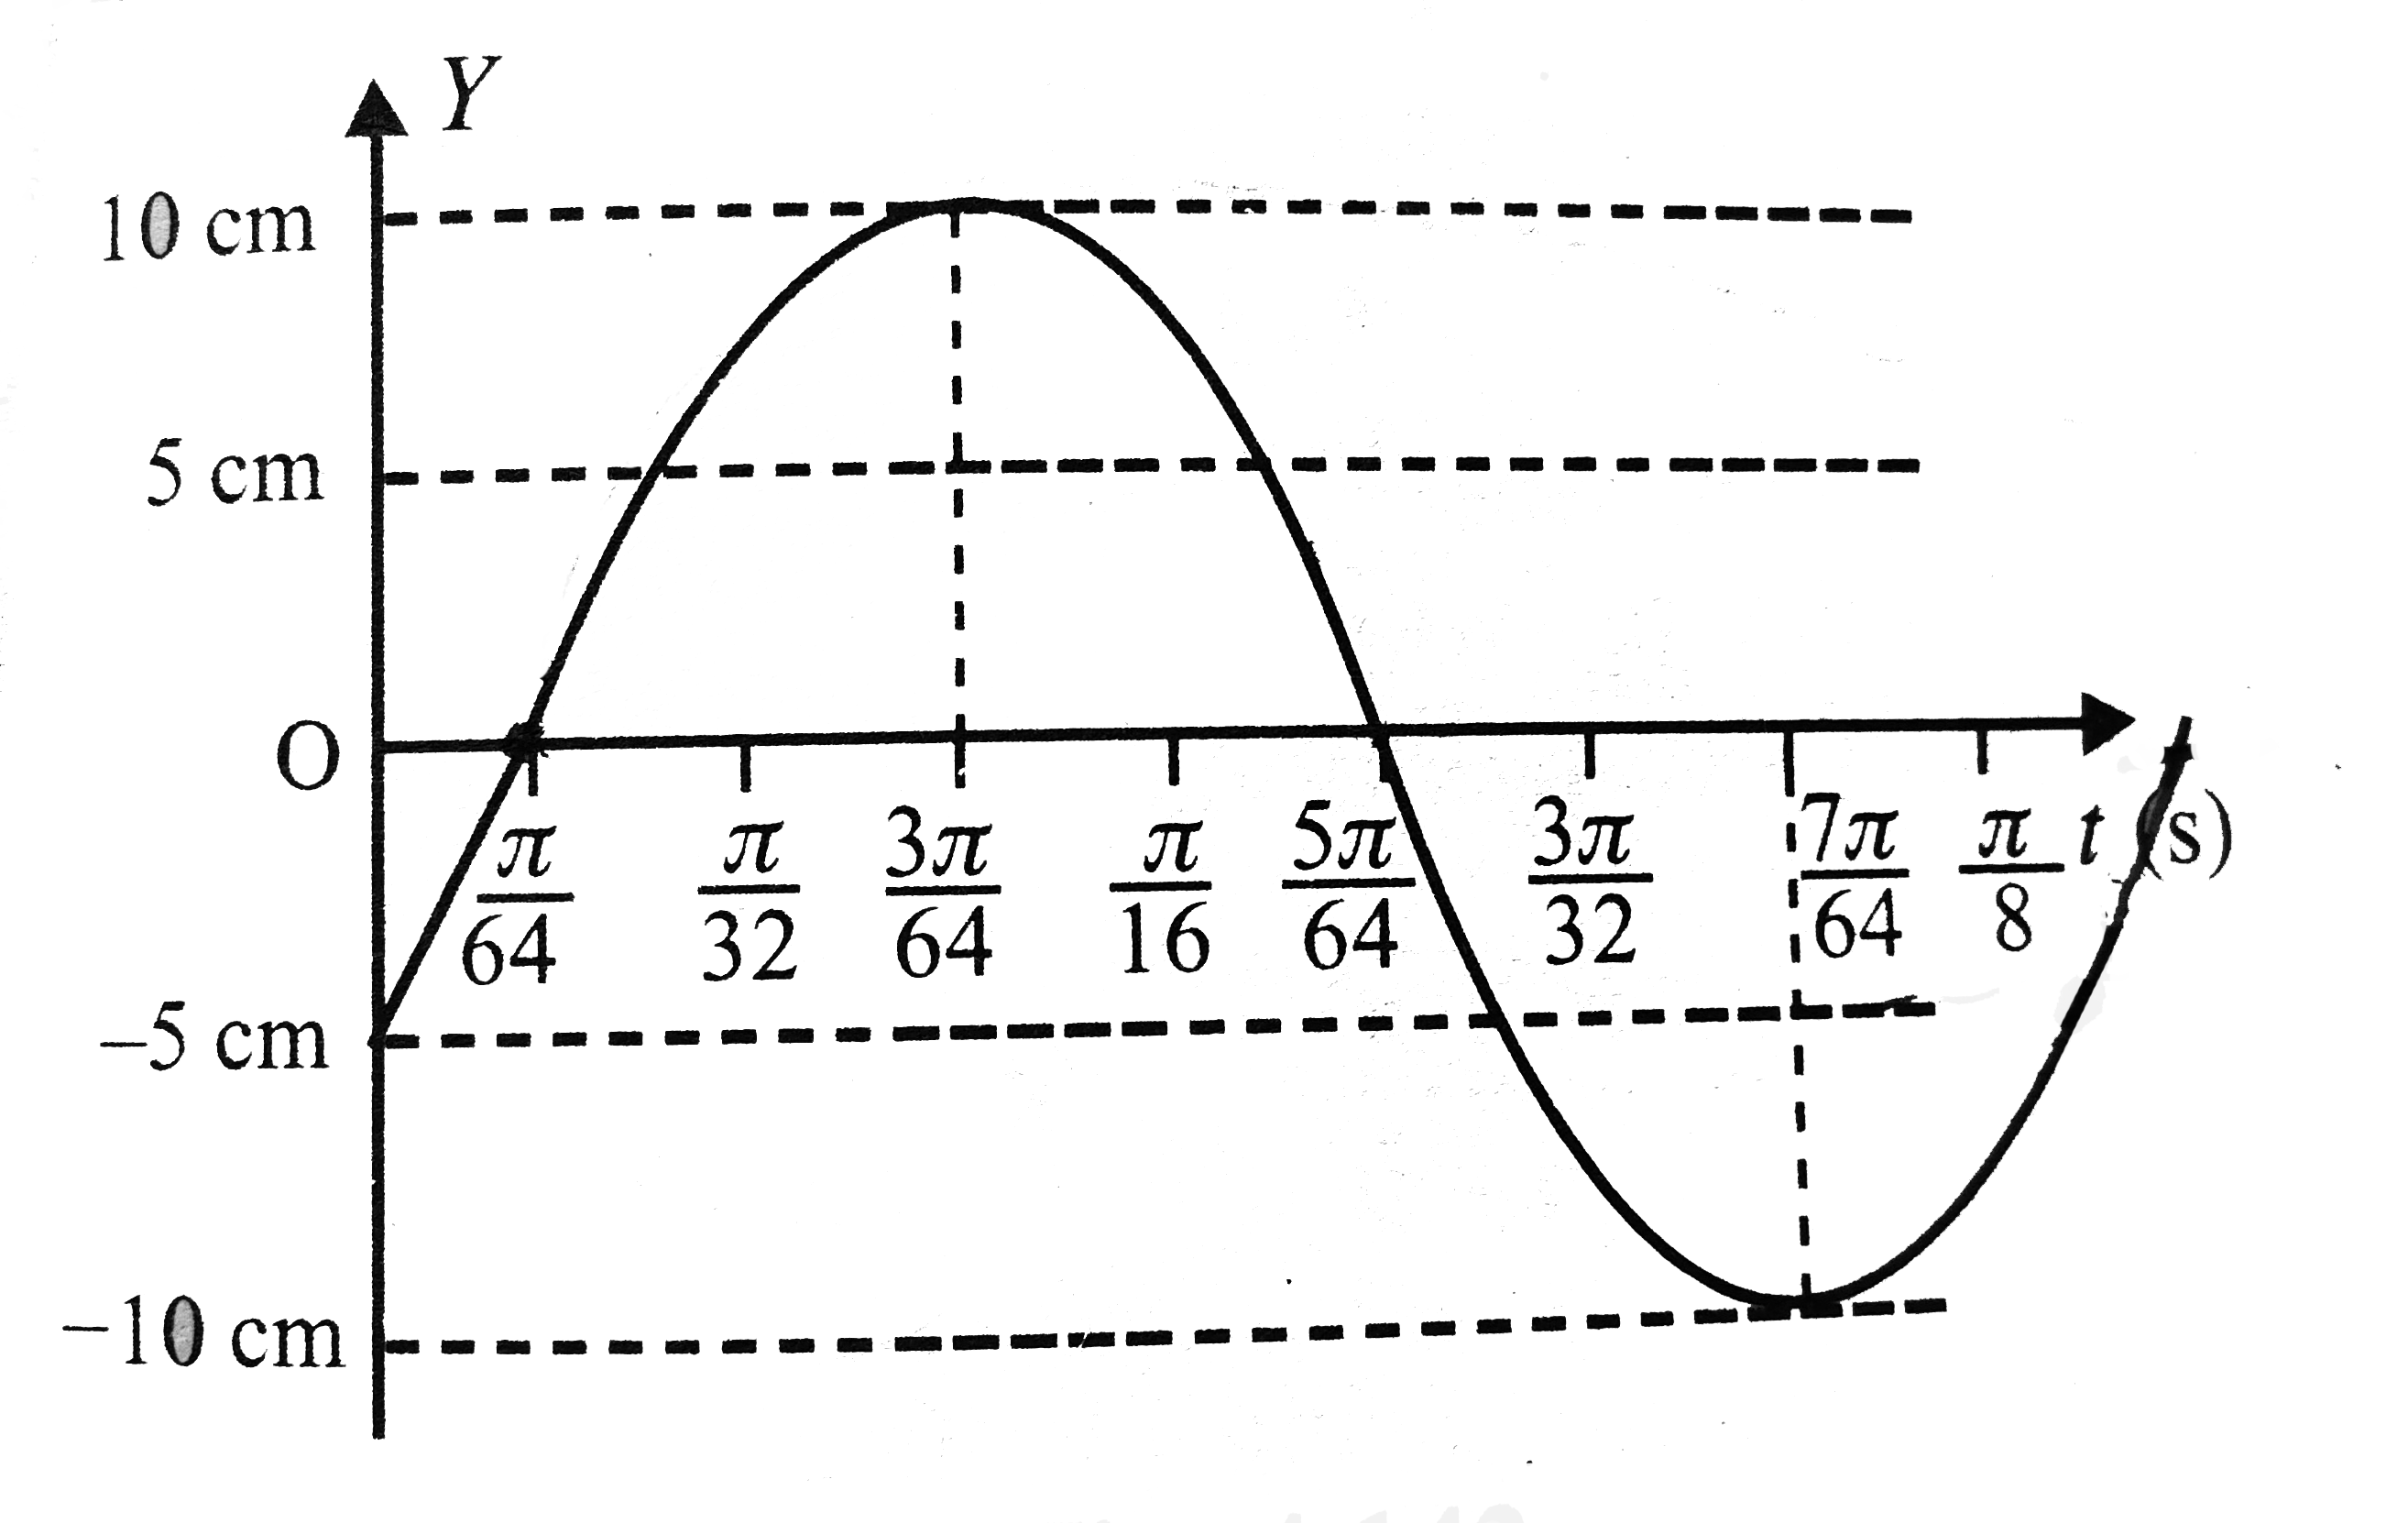
The diagram below shows a sinusoidal curve. The equation of the curve will be
View SolutionDraw at P-T curve for isobaric process.
View SolutionDraw at P-T curve for isobaric process.
View SolutionDraw rough diagrams to illustrate the following :(a) Open curve (b) Closed curve.
View SolutionDraw at P-T curve for isochoric process.
View SolutionDraw at P-T curve for isochoric process.
View SolutionDraw rough diagrams to illustrate the following: (i) Open curve (ii) Closed curve
View SolutionDraw the vapour pressure curve explaining depression in freezing point.
View SolutionFastest phase of S-shaped growth curve is
View Solution
