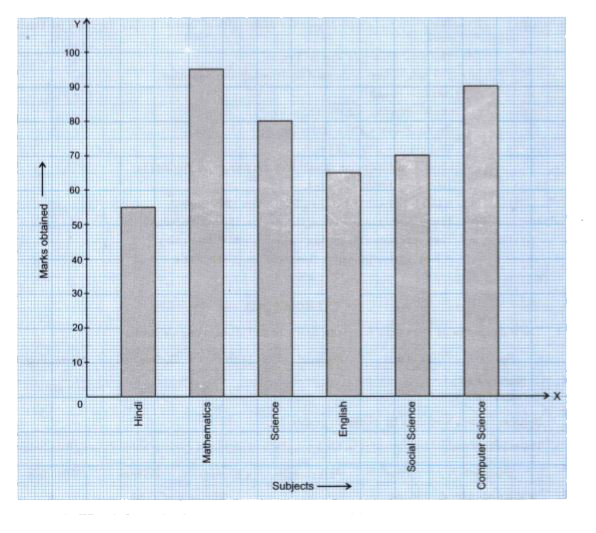
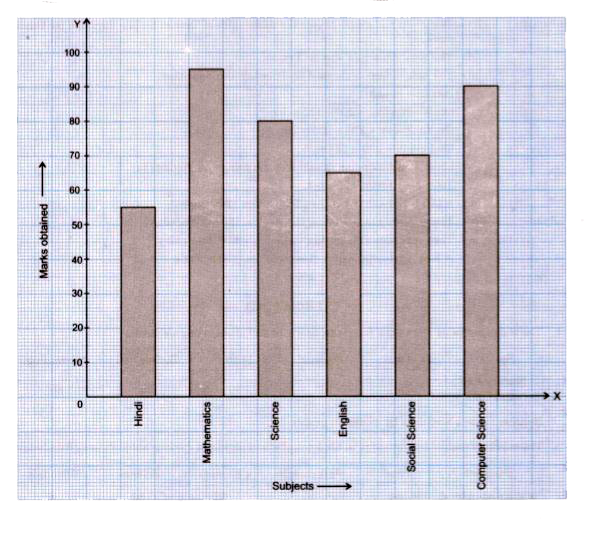
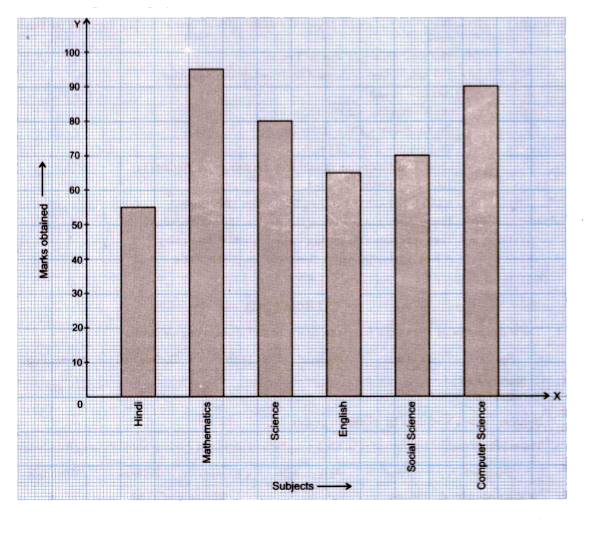
Read the given bar graph and answer the question that follow :
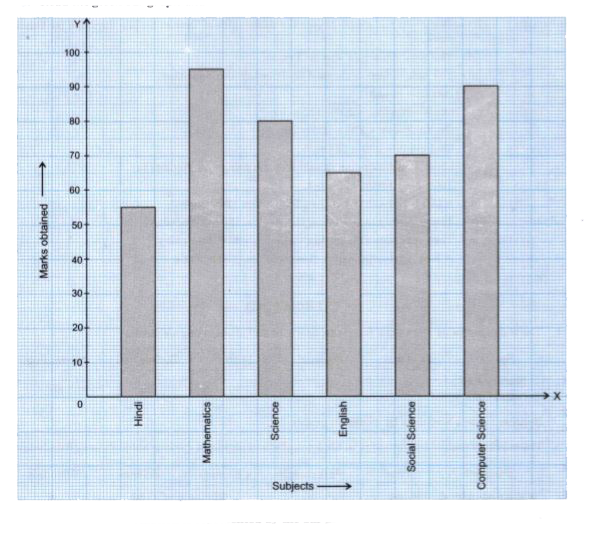
How many marks were obtained in English?
55
95
65
70
The correct Answer is:C
Step by step video solution for Read the given bar graph and answer the question that follow : How many marks were obtained in English? by Maths experts to help you in doubts & scoring excellent marks in Class 7 exams.
Updated on:21/07/2023Topper's Solved these Questions
Similar Questions
Knowledge Check
Study the diagram given below and answer the questions that follow:
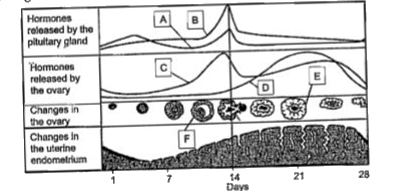
The structure marked 'E' is ______ACorpus luteumBSecondary follicleCGraafian follicleDCorpus albicans
Read the given bar graph and answer the question that follow :
What information is represented by the bar graph?
View SolutionRead the bar graph (Fig 3.4) and answer the questions that follow:Number of books sold by a bookstore during five consecutive years.(i) About how many books were sold in 1989? 1990? 1992?(ii) In which year were about 475 books sold? About 225 books sold?(iii) In which years were fewer than 250 books sold?(iv) Can you explain how you would estimate the number of books sold in 1989?
View SolutionRead the bar graph and answer the following questions.
What information is given by the bar graph?
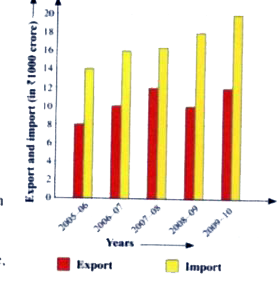
View SolutionRead the following bar graph and answer the following questions: What information is given by the bar graph? In which year the export is minimum ? In which year the import is maximum ? In which year the difference of the values of export and import is maximum?
View SolutionRead the following bar graph and answer the following questions: What information is given by the bar graph? Which state is the largest producer of rice? Which state is the largest producer of wheat? Which state has total production of rice and wheat as its maximum? Which state has the total production of wheat and rice minimum?
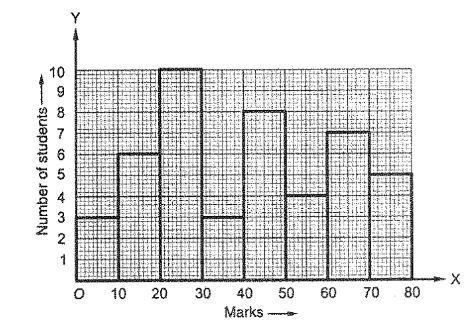
View SolutionThe following histogram depicts the marks obtained by 45 students of a class: Figure: Look at the histogram and answer the following questions: What is the class size? How many students obtained less than 10 marks? How many students obtained 30 or more marks but less than 40? What is the interval of highest marks and how many students are there in this interval? If passing marks are 30, what is the number of failures?
View SolutionRead the following bar graph (Figure) and answer the following questions: What information is given by the bar graph? What was the production of cement in the year 1980-81? What is the minimum and maximum productions of cement and corresponding years?
View Solution

