The birth-rate per thousand of five countries over a period of time is shown below :
CountryChinaIndiaGermanyU.K.SwedenBirth-rate per4235142821thousand
Represent the above data by a bar graph.
To represent the birth-rate per thousand of the five countries using a bar graph, we will follow these steps:
1. List the Data:
- Countries: China, India, Germany, U.K., Sweden
- Birth Rates: 42, 35, 14, 28, 21
2. Set Up the Axes:
- Draw two perpendicular lines to form the axes of the graph.
- The horizontal axis (x-axis) will represent the countries.
- The vertical axis (y-axis) will represent the birth rate per thousand.
3. Label the Axes:
- Label the x-axis with the names of the countries: China, India, Germany, U.K., Sweden.
- Label the y-axis with appropriate intervals. For this data, we can use intervals of 5, ranging from 0 to 45.
4. Plot the Data:
- For each country, draw a bar that corresponds to its birth rate:
- China: Draw a bar up to 42.
- India: Draw a bar up to 35.
- Germany: Draw a bar up to 14.
- U.K.: Draw a bar up to 28.
- Sweden: Draw a bar up to 21.
5. Draw the Bars:
- Ensure that the bars are of equal width and are spaced evenly apart.
- The height of each bar should accurately reflect the birth rate for each country.
6. Title the Graph:
- Give the graph a suitable title, such as "Birth Rate per Thousand in Different Countries".
- Countries: China, India, Germany, U.K., Sweden
- Birth Rates: 42, 35, 14, 28, 21
- Draw two perpendicular lines to form the axes of the graph.
- The horizontal axis (x-axis) will represent the countries.
- The vertical axis (y-axis) will represent the birth rate per thousand.
- Label the x-axis with the names of the countries: China, India, Germany, U.K., Sweden.
- Label the y-axis with appropriate intervals. For this data, we can use intervals of 5, ranging from 0 to 45.
- For each country, draw a bar that corresponds to its birth rate:
- China: Draw a bar up to 42.
- India: Draw a bar up to 35.
- Germany: Draw a bar up to 14.
- U.K.: Draw a bar up to 28.
- Sweden: Draw a bar up to 21.
- Ensure that the bars are of equal width and are spaced evenly apart.
- The height of each bar should accurately reflect the birth rate for each country.
- Give the graph a suitable title, such as "Birth Rate per Thousand in Different Countries".
Topper's Solved these Questions
Similar Questions
The following data shows the average age of men in varicus countries in a certain year: Country, India, Nepal, China, Pakistan, U.K., U.S.A Average age (in years), 55, 52, 60, 50, 70, 75 Represent the above information by a bar graph.
View SolutionThe following data shows the average age of men in varicus countries in a certain year: Country, India, Nepal, China, Pakistan, U.K., U.S.A Average age (in years), 55, 52, 60, 50, 70, 75 Represent the above information by a bar graph.
View Solution
Knowledge Check
Governments looking for easy popularity have frequently been tempted into announcing give aways of all sorts, free electricity, virtually free water, subsidised food, cloth at half price, and so on. The subsidy culture has gone to extremes. The richest farmers in the country get subsidised fertiliser. University education, typically accessed by the wealtier sections, is charged at a fraction of cost. Postal services are subsidised, and so are railway services. Bus fares cannot be raised to economical levels because there will be violent protests, so bus travel is subsidised too. In the past, price control on a variety of items, from steel to cement, meant that industrial consumers of these items got them at less than actual cost, while the losses of the public sector companies that produced them were borne by the taxpayer! A study, done a few years ago, came to the conclusion that subsidies in the Indian economy total as much as 14.5 per cent of gross domestic product. At today's level, that would work out to about Rs. 1,50,000 crore.
And who pays the bill? The theory - and the political fiction on the basis of which it is sold to unsuspecting voters – is that subsidies go to the poor, and are paid for by the rich. The fact is that most subsidies go to the 'rich' (defined in the Indian context as those who are above the poverty line), and much of the tab goes indirectly to the poor. Because the hefty subsidy bill results in fiscal deficits, which in turn push up rates of inflation – which, as everyone knows, hits the poor the hardest of all, Indeed, that is why taxmen call inflation the most regressive form of taxation. The entire subsidy system is built on the thesis that people cannot help themselves, therefore governments must do so. That people cannot afford to pay for a variety of goods and services, and therefore the government must step in. This thesis has been applied not just in the poor countries but in the rich ones as well, hence the birth of the welfare state in the West, and an almost Utopian social security system, free medical care, food aid, old age security, et al. But with the passage of time, most of the wealthy nations have discovered that their economies cannot sustain this social safety net, which infact reduces the desire among people to pay their own way, and takes away some of the incentive to work. In short, the bill was unaffordable, and their societies were simply not willing to pay. To the regret of many, but because of the laws of economics are harsh, most Western societies have been busy pruning the welfare bill.
In India, the lessons of this experience – over several decades, and in many countries - do not seem to have been learnt. Or, they are simply ignored in the pursuit of immediate votes. People who are promised cheap food or clothing do not in most cases look beyond the gift horses - to the question of who picks up the tab. The uproar over higher petrol, diesel and cooking gas prices ignored this basic question: if the user of cooking gas does not want to pay for its cost, who should pay? Diesel in the country is subsidised, and if the trucker or owner of a diesel generator does not want to pay for its full cost, who does he or she think should pay the balance of the cost? It is a simple question, nevertheless it remains unasked. The Deve Gowda government displayed some courage in biting the bullet when it comes to the price of petroleum products. But it was bitten by a much bigger subsidy bug. It wanted to offer food at half its cost to everyone below the poverty line, supposedly estimated at some 380 million people. What will be the cost? And, of course, who will pick up the tab? The Andhra Pradesh Government was bankrupted by selling rice at Rs. 2 per kg. Should the Central Government be bankrupted too, before facing up to the question of what is affordable and what is not? Already, India is perenially short of power because the subsidy on electricity has bankrupted most electricity boards, and made private investment wary unless it gets all manner of state guarantees.
Delhi's subsidised bus fares have bankrupted the Delhi Transport Corporation, whose buses have slowly disappeared from the capital's streets. It is easy to be soft and sentimental, by looking at programmes that will be popular. After all, who doesn't like a free lunch? But the evidence is surely mounting that the lunch isn't free at all. Somebody is paying the bill. And if you want to know who, take a look at the country's poor economic performance over the years.
For each word given below choose the correct meaning (as used in the passage) from the options provided:
pursuitAquestBsurrenderCretreatDavocationGovernments looking for easy popularity have frequently been tempted into announcing give aways of all sorts, free electricity, virtually free water, subsidised food, cloth at half price, and so on. The subsidy culture has gone to extremes. The richest farmers in the country get subsidised fertiliser. University education, typically accessed by the wealtier sections, is charged at a fraction of cost. Postal services are subsidised, and so are railway services. Bus fares cannot be raised to economical levels because there will be violent protests, so bus travel is subsidised too. In the past, price control on a variety of items, from steel to cement, meant that industrial consumers of these items got them at less than actual cost, while the losses of the public sector companies that produced them were borne by the taxpayer! A study, done a few years ago, came to the conclusion that subsidies in the Indian economy total as much as 14.5 per cent of gross domestic product. At today's level, that would work out to about Rs. 1,50,000 crore.
And who pays the bill? The theory - and the political fiction on the basis of which it is sold to unsuspecting voters – is that subsidies go to the poor, and are paid for by the rich. The fact is that most subsidies go to the 'rich' (defined in the Indian context as those who are above the poverty line), and much of the tab goes indirectly to the poor. Because the hefty subsidy bill results in fiscal deficits, which in turn push up rates of inflation – which, as everyone knows, hits the poor the hardest of all, Indeed, that is why taxmen call inflation the most regressive form of taxation. The entire subsidy system is built on the thesis that people cannot help themselves, therefore governments must do so. That people cannot afford to pay for a variety of goods and services, and therefore the government must step in. This thesis has been applied not just in the poor countries but in the rich ones as well, hence the birth of the welfare state in the West, and an almost Utopian social security system, free medical care, food aid, old age security, et al. But with the passage of time, most of the wealthy nations have discovered that their economies cannot sustain this social safety net, which infact reduces the desire among people to pay their own way, and takes away some of the incentive to work. In short, the bill was unaffordable, and their societies were simply not willing to pay. To the regret of many, but because of the laws of economics are harsh, most Western societies have been busy pruning the welfare bill.
In India, the lessons of this experience – over several decades, and in many countries - do not seem to have been learnt. Or, they are simply ignored in the pursuit of immediate votes. People who are promised cheap food or clothing do not in most cases look beyond the gift horses - to the question of who picks up the tab. The uproar over higher petrol, diesel and cooking gas prices ignored this basic question: if the user of cooking gas does not want to pay for its cost, who should pay? Diesel in the country is subsidised, and if the trucker or owner of a diesel generator does not want to pay for its full cost, who does he or she think should pay the balance of the cost? It is a simple question, nevertheless it remains unasked. The Deve Gowda government displayed some courage in biting the bullet when it comes to the price of petroleum products. But it was bitten by a much bigger subsidy bug. It wanted to offer food at half its cost to everyone below the poverty line, supposedly estimated at some 380 million people. What will be the cost? And, of course, who will pick up the tab? The Andhra Pradesh Government was bankrupted by selling rice at Rs. 2 per kg. Should the Central Government be bankrupted too, before facing up to the question of what is affordable and what is not? Already, India is perenially short of power because the subsidy on electricity has bankrupted most electricity boards, and made private investment wary unless it gets all manner of state guarantees.
Delhi's subsidised bus fares have bankrupted the Delhi Transport Corporation, whose buses have slowly disappeared from the capital's streets. It is easy to be soft and sentimental, by looking at programmes that will be popular. After all, who doesn't like a free lunch? But the evidence is surely mounting that the lunch isn't free at all. Somebody is paying the bill. And if you want to know who, take a look at the country's poor economic performance over the years.
Why do you think that the author calls the Western social security system Utopian?AThe countries' belief in the efficacy of the system was bound to turn out to be false.BThe system followed by these countries is the best available in the present context.CEvery thing under this system was supposed to be free but people were charging money for them.DThe theory of system followed by these countries was devised by Dr Utopia.
The following data shows the average age of men in various countries in a certain year: Country India Nepal China Pakistan U.K. U.S.A. Average age (in years) 55 52 60 50 70 75 Represent the above information by a bar graph.
View SolutionThe production of saleable steel in some of the steel plants of our country during 1999 is given below: Plant, Bhilai, Durgapur, Rourkela, Bokaro Production (In thousand tonnes), 160, 80, 200, 150 Construct a bar graph to represent the above data on a graph paper by using the scale 1 big divisions = 20 thousand tonnes.
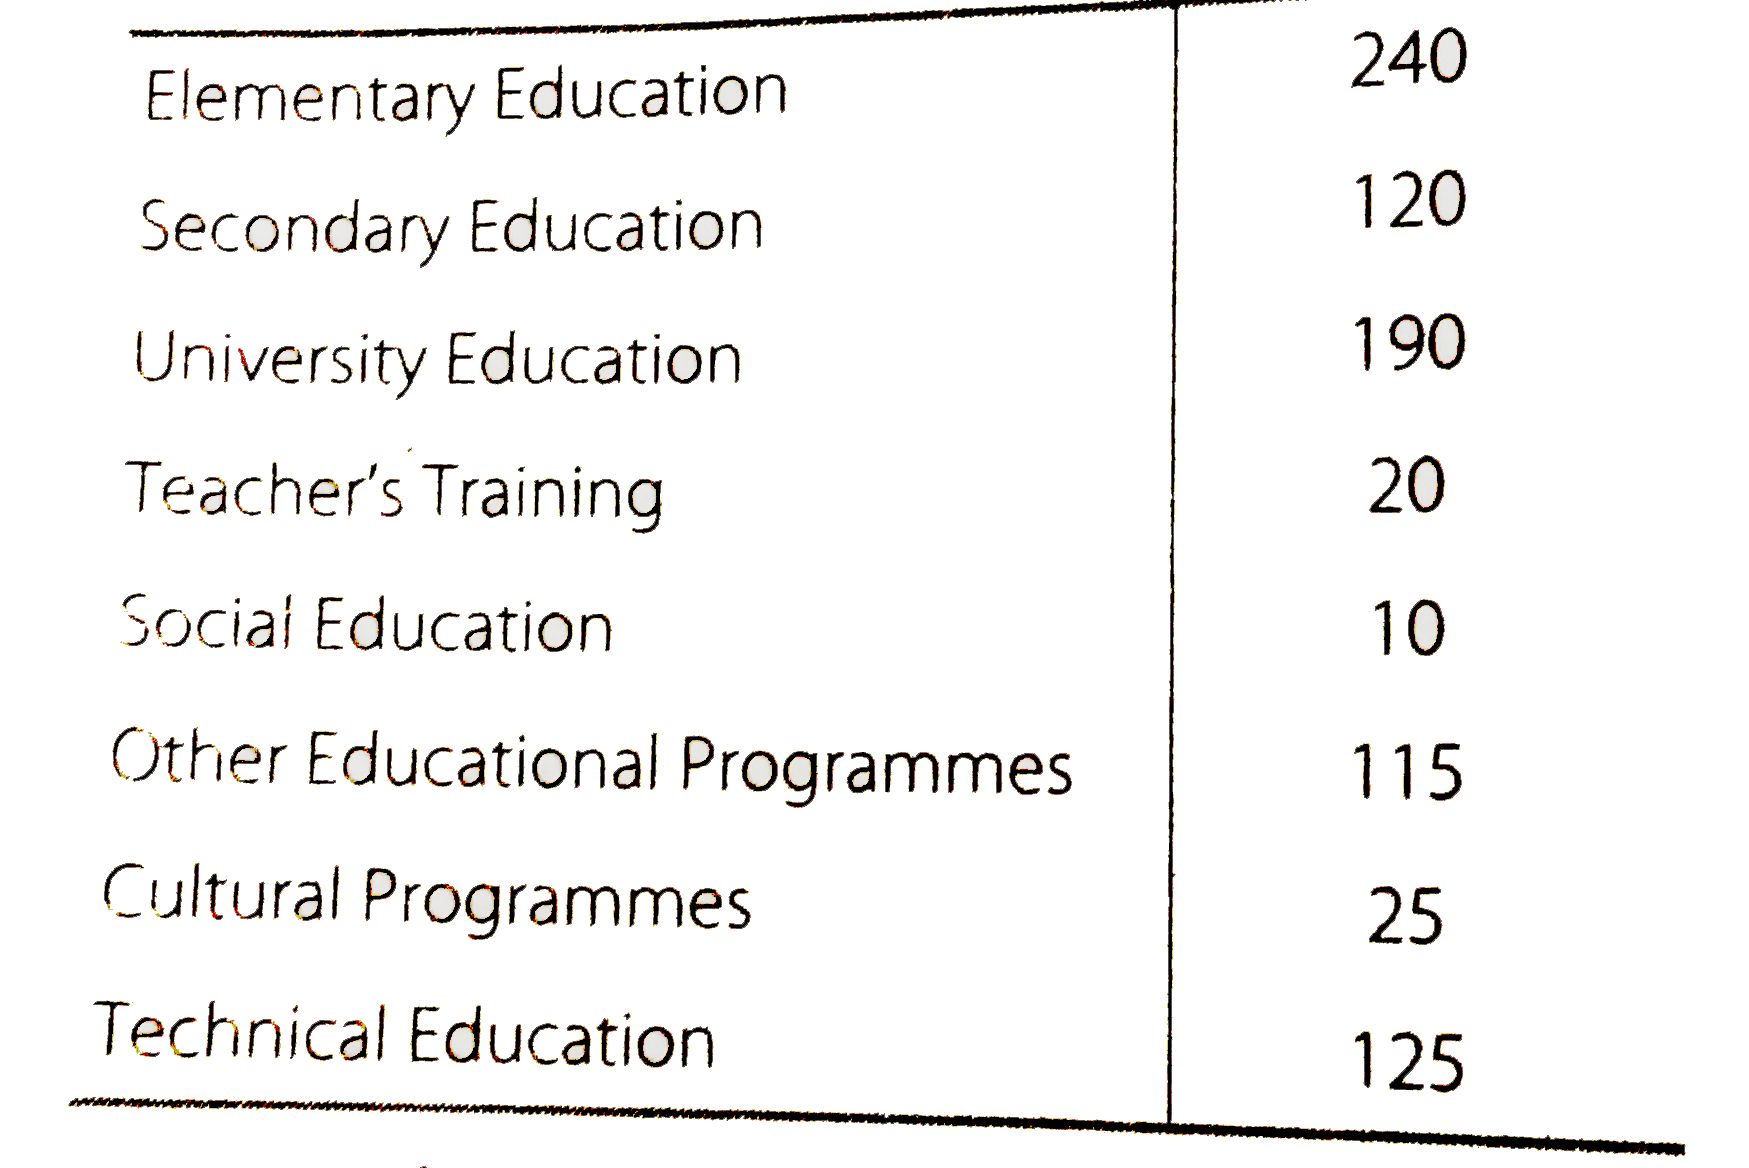
View SolutionExpenditure on education of a country during a five years period (2002-2006), in crore of rupees, is given below

Represent the information above by a bar graph.
View SolutionThe expenditure (in 10 crores of rupees) on health by the Govt. of India during the various five year plans in shown below: Planes: I II II IV V VI Expenditure on health (in 10 crores of rupees) 7 14 23 34 76 182 Construct a bar graph to represent the above data.
View Solution
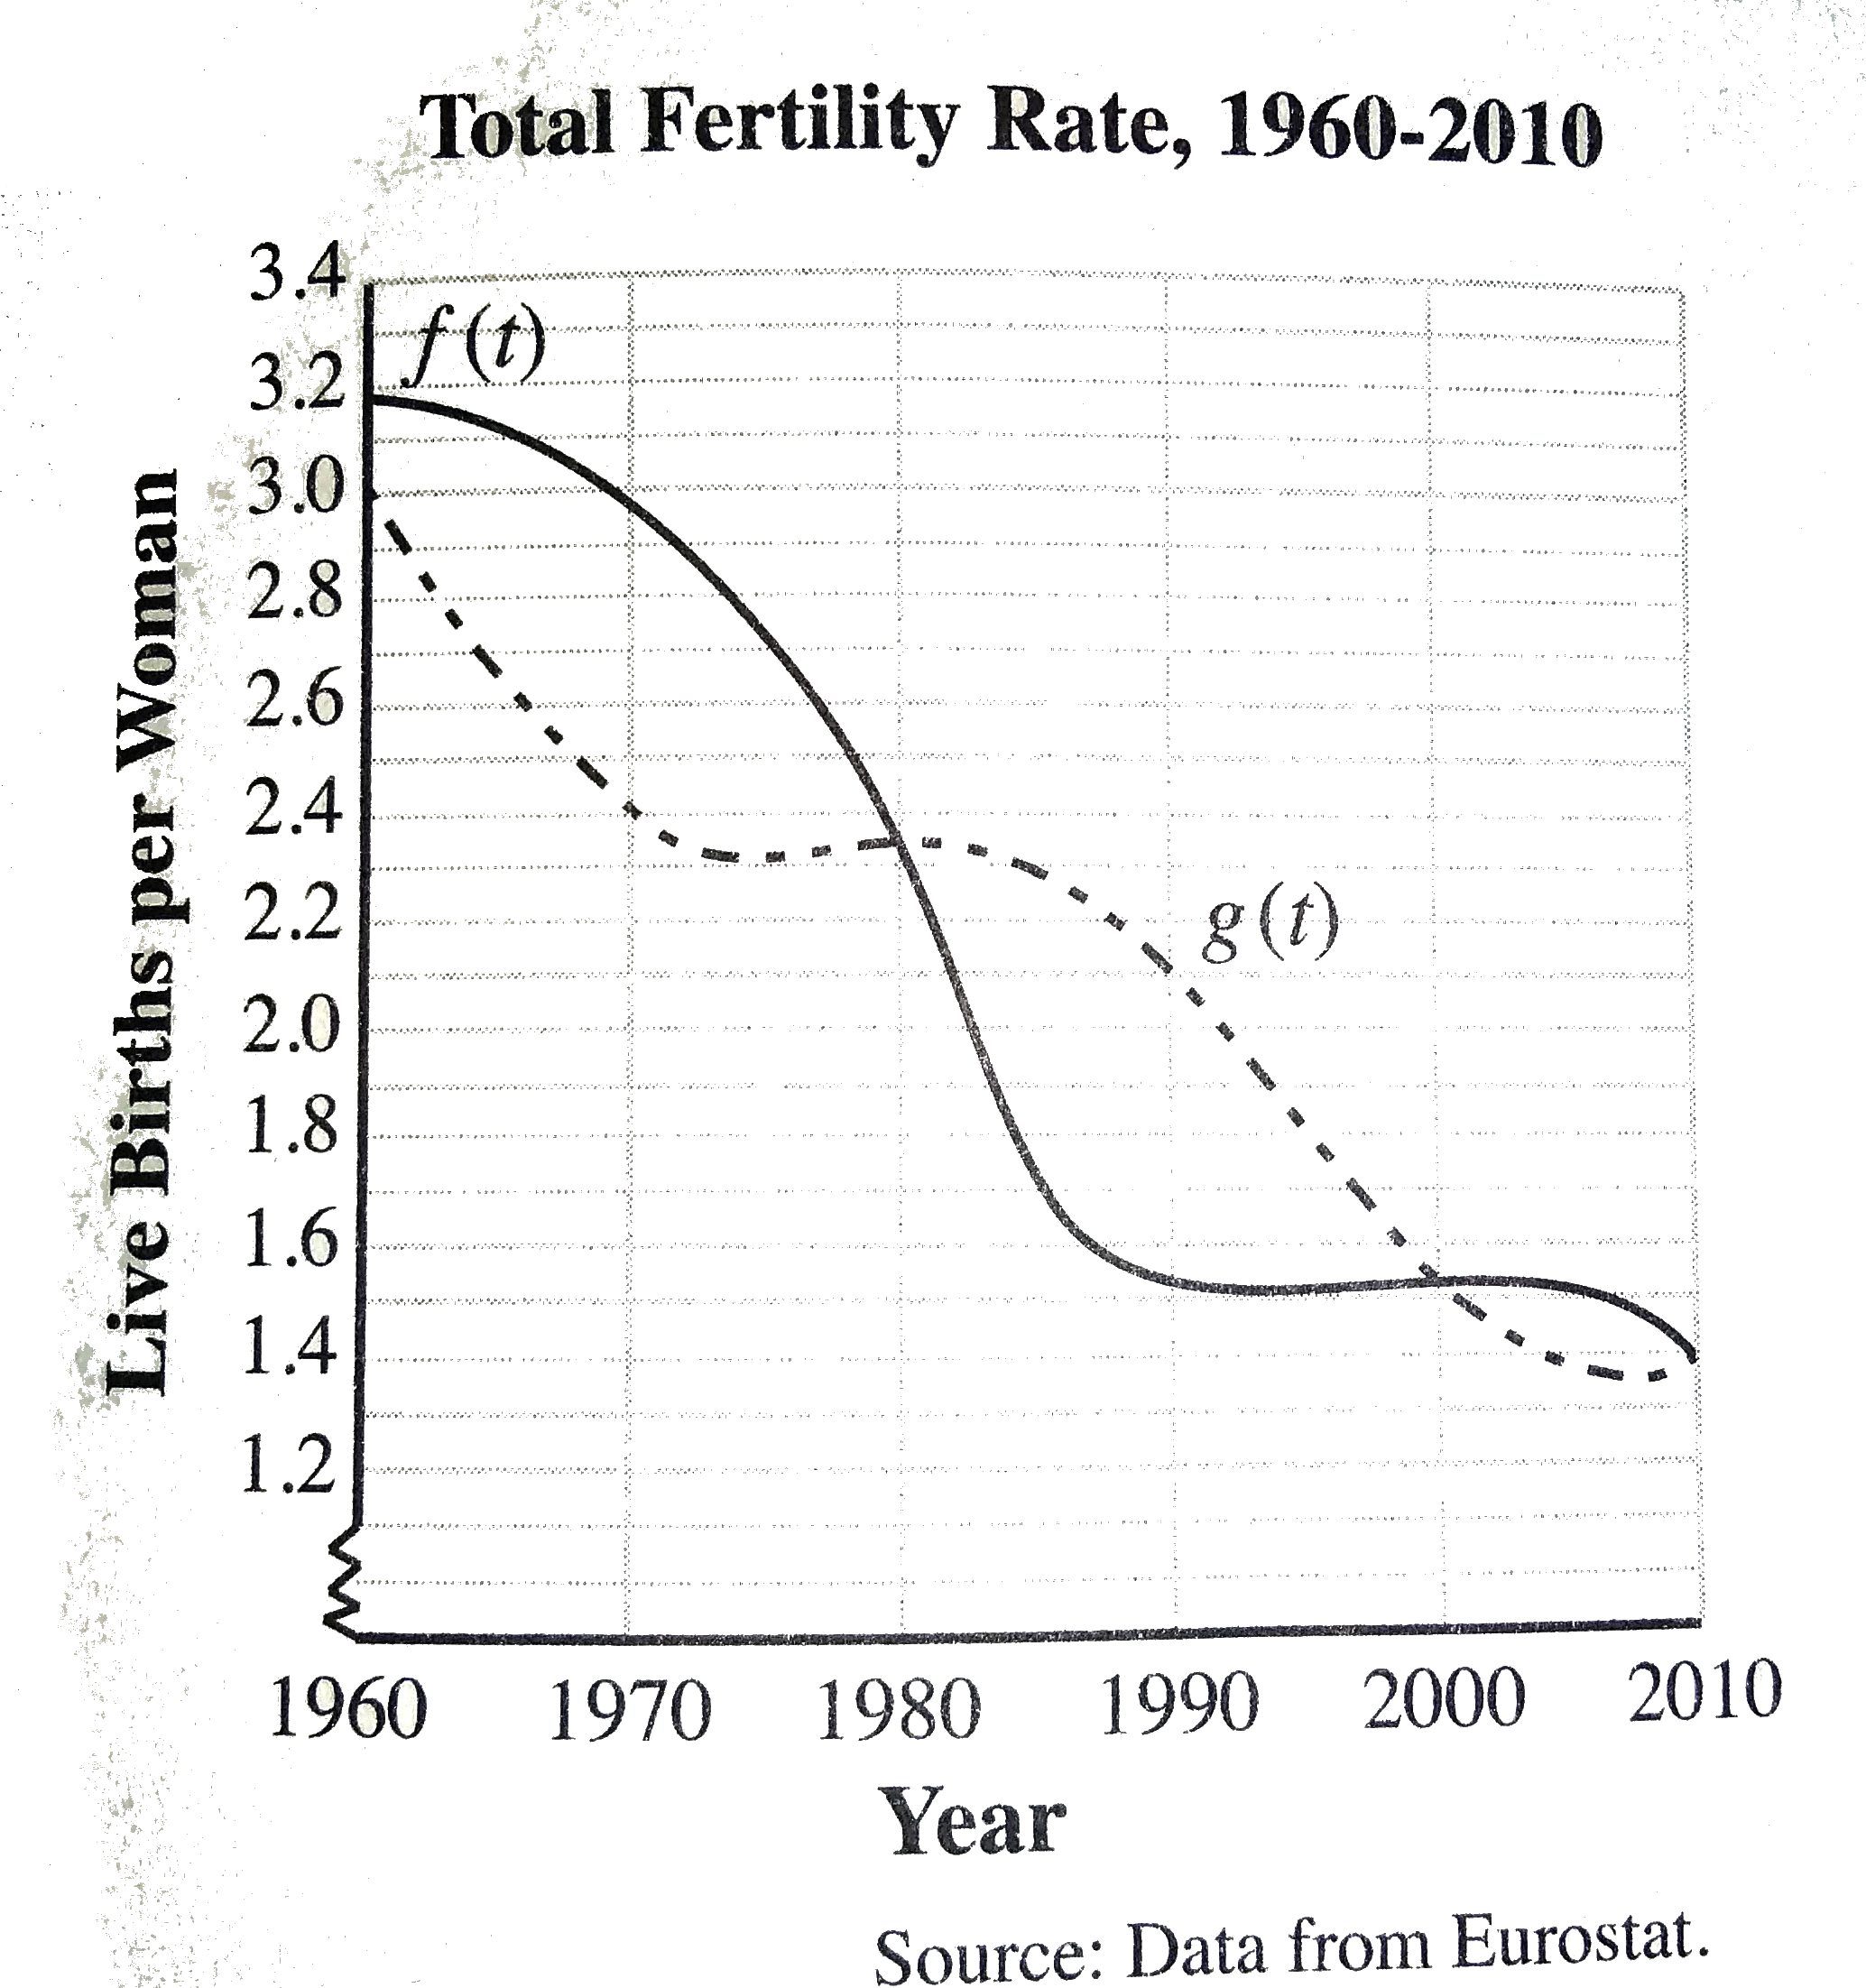
One indicator of a declining economy is a continued decline in birth rates. In 2010, birth rates in Europe were at an all-time low, with the average number of children that a women has in her lifetime at well below two. In the figure above, f(t) represents birth rates for Portugal between 1960 and 2010, and g(t) represents birth in Slovakia for the same time period. For which value (s) of t is f(t)>g(t)?
View SolutionViscosity is the property of fluid by virtue of which fluid offers resistance to deformation under the influence of a tangential force.

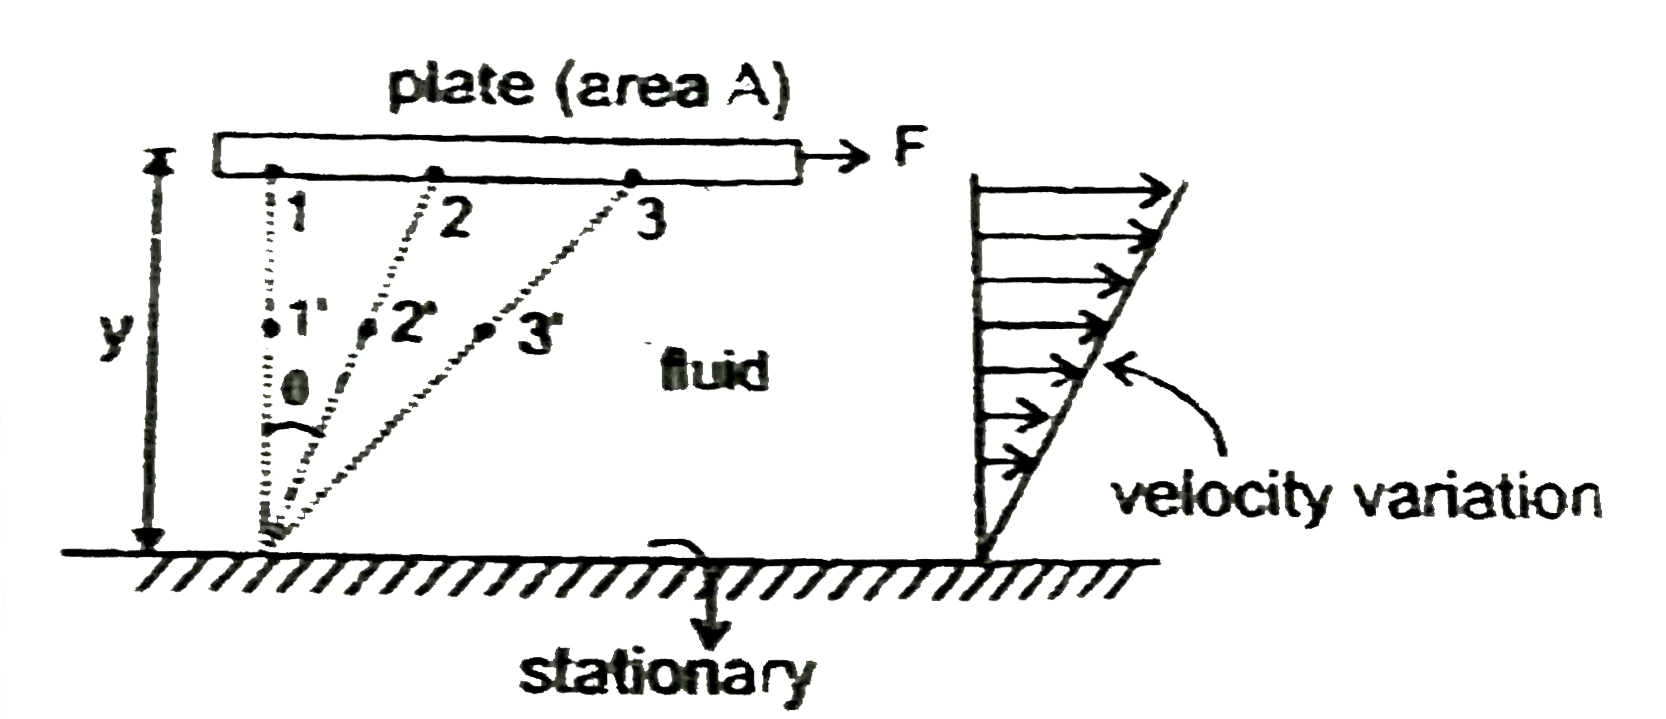
In the given figure as the the plate moves the fluid particle at the surface moves from position 1 to 2 and so on, but particles at the bottom boundry remain stationary. if the gap between palte and bottom boundary is small, fluid particles in between plate and bottom moves with velocities as shown by linear velocity distribution curve otherwise the velocity distribution may be parabolic. As per Newton's law of viscity the tangential force is related to time rate of deformation -
FAαd'θdt but y=d'θdt=u,d'θdt=uy
then F=ηAuy,η= coefficient of viscosity
for non-linear velocity distribution -
F=ηAdudy
where uy or dudy is known as velocity gradiant.
The velocity gradient just below the plate, in above problem is equal to - (per second)
View Solution
