A car starting from rest, accelerates at a rate of 2 m s−2 for 5 s. For this journey, (a) draw the velocity-time graph (b) draw the displacementtime graph using the velocity-time graph in part (a).
To solve the problem step by step, we will first draw the velocity-time graph and then use it to draw the displacement-time graph.
Step 1: Determine Initial Conditions
- The car starts from rest, which means the initial velocity (u) is 0 m/s.
- The acceleration (a) is given as 2 m/s².
- The time (t) for which the car accelerates is 5 seconds.
Step 2: Calculate Velocity at Different Time Intervals
Using the formula for velocity:
v=u+at
Since u=0:
v=0+2t
Now we will calculate the velocity at different time intervals (0 to 5 seconds):
- At t=0:
v=2×0=0m/s
- At t=1:
v=2×1=2m/s
- At t=2:
v=2×2=4m/s
- At t=3:
v=2×3=6m/s
- At t=4:
v=2×4=8m/s
- At t=5:
v=2×5=10m/s
Step 3: Plot the Velocity-Time Graph
- On the x-axis, plot time (0 to 5 seconds).
- On the y-axis, plot velocity (0 to 10 m/s).
- Plot the points calculated:
- (0, 0)
- (1, 2)
- (2, 4)
- (3, 6)
- (4, 8)
- (5, 10)
- Connect these points with a straight line since the acceleration is constant.
Step 4: Calculate Displacement Using Velocity
To find displacement (s), we can use the formula:
s=ut+12at2
Since u=0:
s=12×2×t2=t2
Now we will calculate displacement at the same time intervals:
- At t=0:
s=02=0m
- At t=1:
s=12=1m
- At t=2:
s=22=4m
- At t=3:
s=32=9m
- At t=4:
s=42=16m
- At t=5:
s=52=25m
Step 5: Plot the Displacement-Time Graph
- On the x-axis, plot time (0 to 5 seconds).
- On the y-axis, plot displacement (0 to 25 m).
- Plot the points calculated:
- (0, 0)
- (1, 1)
- (2, 4)
- (3, 9)
- (4, 16)
- (5, 25)
- Connect these points with a smooth curve since the displacement is quadratic in nature.
Final Graphs
- The velocity-time graph will be a straight line starting from the origin (0,0) and ending at (5,10).
- The displacement-time graph will be a parabola starting from the origin (0,0) and curving upwards, reaching (5,25).
---
- The car starts from rest, which means the initial velocity (u) is 0 m/s.
- The acceleration (a) is given as 2 m/s².
- The time (t) for which the car accelerates is 5 seconds.
Using the formula for velocity:
v=u+at
Since u=0:
v=0+2t
Now we will calculate the velocity at different time intervals (0 to 5 seconds):
v=2×0=0m/s
- At t=1:
v=2×1=2m/s
- At t=2:
v=2×2=4m/s
- At t=3:
v=2×3=6m/s
- At t=4:
v=2×4=8m/s
- At t=5:
v=2×5=10m/s
- On the x-axis, plot time (0 to 5 seconds).
- On the y-axis, plot velocity (0 to 10 m/s).
- Plot the points calculated:
- (0, 0)
- (1, 2)
- (2, 4)
- (3, 6)
- (4, 8)
- (5, 10)
- Connect these points with a straight line since the acceleration is constant.
To find displacement (s), we can use the formula:
s=ut+12at2
Since u=0:
s=12×2×t2=t2
s=02=0m
- At t=1:
s=12=1m
- At t=2:
s=22=4m
- At t=3:
s=32=9m
- At t=4:
s=42=16m
- At t=5:
s=52=25m
- On the x-axis, plot time (0 to 5 seconds).
- On the y-axis, plot displacement (0 to 25 m).
- Plot the points calculated:
- (0, 0)
- (1, 1)
- (2, 4)
- (3, 9)
- (4, 16)
- (5, 25)
- Connect these points with a smooth curve since the displacement is quadratic in nature.
- The velocity-time graph will be a straight line starting from the origin (0,0) and ending at (5,10).
- The displacement-time graph will be a parabola starting from the origin (0,0) and curving upwards, reaching (5,25).
Topper's Solved these Questions
- BOOK - ICSECHAPTER - MOTION IN ONE DIMENSION EXERCISE - EXERCISE -2 (A)28videos
MOTION IN ONE DIMENSION
- BOOK - ICSECHAPTER - MOTION IN ONE DIMENSION EXERCISE - EXERCISE -2 (A) ( Multiple choice type: )5videos
MOTION IN ONE DIMENSION
- BOOK - ICSECHAPTER - MEASUREMENTS AND EXPERIMENTATION EXERCISE - TOPIC 2 SIMPLE PENDULUM (4 Marks Questions )1videos
MEASUREMENTS AND EXPERIMENTATION
- BOOK - ICSECHAPTER - PRESSURE IN FLUIDS AND ATMOSPHERIC PRESSUREEXERCISE - Exercise -4(B)Numericals5videos
PRESSURE IN FLUIDS AND ATMOSPHERIC PRESSURE
Similar Questions
Draw areal velocity time graph for Mars.
View SolutionAre the following velocity − time graph and speed − time graphs possible ?
 View Solution
Draw displacement time and acceleration -time graph for the given velocity-time graph
 View Solution
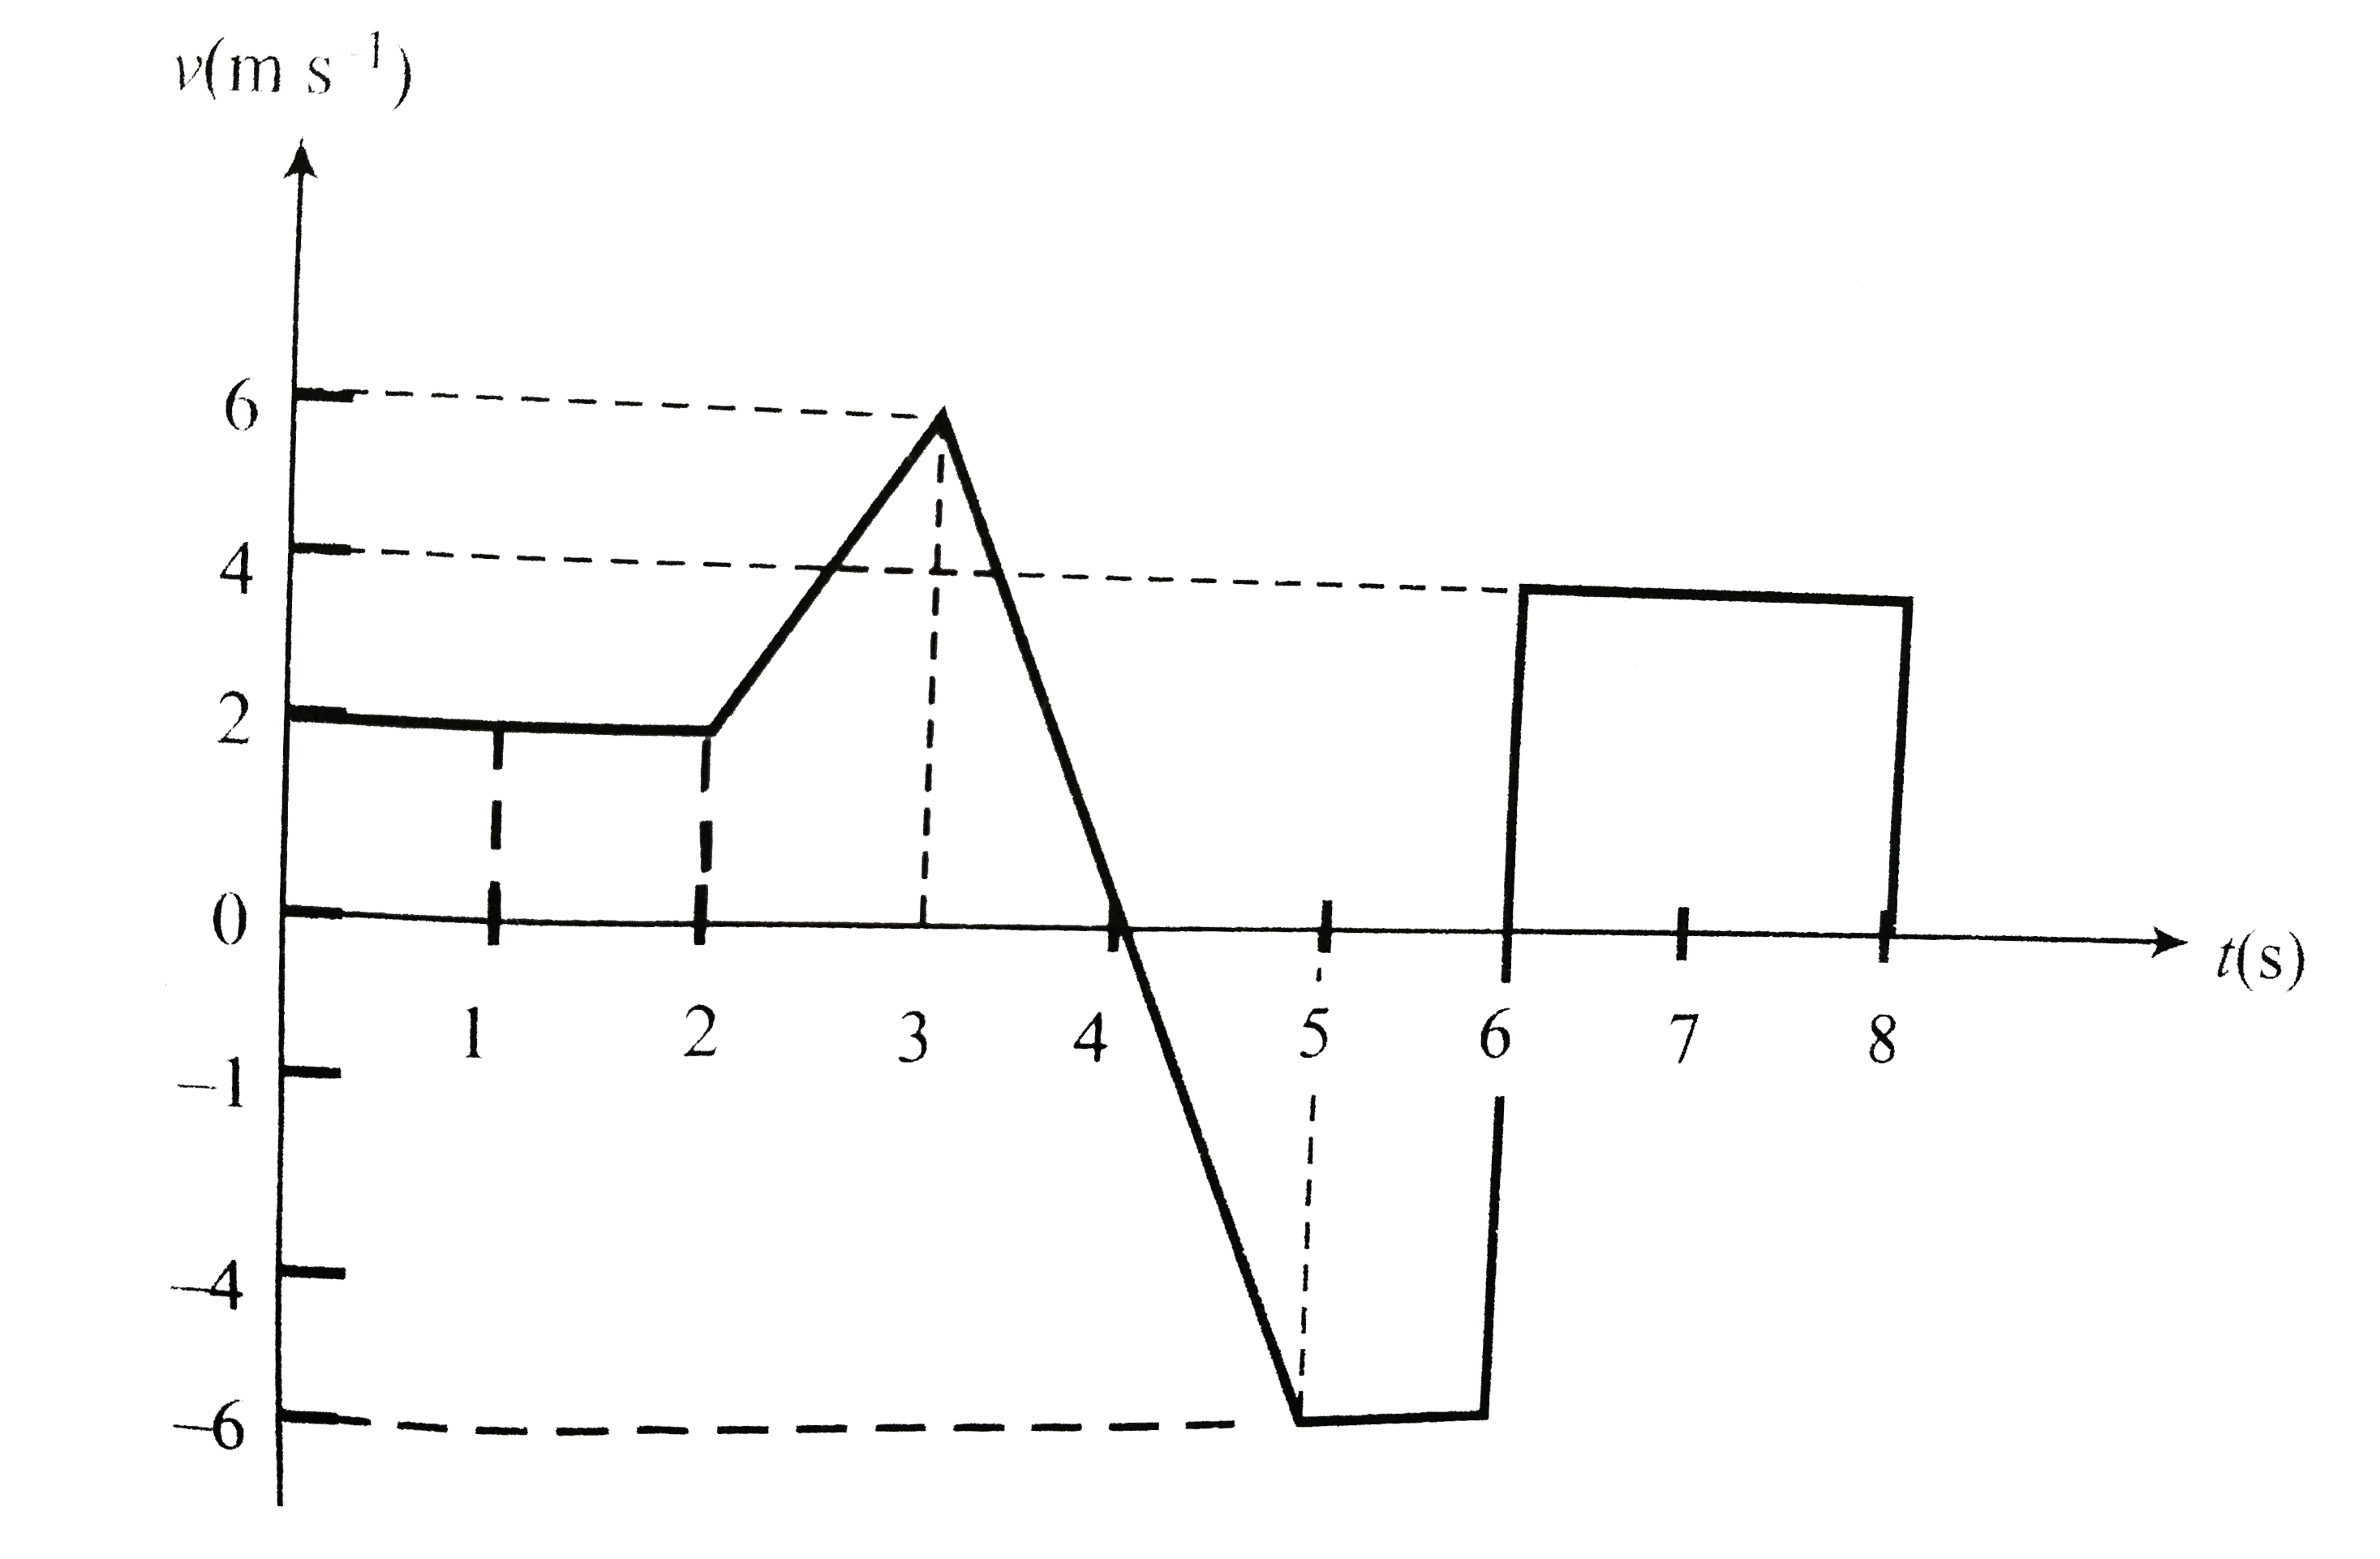
The velocity-time graph of a body is shown in .
The displacement of the body in 8s is.
 .View Solution
Draw the velocity-displacement graph of a body executing shm.
View SolutionThe graph of displacement v/s time is given below. Its corresponding velocity-time graph will be :
 View Solution
Draw the acceleration-time graphs for the given velocity-time graphs of a particle moving along x-axis.
 View Solution
Draw the velocity-time graph of an object moving with uniform negative acceleration.
View SolutionA particle starts from rest with a time varying acceleration a=(2t−4). Here t is in second and a in m/s2
The velocity time graph of the particle isView SolutionThe velocity-time graph is given below

Draw the acceleration-time graph and position-time graph, given that at t = 0, particle is at origin.View Solution

