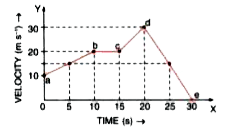
The following table represents the velocity of a moving body at different instants of time.
Times (s) 0 5 10 15 20 25 30
Velocity (ms
−1
) 10 15 20 20 30 15 0
The velocity-time graph is as shown in figure.
For which interval of time the body has a uniform motion ? Find the velocity in this time interval ?
204500
Expand-image
Text Solution
The velocity-time graph is shown in Fig. 2.32.

(i) The body has uniform motion from t = 10 s to t = 15 s in part bc since velocity is constant and is equal to 20 m s−1 during this interval.
(ii) The body has the accelerated motion from t = 0 s to t = 10 s in part ab, and also from t = 15 s to t = 20 s in part cd since velocity is increasing with time during these intervals.
From t = 0 to t = 10 s, in part ab
Acceleration a = Slope of the straight line ab
=(20−10)ms−1(10−0)s=10ms−110s=1ms−2
From t = 15 s to t = 20 s , in part cd
Acceleration a = Slope of the line cd
=(30−20)ms−1(20−15)s=10ms−15s=2ms−2
(iii) The body has retardation from t =20 s to t = 30 s , in part de. Retardation = - Slope of the line de
=−(0.30)ms−1(30−20)s=−−30ms−110s=3ms−2
|
Topper's Solved these Questions
- MOTION IN ONE DIMENSION BOOK - ICSECHAPTER - MOTION IN ONE DIMENSION EXERCISE - EXERCISE -2 (A)
28 Videos
- MOTION IN ONE DIMENSION BOOK - ICSECHAPTER - MOTION IN ONE DIMENSION EXERCISE - EXERCISE -2 (A) ( Multiple choice type: )
5 Videos
- MEASUREMENTS AND EXPERIMENTATION BOOK - ICSECHAPTER - MEASUREMENTS AND EXPERIMENTATION EXERCISE - TOPIC 2 SIMPLE PENDULUM (4 Marks Questions )
1 Videos
- PRESSURE IN FLUIDS AND ATMOSPHERIC PRESSUREBOOK - ICSECHAPTER - PRESSURE IN FLUIDS AND ATMOSPHERIC PRESSUREEXERCISE - Exercise -4(B)Numericals
5 Videos
Similar Questions
Knowledge Check
Velocity-time graph for a particle is shown in following figure for time interval 0 to 2T.
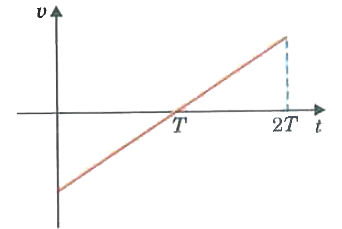 ADuring the motion, particle reverse its direction of motion.BParticle is moving with constant accelerationCNet displacement in time interval 0 to 2T is zero.DSpeeds of particle at t=0 and t=2T are same.
The velocity-time (v – t) graph of a body is shown in the figure. For the intervals OP and PQ, the ratio of the distances covered is
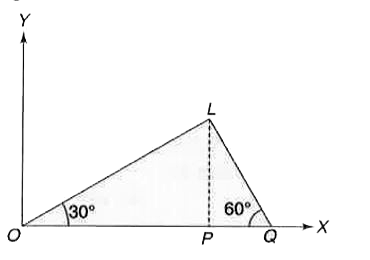 A1:3B√3:1C3:1D√3:2
The velocity-time graph of a body is shown in figure. The ratio of magnitude of average acceleration during the intervals OA and AB is
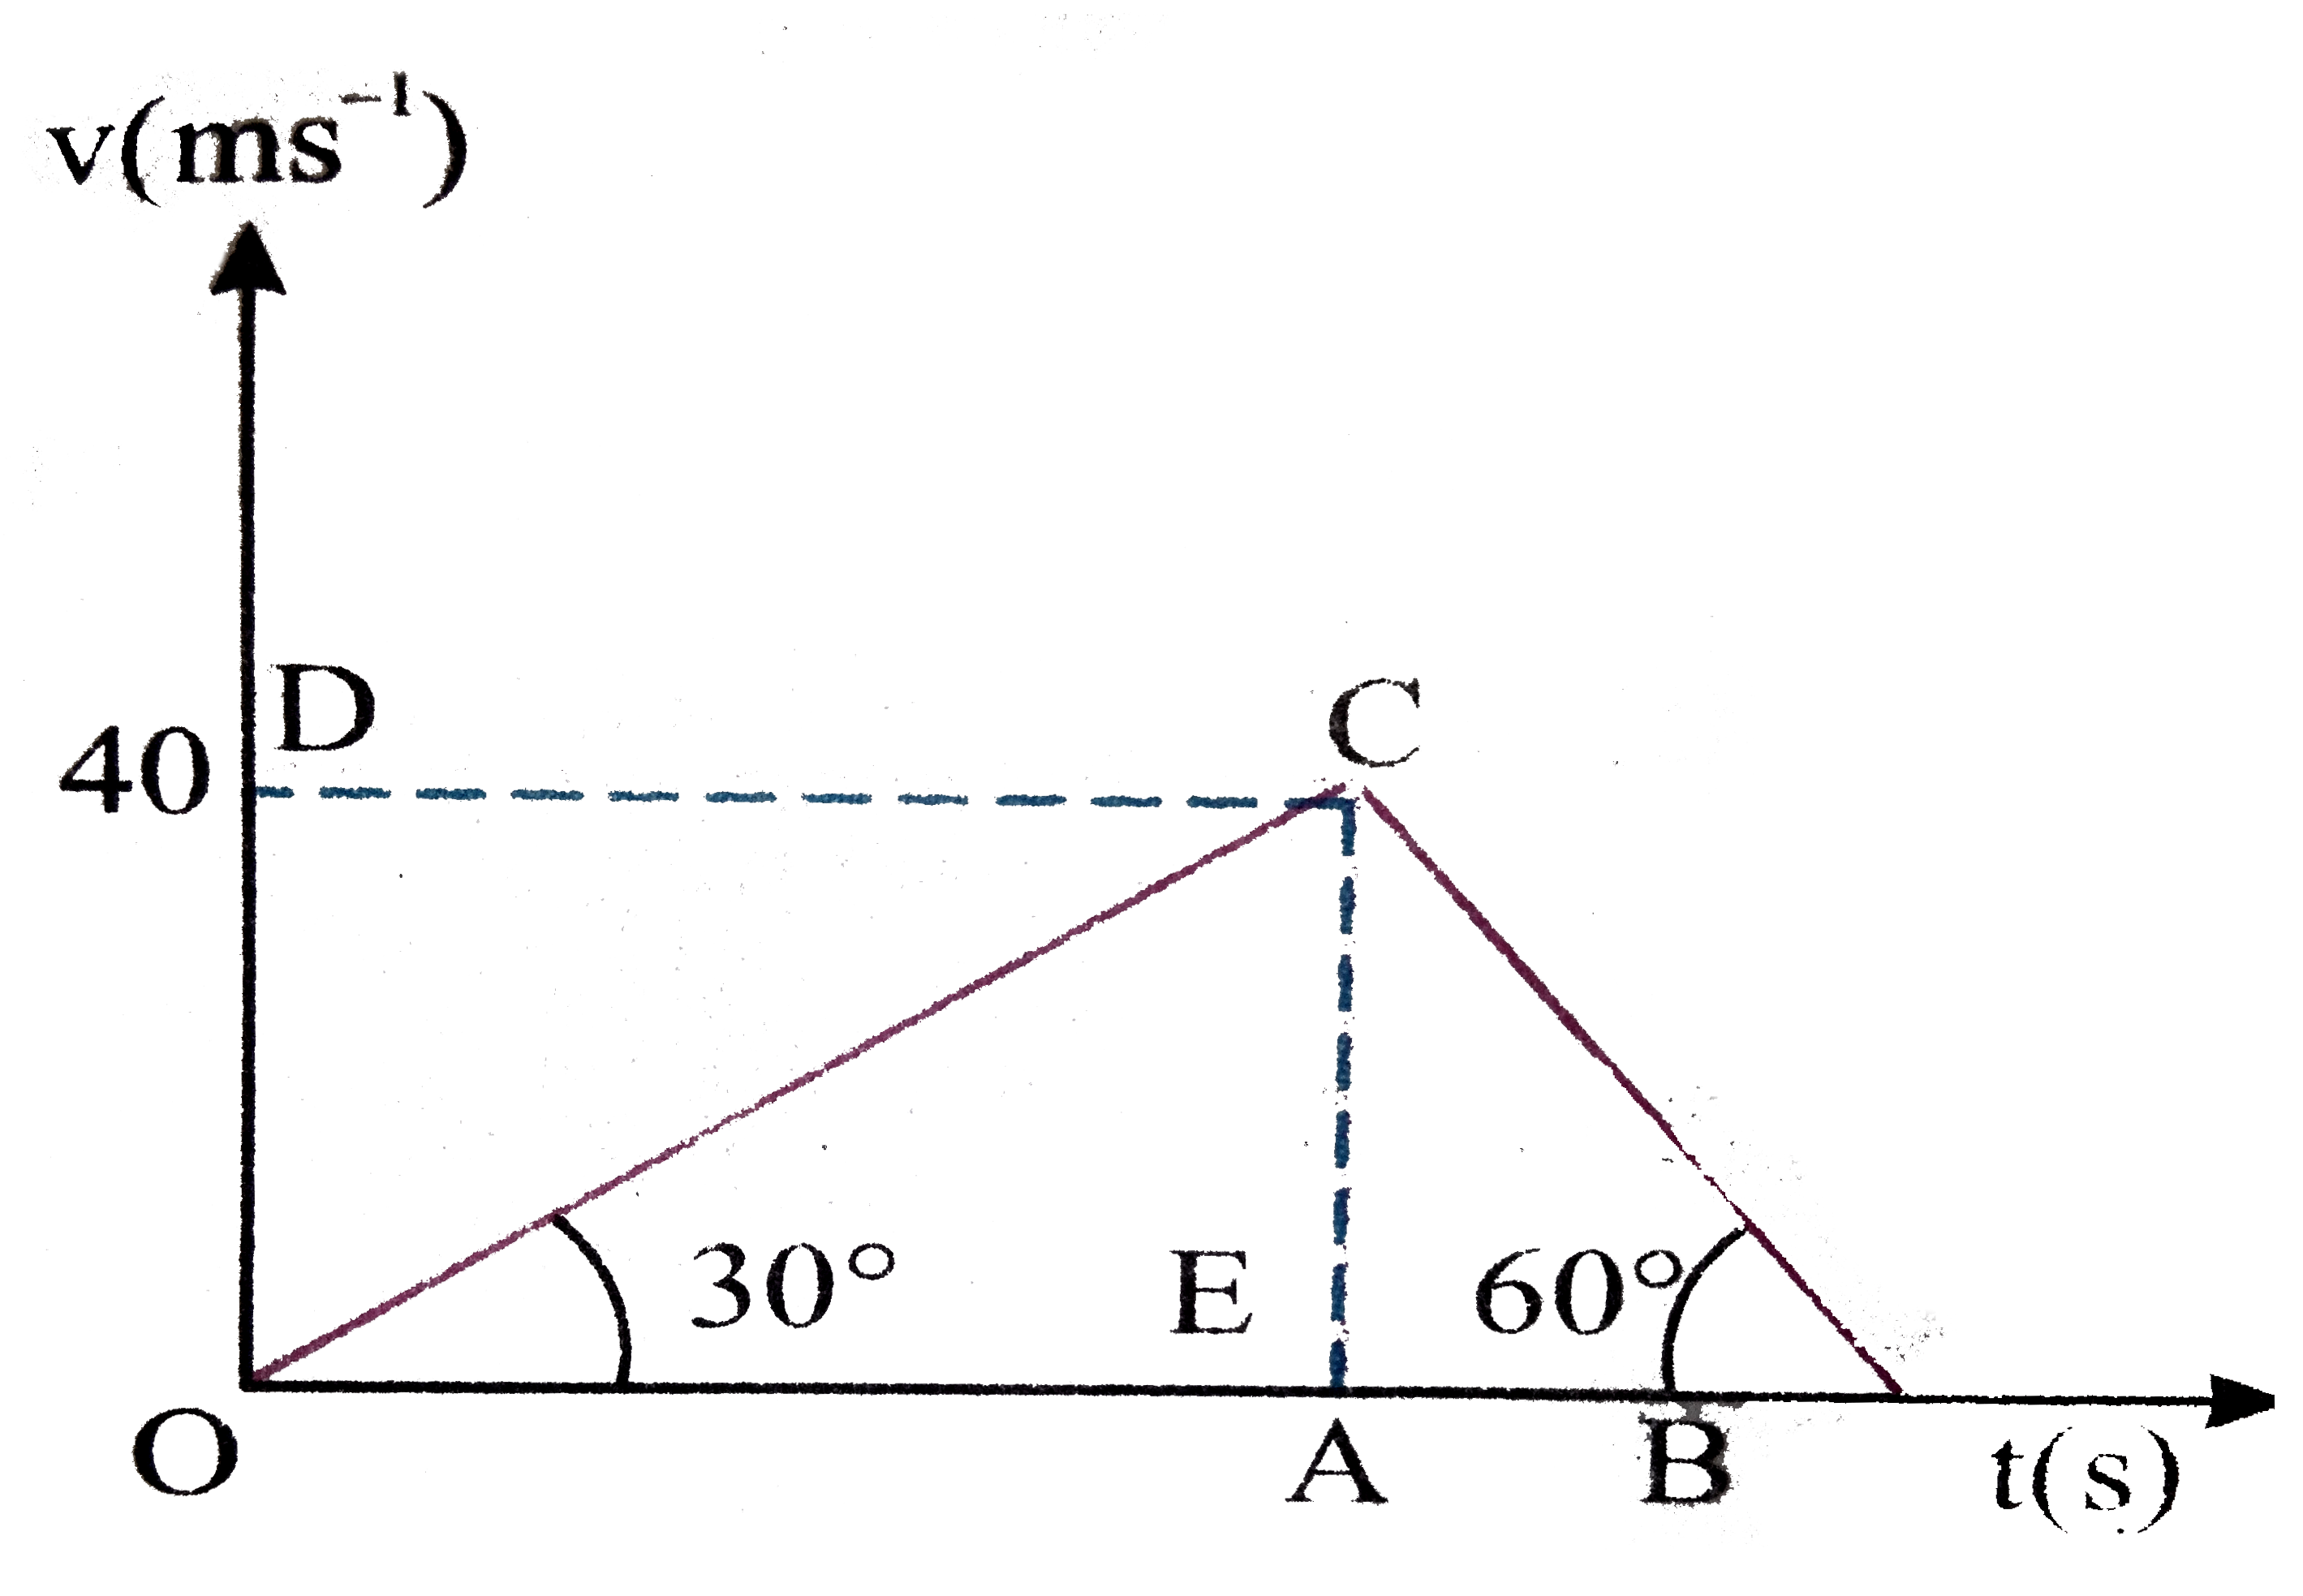 A1B12C13D3
Velocity -time graph for a body of mass 10 kg is shown in figure. Work -done on the body in first two seconds of the motion is :
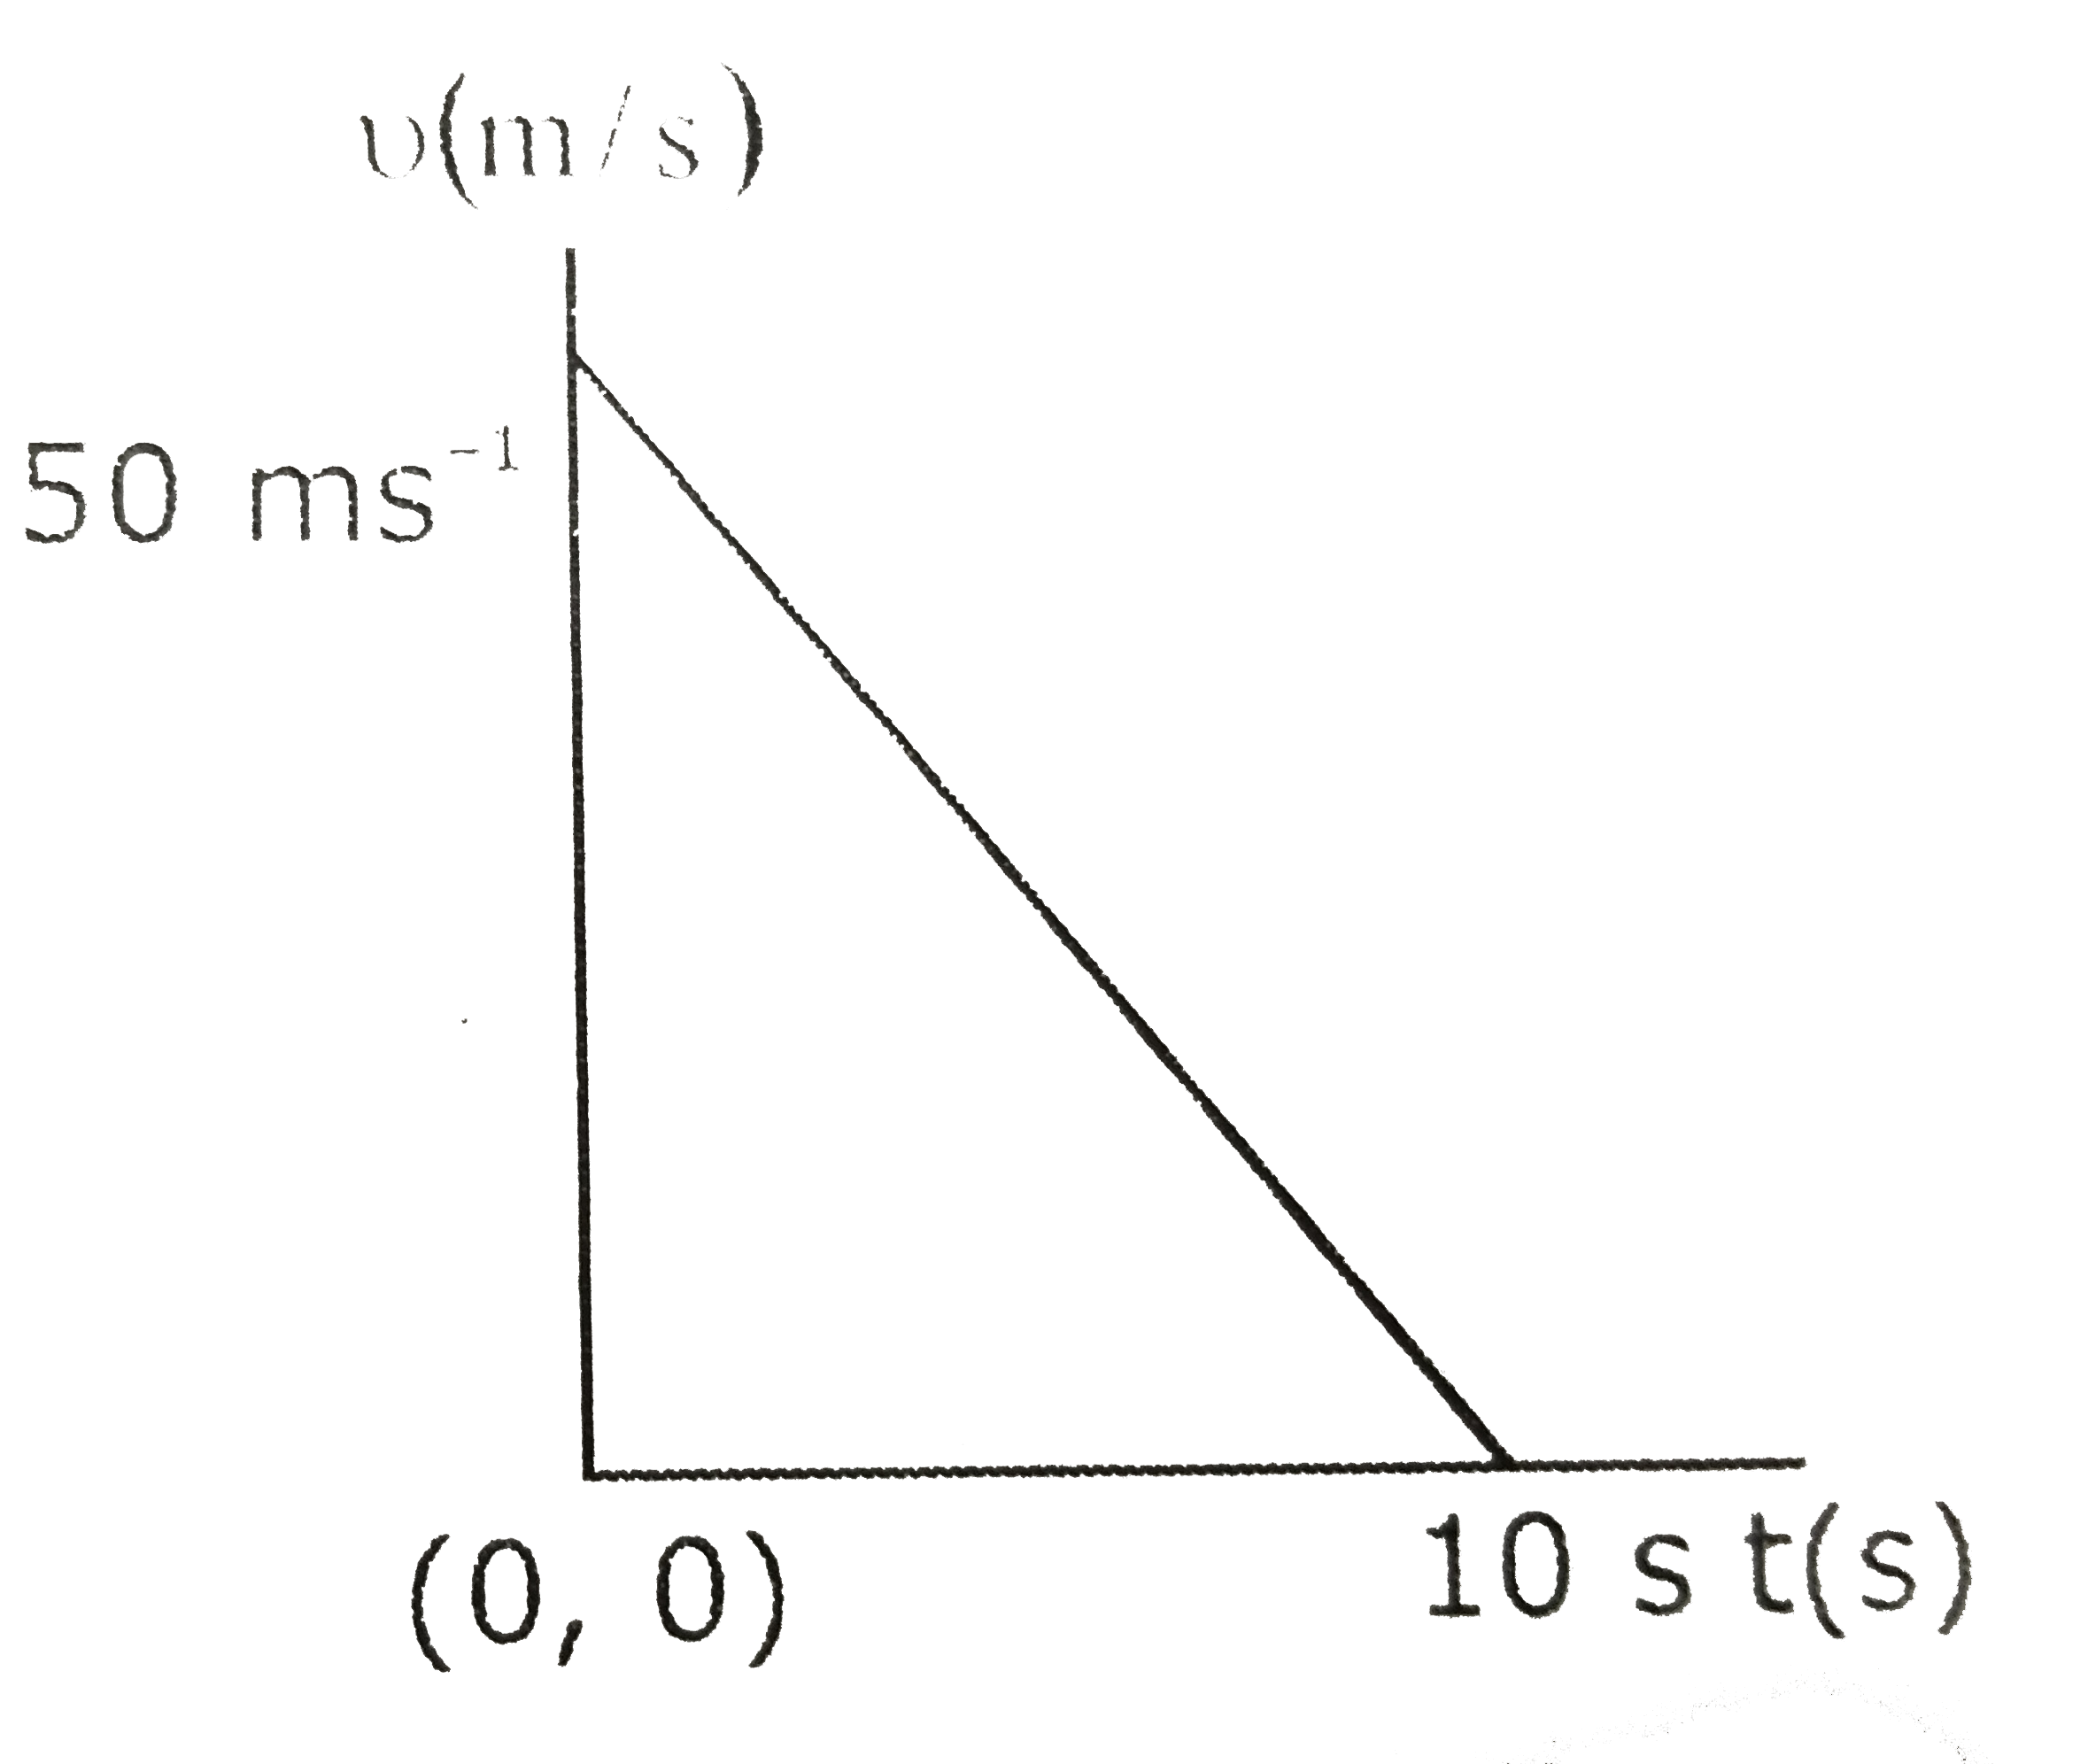
View SolutionThe velocity -time graph for a body with non-uniform motion is a
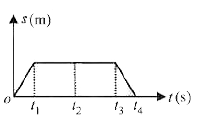
View SolutionThe displacement time graph of a body is shown in figure. The velocity-time graph of the motion of the body will be
View SolutionThe velocity - time graph of a body is given in figure below .
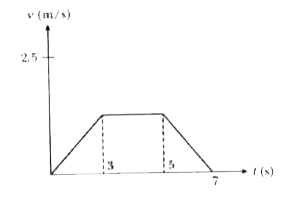
The acceleration-time graph of the motion of the body is
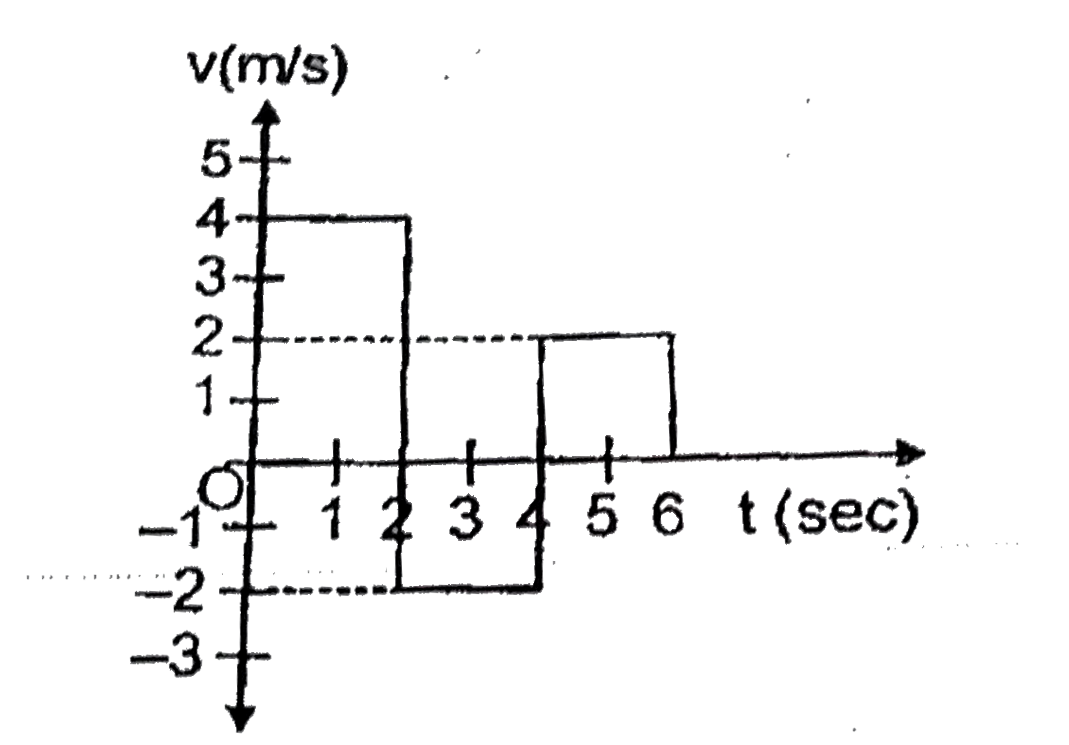
View SolutionThe velocity-time graph of a body moving in a straight line is shown in the figure.
View Solution
