The graph of PV vs P for a gas is
parabolic
hyperbolic
a straight line parallel to X-axis
a straight line passing through origin
The correct Answer is:c
To solve the question regarding the graph of PV vs P for a gas, we will follow these steps:
Step 1: Understand the relationship between PV and P
According to Boyle's Law, for a given amount of gas at constant temperature, the product of pressure (P) and volume (V) is a constant. This means that PV = constant.
Step 2: Rearranging the equation
If we consider the relationship PV = constant, we can express this as:
PV=k
where k is a constant.
Step 3: Analyzing the graph of PV vs P
When we plot PV against P, we are essentially plotting a constant value against varying pressure. Since PV is constant, the graph of PV vs P will not change with varying P.
Step 4: Determine the shape of the graph
Since PV is constant, the graph of PV vs P will be a horizontal line. This is because for any value of P, the value of PV remains the same, leading to a straight line parallel to the x-axis.
Step 5: Conclusion
From our analysis, we conclude that the graph of PV vs P for a gas is a straight line parallel to the x-axis.
Final Answer
The correct option is: A straight line parallel to the x-axis.
---
According to Boyle's Law, for a given amount of gas at constant temperature, the product of pressure (P) and volume (V) is a constant. This means that PV = constant.
If we consider the relationship PV = constant, we can express this as:
PV=k
where k is a constant.
When we plot PV against P, we are essentially plotting a constant value against varying pressure. Since PV is constant, the graph of PV vs P will not change with varying P.
Since PV is constant, the graph of PV vs P will be a horizontal line. This is because for any value of P, the value of PV remains the same, leading to a straight line parallel to the x-axis.
From our analysis, we conclude that the graph of PV vs P for a gas is a straight line parallel to the x-axis.
The correct option is: A straight line parallel to the x-axis.
Topper's Solved these Questions
- BOOK - ICSECHAPTER - STUDY OF GAS LAWS EXERCISE - TOPIC 1 (2 Marks Questions )14videos
STUDY OF GAS LAWS
- BOOK - ICSECHAPTER - STUDY OF GAS LAWS EXERCISE - TOPIC 1 (3 Marks Questions )17videos
STUDY OF GAS LAWS
- BOOK - ICSECHAPTER - SPECIMEN PAPER 3EXERCISE - SECTION II35videos
SPECIMEN PAPER 3
- BOOK - ICSECHAPTER - STUDY OF THE FIRST ELEMENT - HYDROGENEXERCISE - TOPIC 2 Properties of Hydrogen, Oxidation nd Reduction (5 MARKS QUESTIONS)29videos
STUDY OF THE FIRST ELEMENT - HYDROGEN
Similar Questions
Knowledge Check
- Question 1 - Select One
Assertion : At constant temperature PV vs P plot for real gases is not a straight line .
Reason : In the curves of dihydrogen and helium , as the pressure increases the value of PV also increases .AIf both assertion and reason are true and reason is the correct explanation of assertion .BIf both assertion and reason are true but reason is not the correct explanation of assertion .CIf assertion is true but reason is false .DIf both assertion and reason are false .
The graph between PV vs P at constant temperature is linear parallel to the pressure axis.
View SolutionThe plot of PV vs P at particular temperature is called isovbar.
View SolutionAssertion :− At constant temperature PV vs V plot for real gas is not a straight line.
Reason :− At high pressure, all gases have Z>1 but at low pressure most gases have Z<1View SolutionDraw a graph of log P vs log (1/V) for a fixed amount of a gas at constant temperature.
View SolutionFor an adiabatic process graph between PV & V for a sample of ideal gas will be
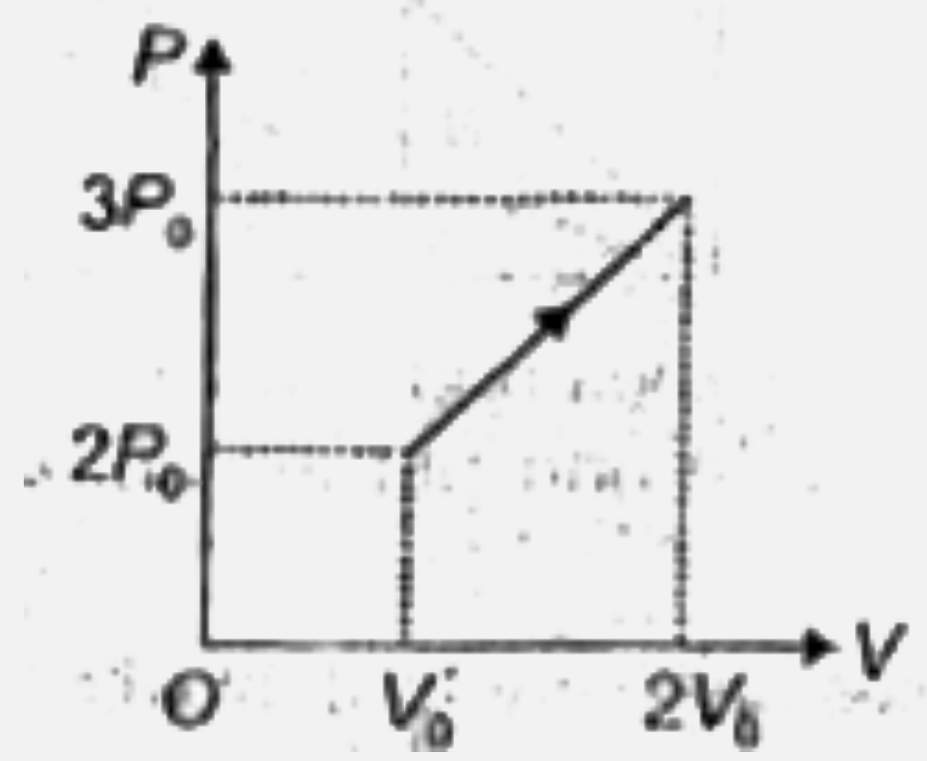
View SolutionThe PV-graph for a monatomic gas is shown in figure. Find the energy absorbed by the gas during this process.
 View Solution
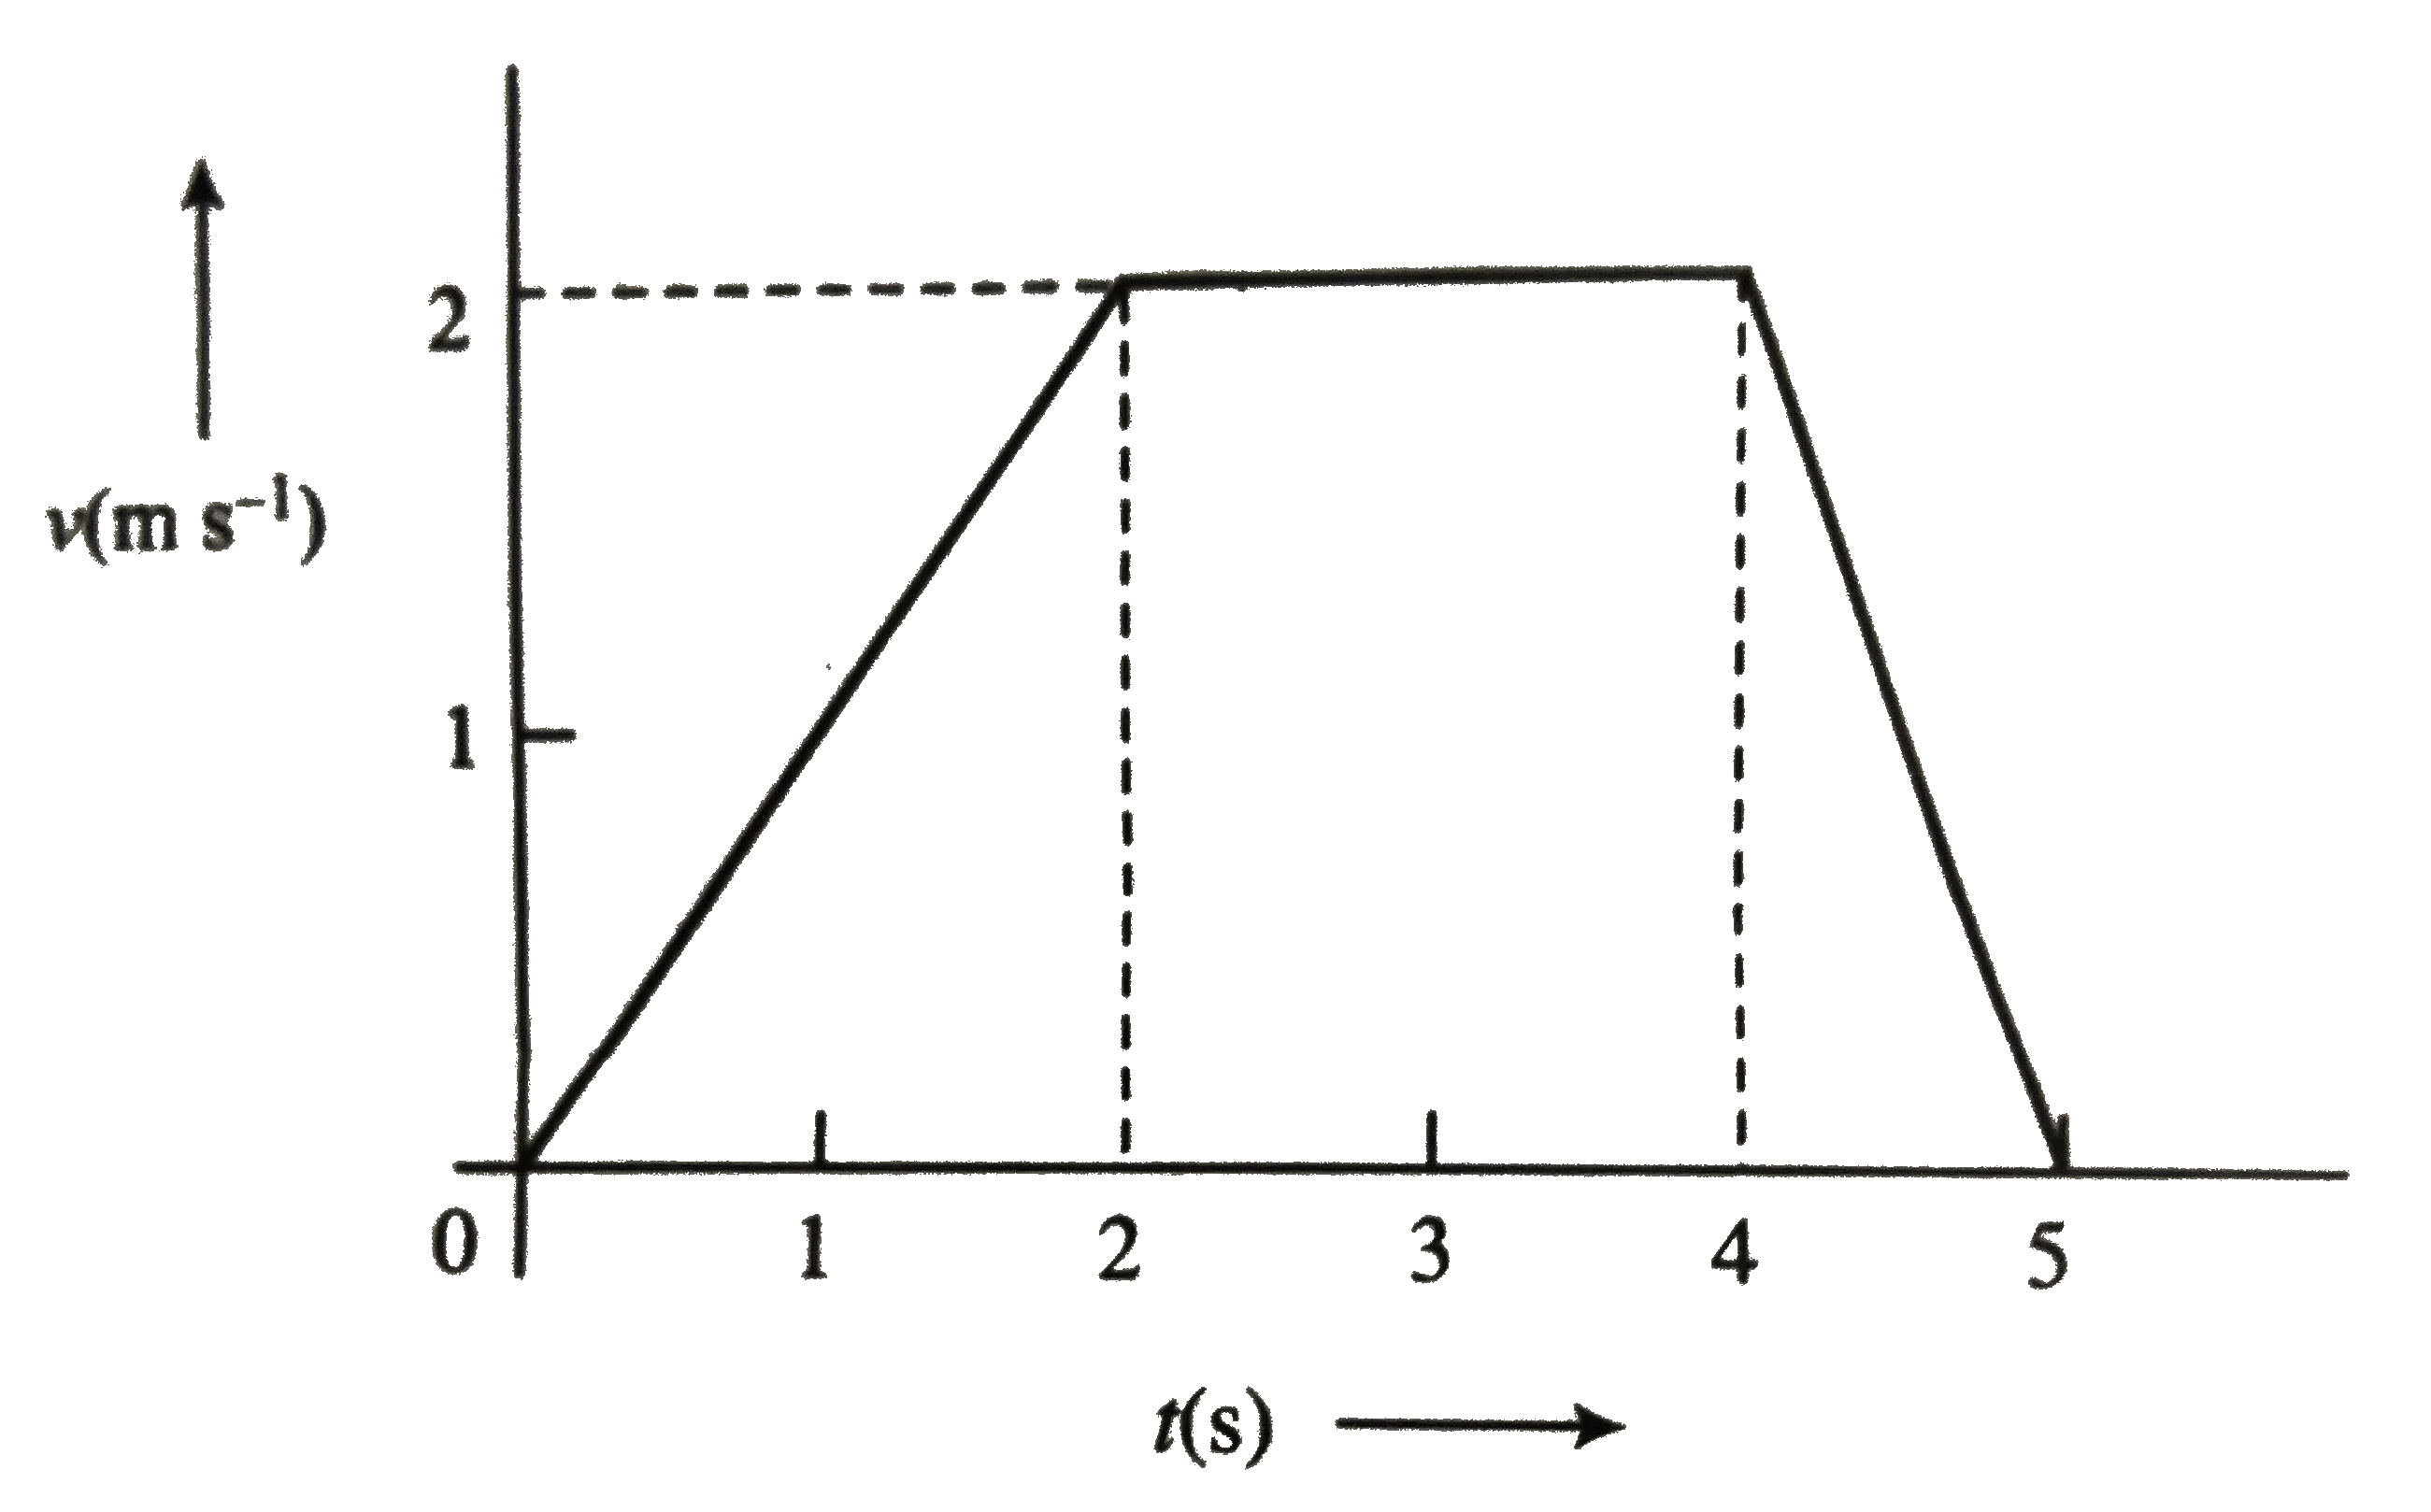
Starting at x=0, a particle moves according to the graph of v vs t shown in . Sketch a staph of the instantaneoud acceleration a vs t, indicationg numerical values at significant points of the graph.
 . View Solution


