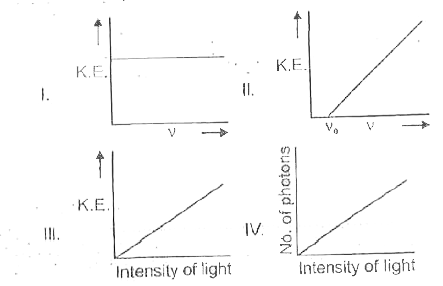
Which is the true graphical representation of V vs 1/P
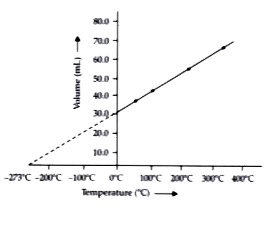
Graphical representation of Charles.s law : The relationship between volume and temperature of a gas can be plotted on a graph, as shown in the figure as a straight line is obtained.

Graph showing volume-temperature relationship in a gas (at constant pressure).
Topper's Solved these Questions
- BOOK - ICSECHAPTER - STUDY OF GAS LAWS EXERCISE - TOPIC 2 (5 Marks Questions )18videos
STUDY OF GAS LAWS
- BOOK - ICSECHAPTER - STUDY OF GAS LAWS EXERCISE - TOPIC 2 (2 Marks Questions )27videos
STUDY OF GAS LAWS
- BOOK - ICSECHAPTER - SPECIMEN PAPER 3EXERCISE - SECTION II35videos
SPECIMEN PAPER 3
- BOOK - ICSECHAPTER - STUDY OF THE FIRST ELEMENT - HYDROGENEXERCISE - TOPIC 2 Properties of Hydrogen, Oxidation nd Reduction (5 MARKS QUESTIONS)29videos
STUDY OF THE FIRST ELEMENT - HYDROGEN
Similar Questions
Knowledge Check
- Question 1 - Select One
The true graphical representation of volume versus temperature relationship at constant pressure is :
A B
B C
C D
D
When HCl (aq) is titrated with NaOH(aq) conductometrically then the graphical representation of the titration will be
View SolutionWhich one of the following is not the graphical representation of statistical data: bar graph (b) Histogram Frequency polygon (d) Comulative frequency distribution
View SolutionGive a graphical representation of the C4 cycle.
View Solution[A]: Growth curve is the graphic representation of the total growth against time.
[R]: Population growth curves are of two types-J shaped and S shapedView SolutionGive a graphic representation of the C3 cycle.
View SolutionGive the graphical representation of Boyle.s law and Charles.s law .
View SolutionIn a frequency distribution, ogives are graphical representation of (a) Frequency (b) Relative frequency (c) Cumulative frequency (d) Raw data
View Solution


