A person goes to post office slowly, purchases postcards and comes back speedily. Draw time - velocity and time - displacement graphs.
To solve the problem of drawing time-velocity and time-displacement graphs for a person who goes to a post office slowly, purchases postcards, and comes back quickly, we can break it down into steps:
Step 1: Understand the Motion
The person travels to the post office at a slow speed (let's denote this speed as v) and returns at a faster speed (let's denote this speed as v′). The journey consists of two parts:
1. Going to the post office (A to B)
2. Returning from the post office (B to A)
Step 2: Define the Time Intervals
Let:
- t1 be the time taken to go to the post office.
- t2 be the time taken to return from the post office.
Since the person is moving slowly to the post office and quickly back, we can say:
- t1>t2
Step 3: Draw the Time-Velocity Graph
1. Going to the Post Office (A to B): The velocity is constant and equal to v. This part of the graph will be a horizontal line at the level v from t=0 to t=t1.
2. Returning from the Post Office (B to A): The velocity is constant and equal to v′ (where v′>v). This part of the graph will be a horizontal line at the level v′ from t=t1 to t=t1+t2.
Step 4: Draw the Time-Displacement Graph
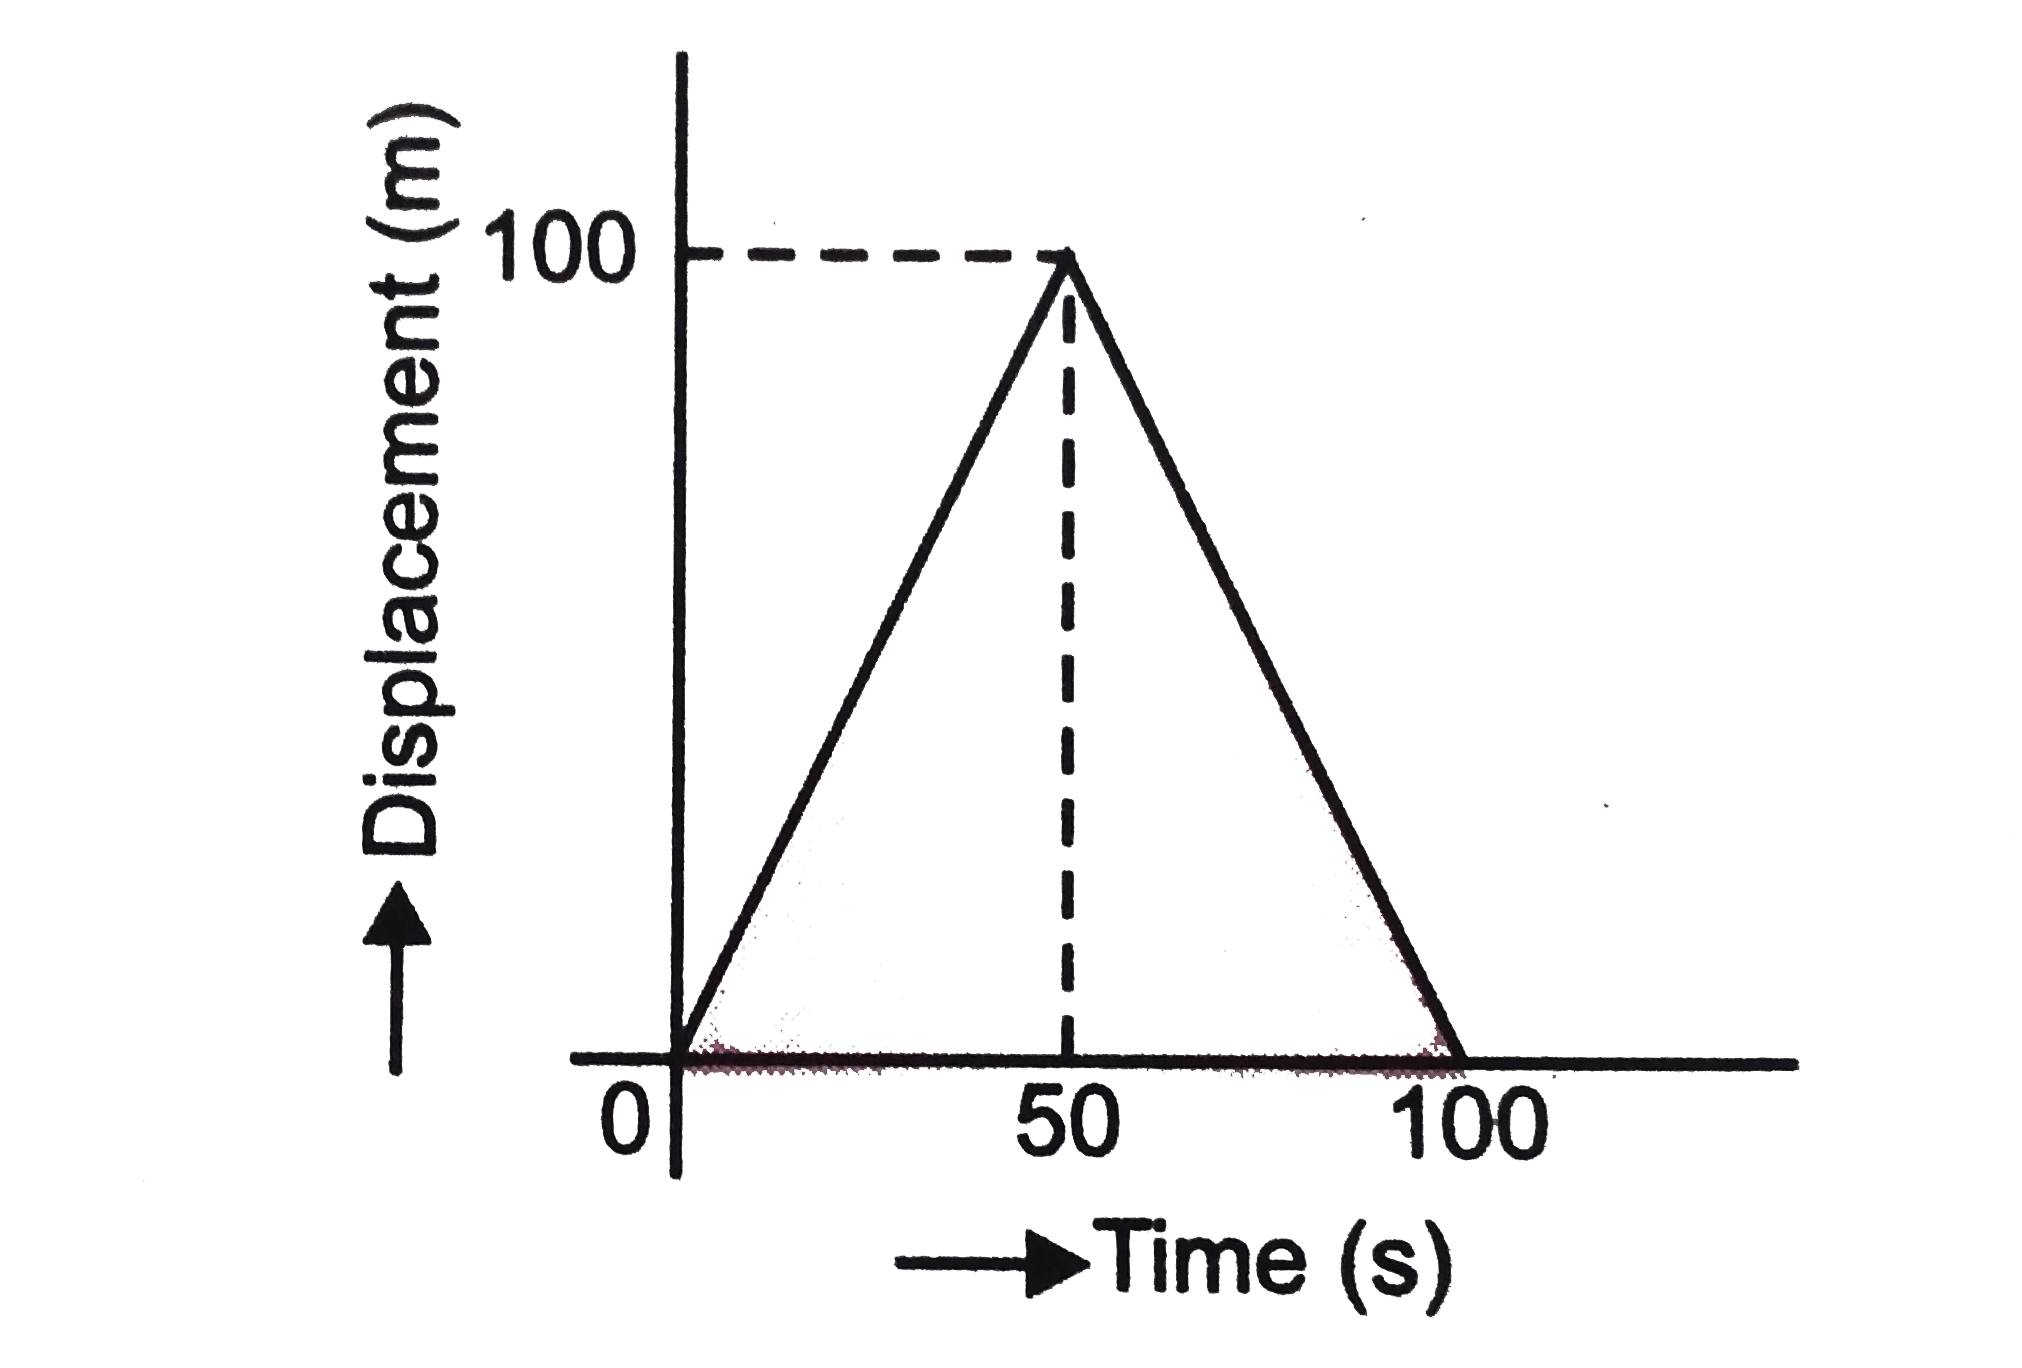
1. Going to the Post Office (A to B): The displacement increases linearly with time. The slope of this line represents the velocity v. This line will start from the origin (0,0) and go to the point (t1,d1), where d1 is the displacement to the post office.
2. Returning from the Post Office (B to A): The displacement decreases linearly as the person returns. The slope of this line represents the velocity v′. This line will start from (t1,d1) and go back to the origin (0,0) at the point (t1+t2,0).
Step 5: Summary of Graphs
- Time-Velocity Graph:
- From t=0 to t=t1, the graph is a horizontal line at v.
- From t=t1 to t=t1+t2, the graph is a horizontal line at v′.
- Time-Displacement Graph:
- From t=0 to t=t1, the graph is a straight line increasing to (t1,d1).
- From t=t1 to t=t1+t2, the graph is a straight line decreasing back to the origin (t1+t2,0).
The person travels to the post office at a slow speed (let's denote this speed as v) and returns at a faster speed (let's denote this speed as v′). The journey consists of two parts:
1. Going to the post office (A to B)
2. Returning from the post office (B to A)
Let:
- t1 be the time taken to go to the post office.
- t2 be the time taken to return from the post office.
- t1>t2
1. Going to the Post Office (A to B): The velocity is constant and equal to v. This part of the graph will be a horizontal line at the level v from t=0 to t=t1.
2. Returning from the Post Office (B to A): The velocity is constant and equal to v′ (where v′>v). This part of the graph will be a horizontal line at the level v′ from t=t1 to t=t1+t2.
1. Going to the Post Office (A to B): The displacement increases linearly with time. The slope of this line represents the velocity v. This line will start from the origin (0,0) and go to the point (t1,d1), where d1 is the displacement to the post office.
2. Returning from the Post Office (B to A): The displacement decreases linearly as the person returns. The slope of this line represents the velocity v′. This line will start from (t1,d1) and go back to the origin (0,0) at the point (t1+t2,0).
- Time-Velocity Graph:
- From t=0 to t=t1, the graph is a horizontal line at v.
- From t=t1 to t=t1+t2, the graph is a horizontal line at v′.
- From t=0 to t=t1, the graph is a straight line increasing to (t1,d1).
- From t=t1 to t=t1+t2, the graph is a straight line decreasing back to the origin (t1+t2,0).
Topper's Solved these Questions
- BOOK - ICSECHAPTER - SAMPLE QUESTION PAPER 5EXERCISE - SECTION - C (Answer all questions.)9videos
SAMPLE QUESTION PAPER 5
- BOOK - ICSECHAPTER - SAMPLE QUESTION PAPER 5EXERCISE - SECTION - D (Answer all questions.)6videos
SAMPLE QUESTION PAPER 5
- BOOK - ICSECHAPTER - SAMPLE QUESTION PAPER 5EXERCISE - SECTION - A (Answer the following questions briefly and to the point:)7videos
SAMPLE QUESTION PAPER 5
- BOOK - ICSECHAPTER - SAMPLE QUESTION PAPER 4EXERCISE - SECTION - D (Answer all questions.)7videos
SAMPLE QUESTION PAPER 4
- BOOK - ICSECHAPTER - SAMPLE QUESTION PAPER-2 EXERCISE - SECTION-D10videos
SAMPLE QUESTION PAPER-2
Similar Questions
Draw the velocity-displacement graph of a body executing shm.
View SolutionDraw areal velocity time graph for Mars.
View SolutionA boy goes to a shop, which is 3 km away, buys things and comes back. What is the distance and displacement in km and m?
View SolutionA girl walks along a straight path to drop a letter in the letterbox and comes back to her initial position. Her displacement-time graph is shown in Figure. Plot a velocity-time graph for the same.
 View Solution
a. A ball is thrown vertically upwards. Aftre some time it trturns to the throuer. Draw the velocity-time graph and speed-time graph.
b. A ball is dropped from some height. After rebounding from the floor, it ascends to the same height. Draw the velocity-time graph and speed-time graph.View SolutionA car starting from rest, accelerates at a rate of 2 m s−2 for 5 s. For this journey, (a) draw the velocity-time graph (b) draw the displacementtime graph using the velocity-time graph in part (a).
View SolutionA person starts from origin and for his linear motion velocity is given as shown in figure. Draw displacement and acceleration graph with respect to time. Also find maximum displacement of the person.
 View Solution
The velocity of particle (whose displacement time graph is shown) at t=3
 .View Solution
Are the following velocity − time graph and speed − time graphs possible ?
 View Solution
What does the slope of a displacement-time graph represent?
View Solution

