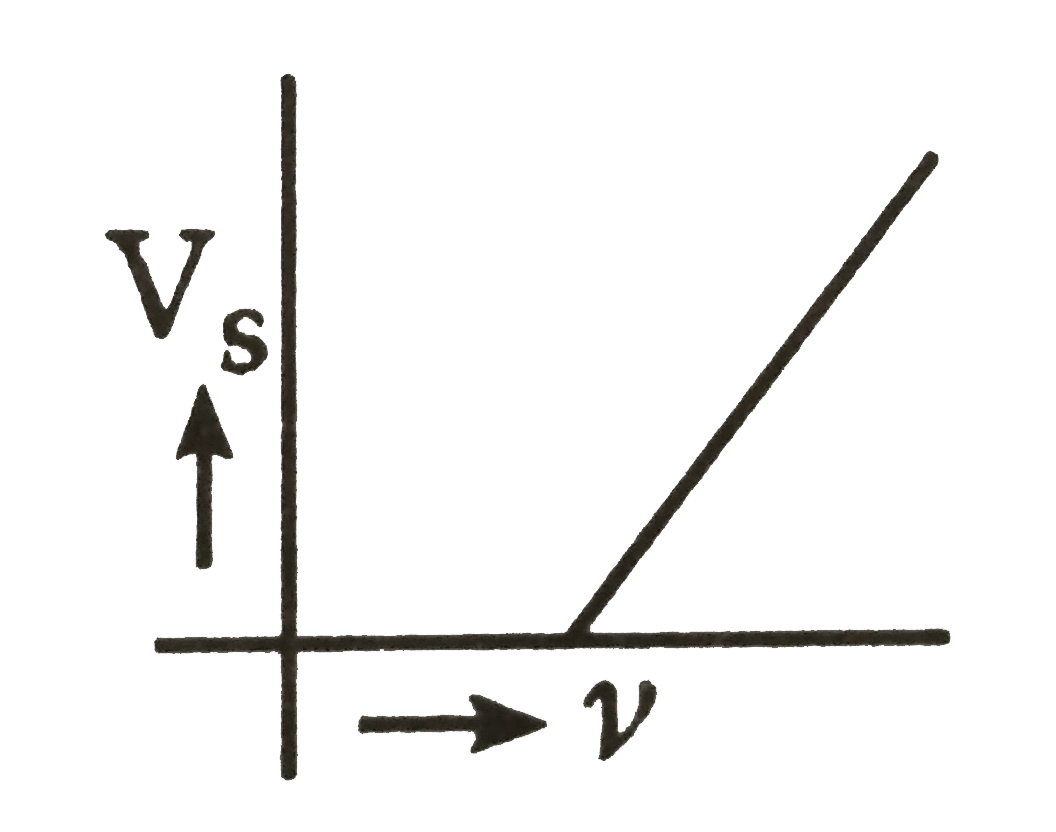
(i) Plot a labelled graph of |Vs| where Vs is stopping potential versus frequency f of the incident radiation.
(ii) State how will you use this graph to determine the value of Planck.s constant.
To solve the problem, we will break it down into two parts as per the question.
Part (i): Plotting the Graph of Stopping Potential vs. Frequency
1. Understanding the Variables:
- Let Vs be the stopping potential (on the y-axis).
- Let f be the frequency of the incident radiation (on the x-axis).
2. Using the Photoelectric Effect Equation:
- According to the photoelectric effect, the energy of the incident photons can be expressed as:
E=hf
- The maximum kinetic energy of the emitted electrons is given by:
Kmax=eVs
- The work function ϕ can be expressed as:
hf=Kmax+ϕ
3. Relating Stopping Potential to Frequency:
- Substituting Kmax into the equation gives:
hf=eVs+ϕ
- Rearranging this equation, we have:
Vs=hef−ϕe
4. Identifying the Graph:
- This equation is in the form of y=mx+c, where:
- y is Vs
- m (slope) is he
- x is f
- c (y-intercept) is −ϕe
5. Plotting the Graph:
- On the graph, plot Vs on the y-axis and f on the x-axis.
- The graph will be a straight line with a slope of he and a y-intercept of −ϕe.
Part (ii): Determining Planck's Constant from the Graph
1. Understanding the Slope:
- From the graph, the slope m is given by:
m=he
2. Calculating Planck's Constant:
- Rearranging the slope equation gives:
h=e⋅m
- Here, e is the charge of the electron, approximately 1.6×10⁻¹⁹ coulombs.
3. Finding the Slope:
- Measure the slope m from the graph (rise over run).
- Calculate h using the formula:
h=e⋅slope
4. Final Calculation:
- Substitute the value of e and the calculated slope into the equation to find h.
Summary of Steps:
1. Plot Vs vs. f to obtain a straight line.
2. Determine the slope of the line.
3. Use the slope to calculate Planck's constant using h=e⋅slope.
- Let Vs be the stopping potential (on the y-axis).
- Let f be the frequency of the incident radiation (on the x-axis).
- According to the photoelectric effect, the energy of the incident photons can be expressed as:
E=hf
- The maximum kinetic energy of the emitted electrons is given by:
Kmax=eVs
- The work function ϕ can be expressed as:
hf=Kmax+ϕ
- Substituting Kmax into the equation gives:
hf=eVs+ϕ
- Rearranging this equation, we have:
Vs=hef−ϕe
- This equation is in the form of y=mx+c, where:
- y is Vs
- m (slope) is he
- x is f
- c (y-intercept) is −ϕe
- On the graph, plot Vs on the y-axis and f on the x-axis.
- The graph will be a straight line with a slope of he and a y-intercept of −ϕe.
- From the graph, the slope m is given by:
m=he
- Rearranging the slope equation gives:
h=e⋅m
- Here, e is the charge of the electron, approximately 1.6×10⁻¹⁹ coulombs.
- Measure the slope m from the graph (rise over run).
- Calculate h using the formula:
h=e⋅slope
- Substitute the value of e and the calculated slope into the equation to find h.
1. Plot Vs vs. f to obtain a straight line.
2. Determine the slope of the line.
3. Use the slope to calculate Planck's constant using h=e⋅slope.
Similar Questions
The slope of the graph drawn between stopping potential and frequency of incident radiation will be
View SolutionPlot a labelled graph of maximum kinetic energy of photo electrons versus frequency of incident radiation. State how you will obtain the value of Planck.s constant h from the graph.
View Solution
Knowledge Check
- Question 1 - Select One
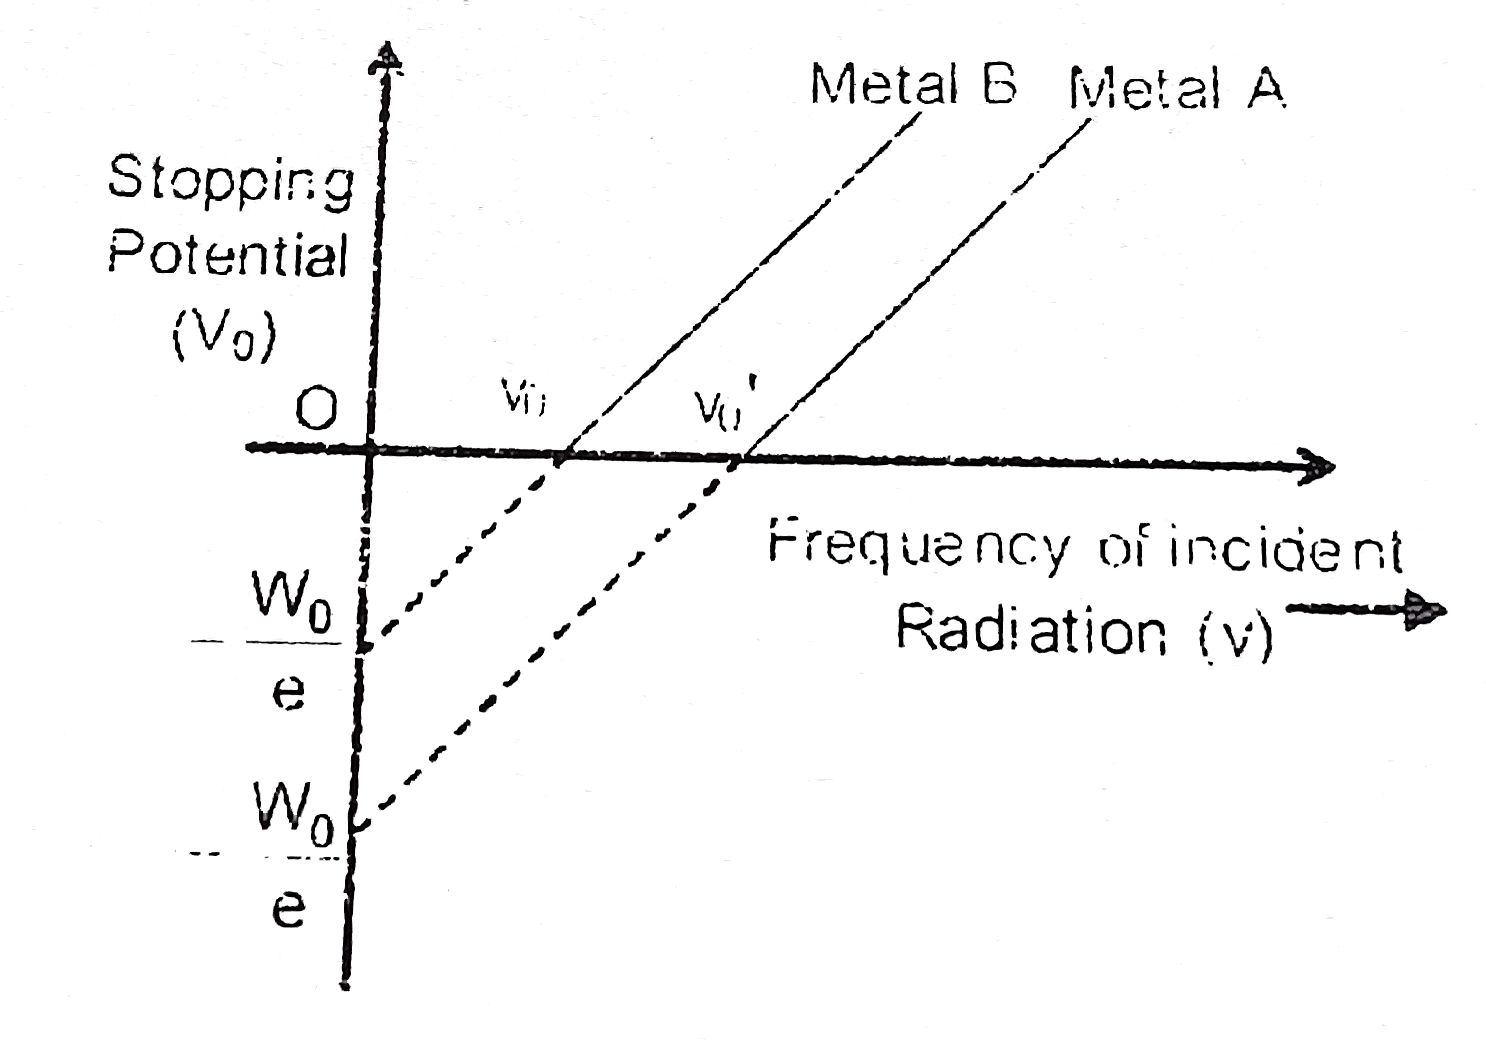
The stopping potential as a function of the frequency of the incident radiation is plotted for two different photoelectric surfaces A and B . The graphs show that work function of A is
 AlessBmoreCequalDnothing can be said
 - Question 2 - Select One
In photoelectric effect experiment, the slope of the graph of the stopping potential versus frequency gives the value of :
AheBhCehDhce
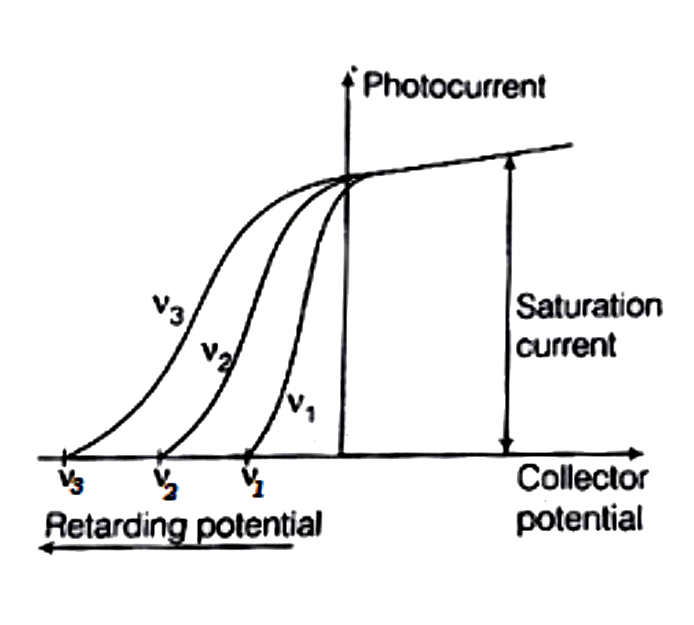
The variation of photocurrent with collector potential for different frequencies of incident radiation v1,v2,v3 is as shown in the the graph , then
 View Solution
The graph shows variation of stopping potential V0 versus frequency of incident radiation v for two photosensitive metals A and B. Which of two metals has higher threshold frequency and why?
 View Solution
When a high frequency electromagnetic radiation is incident on a metallic surface, electrons are emitted from the surface. Energy of emitted photoelectrons depends only on the frequency of incident electromagnetic radiation and the number of emitted electrons depends only on the intensity of incident light.
Einstein's protoelectron equation [Kmax=hv−ϕ] correctly ecplains the PE, where υ= frequency of incident light and ϕ= work function.
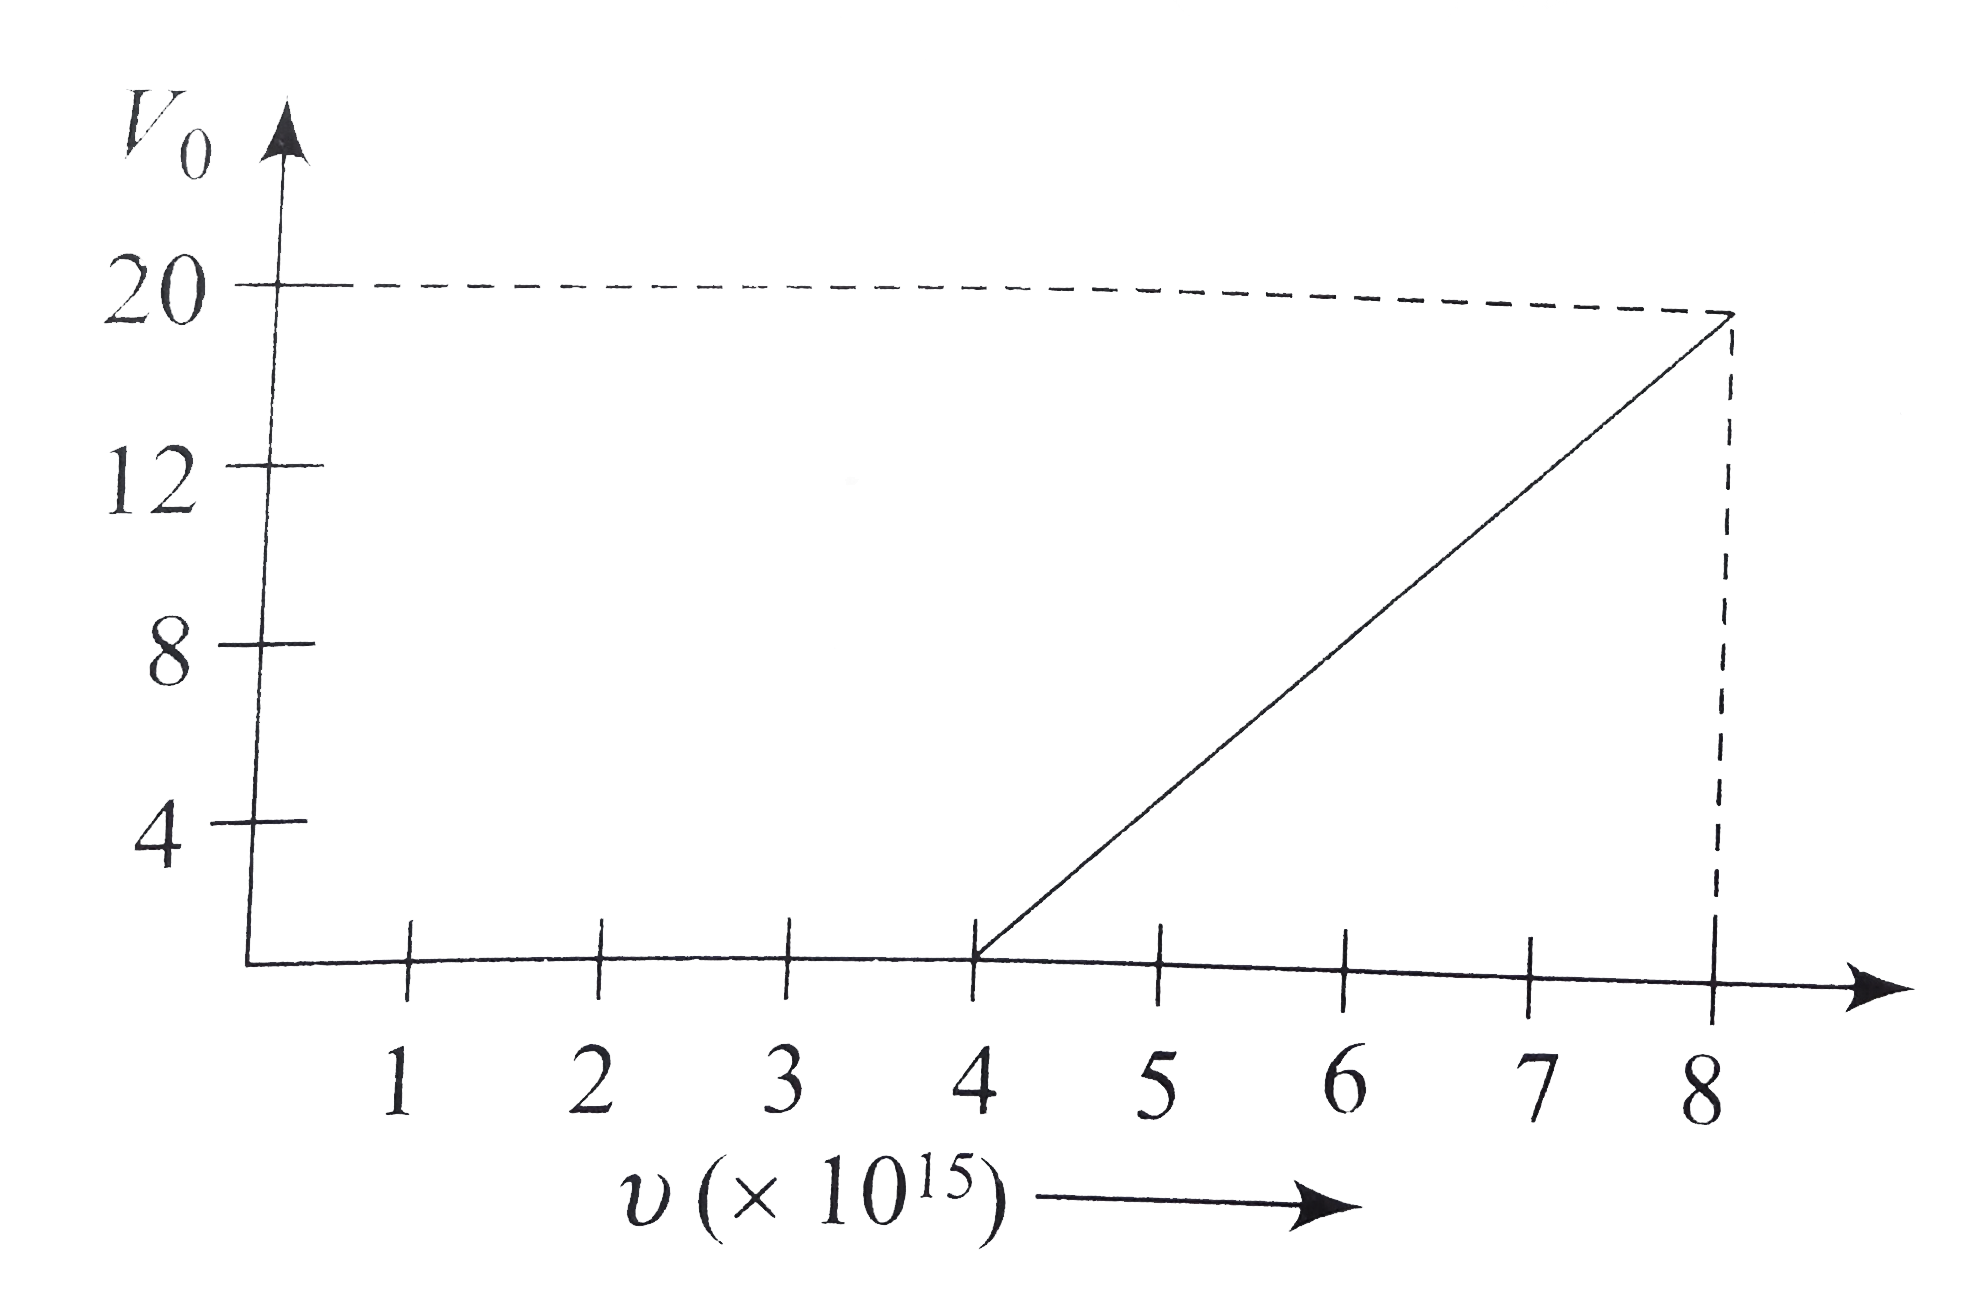
Q. For photoelectric effect in a metal, the graph of the stopping potential V0 (in volt) versus frequency υ (in hertz) of the incident radiation is shown in Fig. The work function of the metal (in eV) is.View SolutionExplain giving reasons for the following :
(a) Photoelectric current in a photocell increases with the increase in intensity of the incident radiation.
(b) The stopping potential V0 varies linearly with the frequency ν of the incident radiation for a given photosensitive surface with the slope remaining the same for different surfaces.
(c) Maximum kinetic energy of the photoelectrons is independent of the intensity of incident radiation.View SolutionIn photoelectric effect the slope of straight line graph between stopping potential (Vs) and frequency of incident light (v) gives
 View Solution
State Ohm's law. Draw a labelled circuit diagram to verify this law in the laboratory. If you draw a graph between the potential difference and current flowing through a metallic conductor, what kind of curve will you get? Explain how would you use this graph to determine the resistance of the conductor.
View Solution

