Following graph is constructed for the fixed amount of the gas
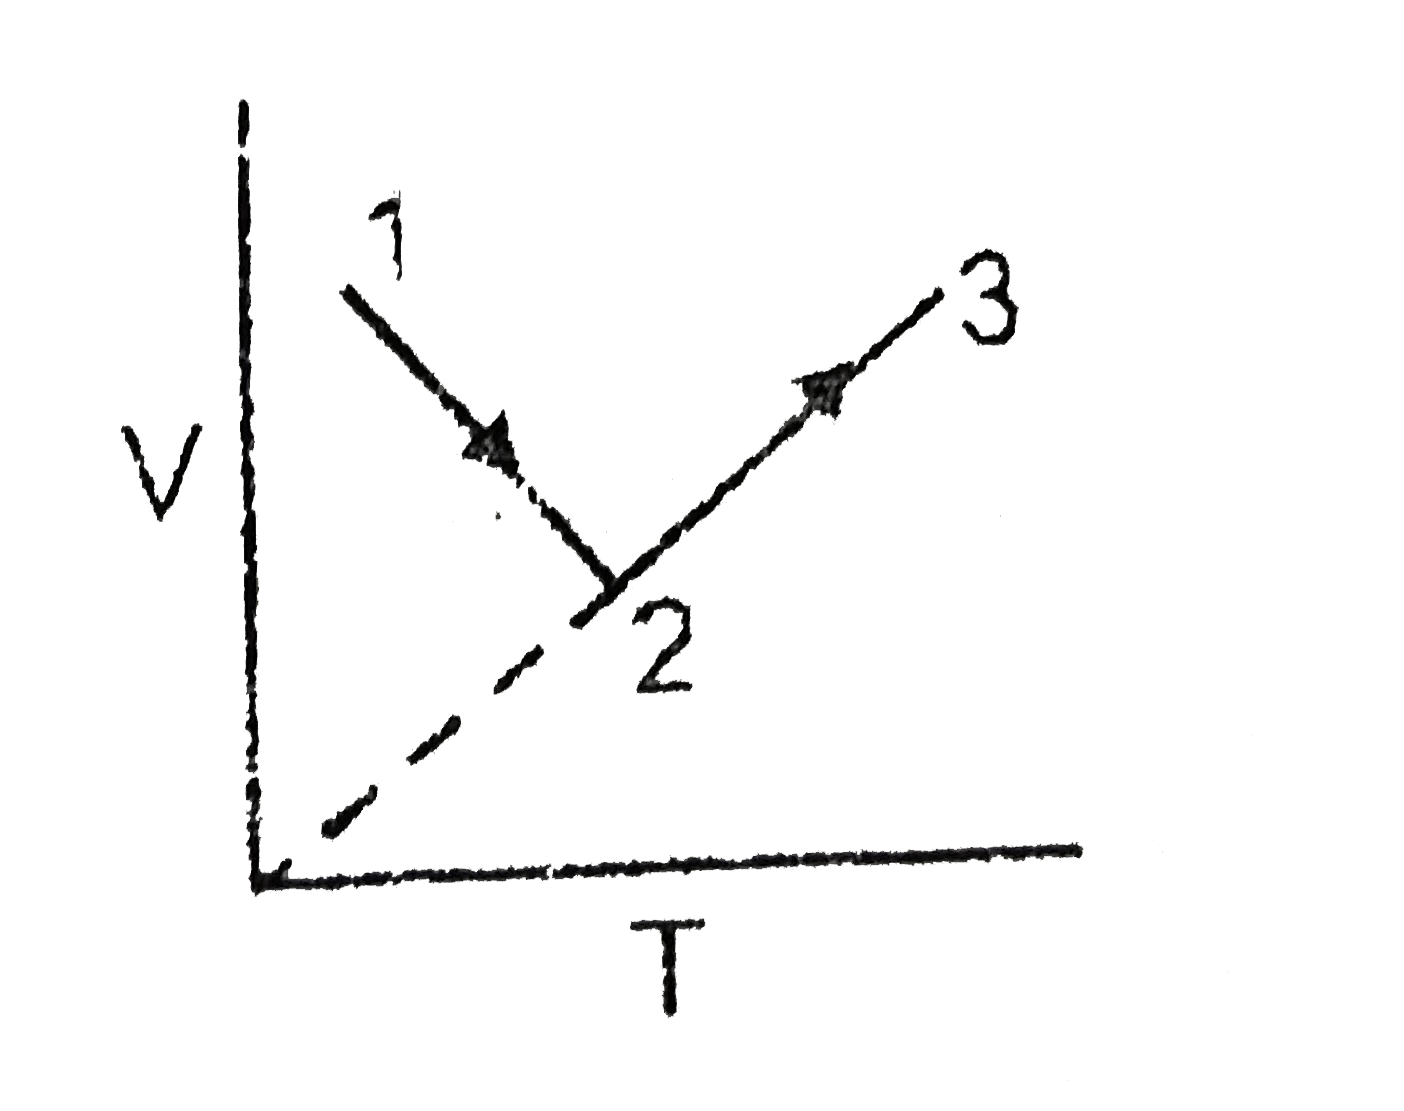
From 1−2 pressure will increase
From 2−3 pressure remains constant
Gas pressure at (3) greater at state (1)
From 1−2 pressure will decrease
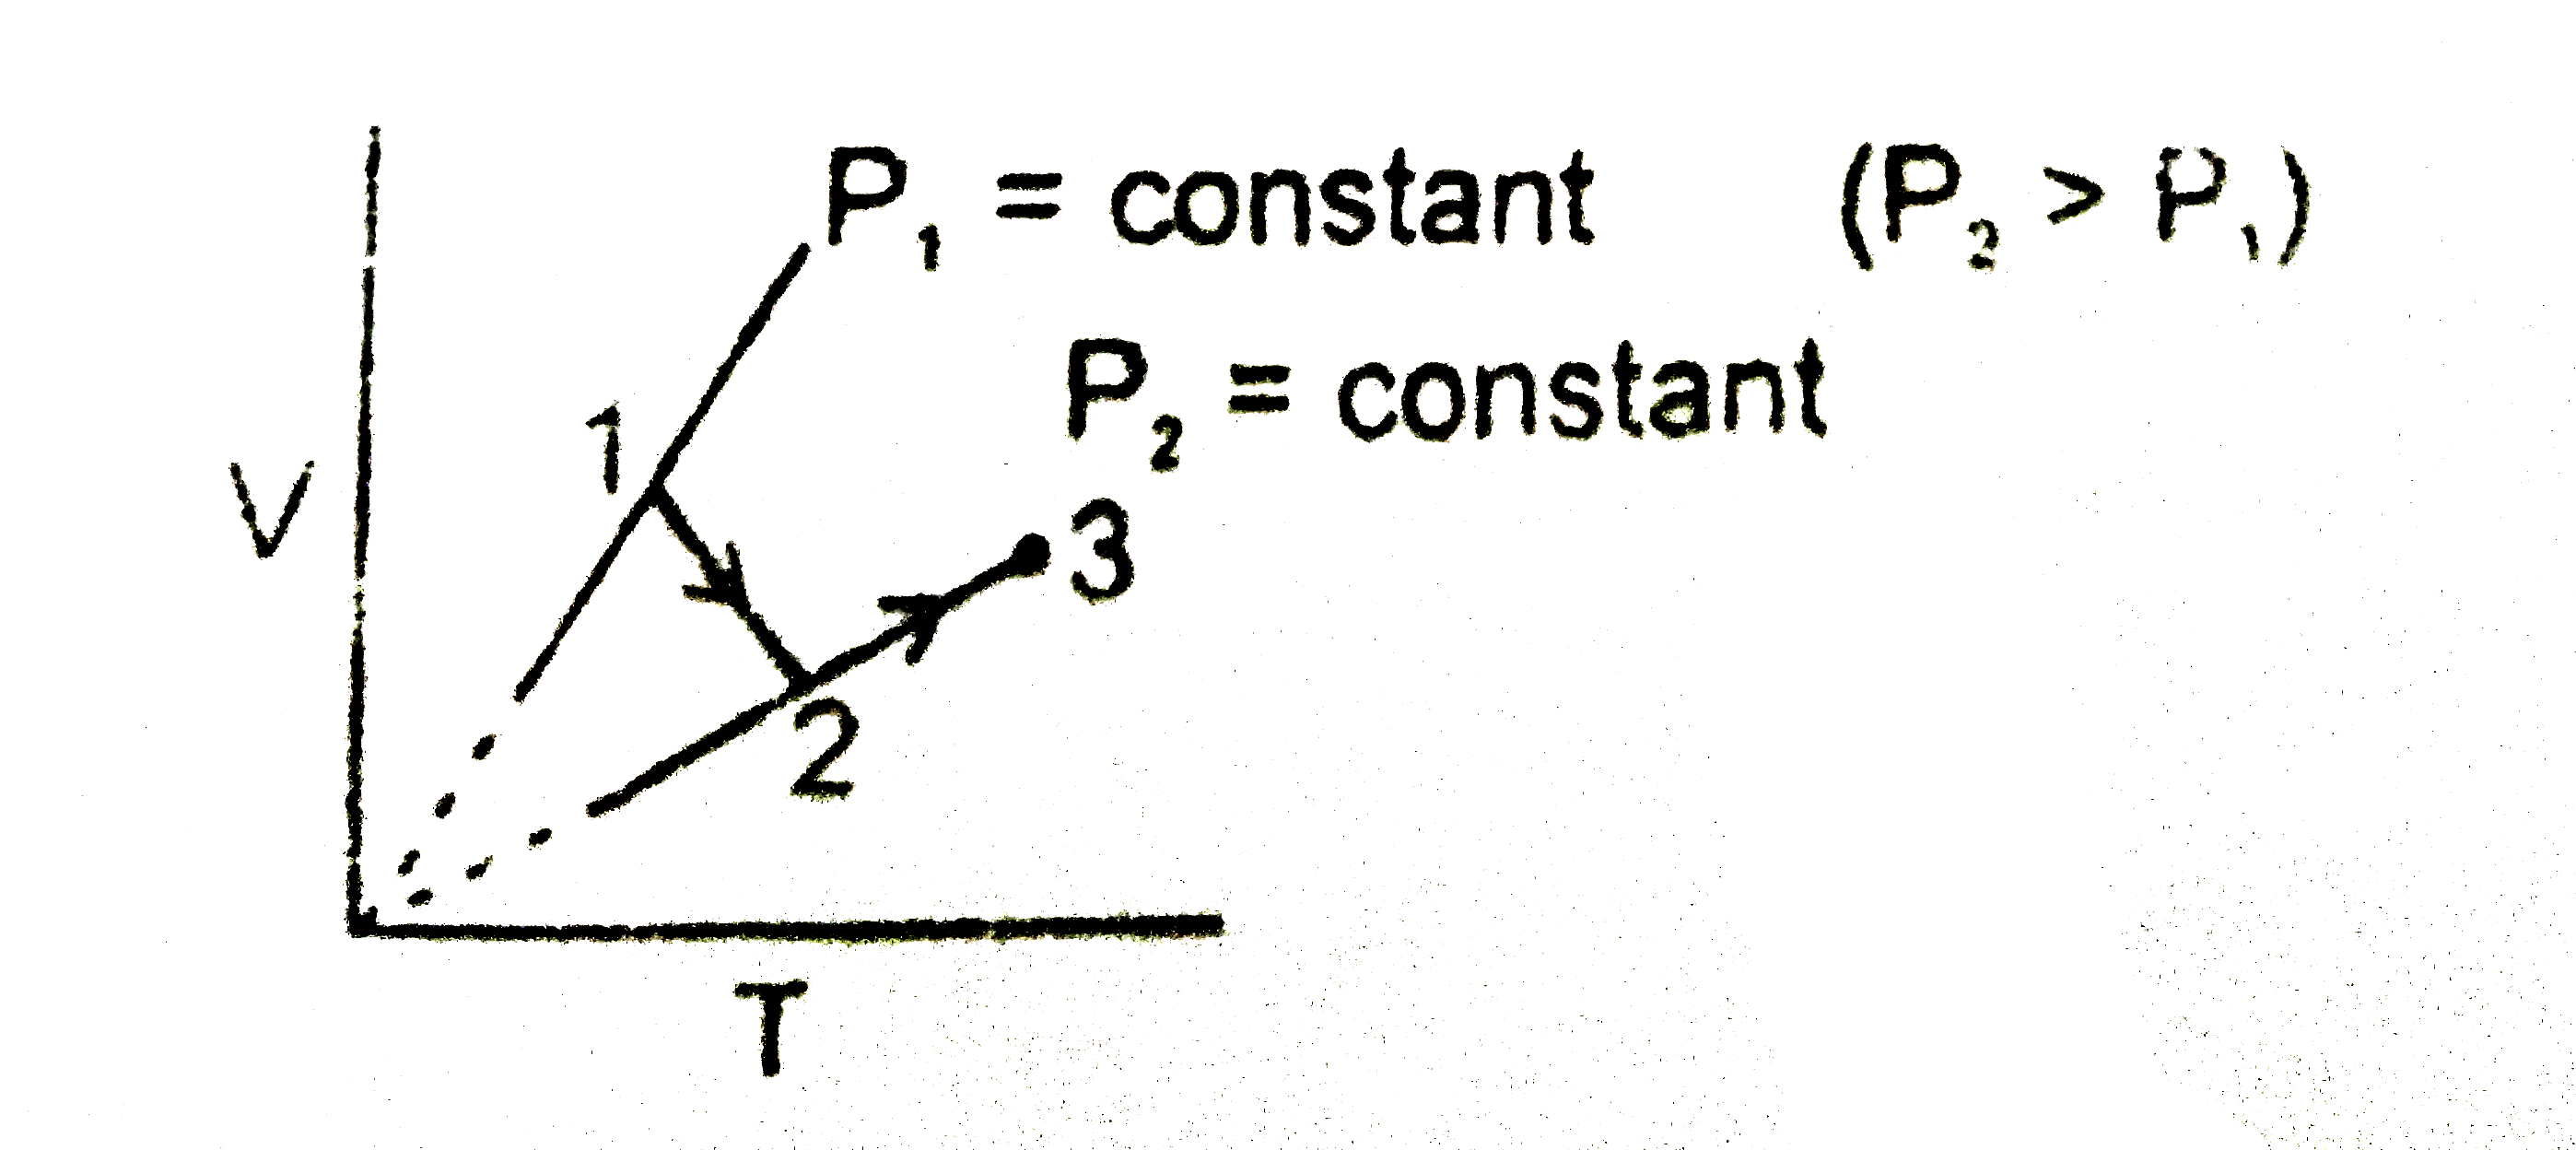
The correct Answer is:A, B, C
V−T curve for a given mass of the gas is given
PV=nRT,V=(nRP)T
Topper's Solved these Questions
- BOOK - RESONANCE ENGLISHCHAPTER - THERMODYNAMICSEXERCISE - Exercise-2 part -IV : Comprehension11videos
THERMODYNAMICS
- BOOK - RESONANCE ENGLISHCHAPTER - THERMODYNAMICSEXERCISE - Exercise-3 Part-1: JEE (ADVANCED)11videos
THERMODYNAMICS
- BOOK - RESONANCE ENGLISHCHAPTER - THERMODYNAMICSEXERCISE - Exercise-2 II: Single and double value integer type16videos
THERMODYNAMICS
- BOOK - RESONANCE ENGLISHCHAPTER - TEST SERIESEXERCISE - CHEMISTRY50videos
TEST SERIES
Similar Questions
When a sample of ideal gas is changed from an initial state to a final state, various curves can be plotted for the process like P-V curve, V-T curve,P-T curve etc.
For example, P-V curve for a fixed amount of an ideal gas at constant temperature is a rectangular hyperbola, V-T curve for a fixed amount of an ideal gas at constant volume is again a straight line. However, the shapes may vary if the constant parameters are also changed.
Now, answer the following questions :
Which of the following graphs is not possible for a fixed amount of ideal gas upon moving from initial state A to final state B :View SolutionWhich of the following curve is correct for a given amount of an ideal gas at constant pressure?
View Solution
Knowledge Check
- Question 1 - Select One
Which of the following graphs represent the behaviour of an ideal gas ?
A1.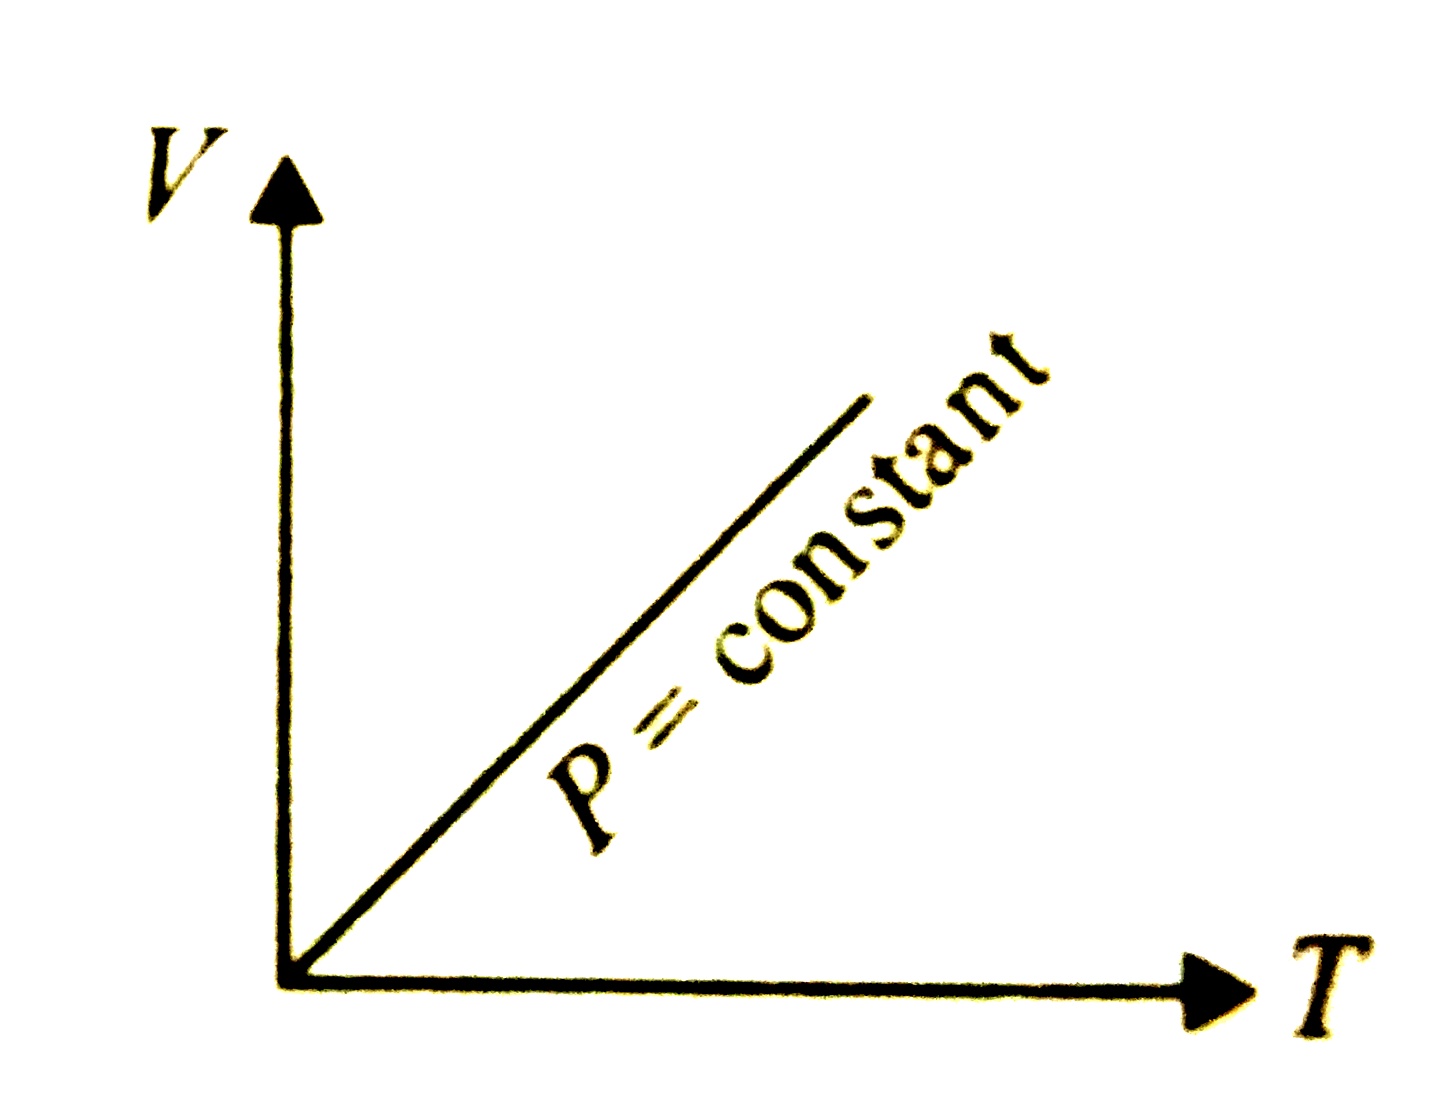 B2.
B2.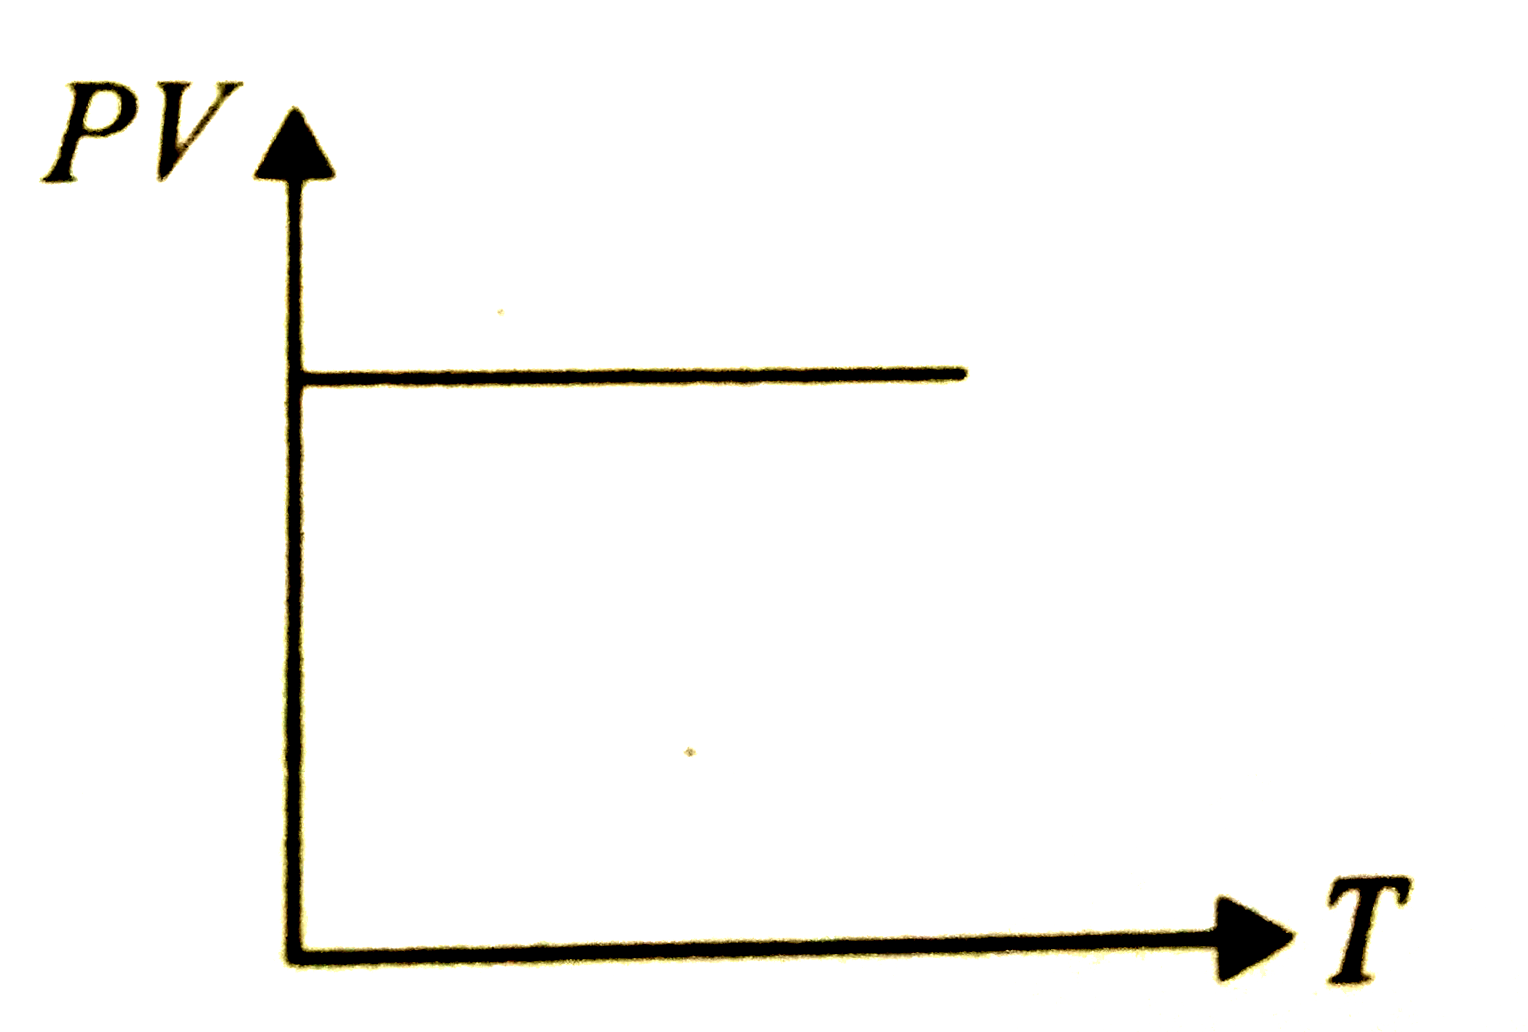 C3.
C3.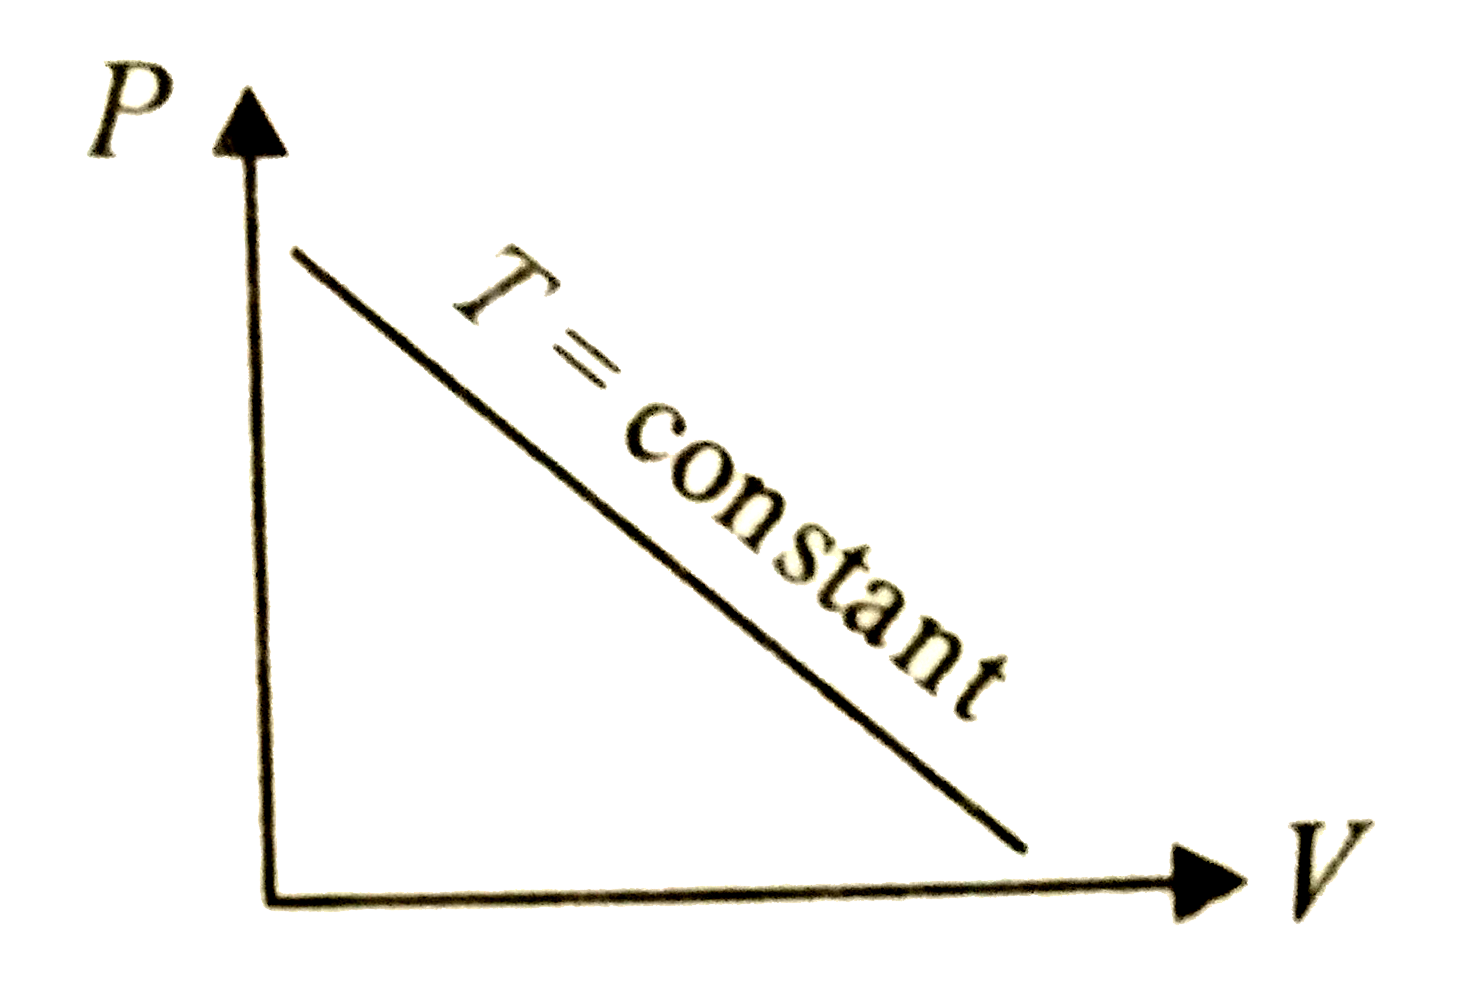 D4.
D4.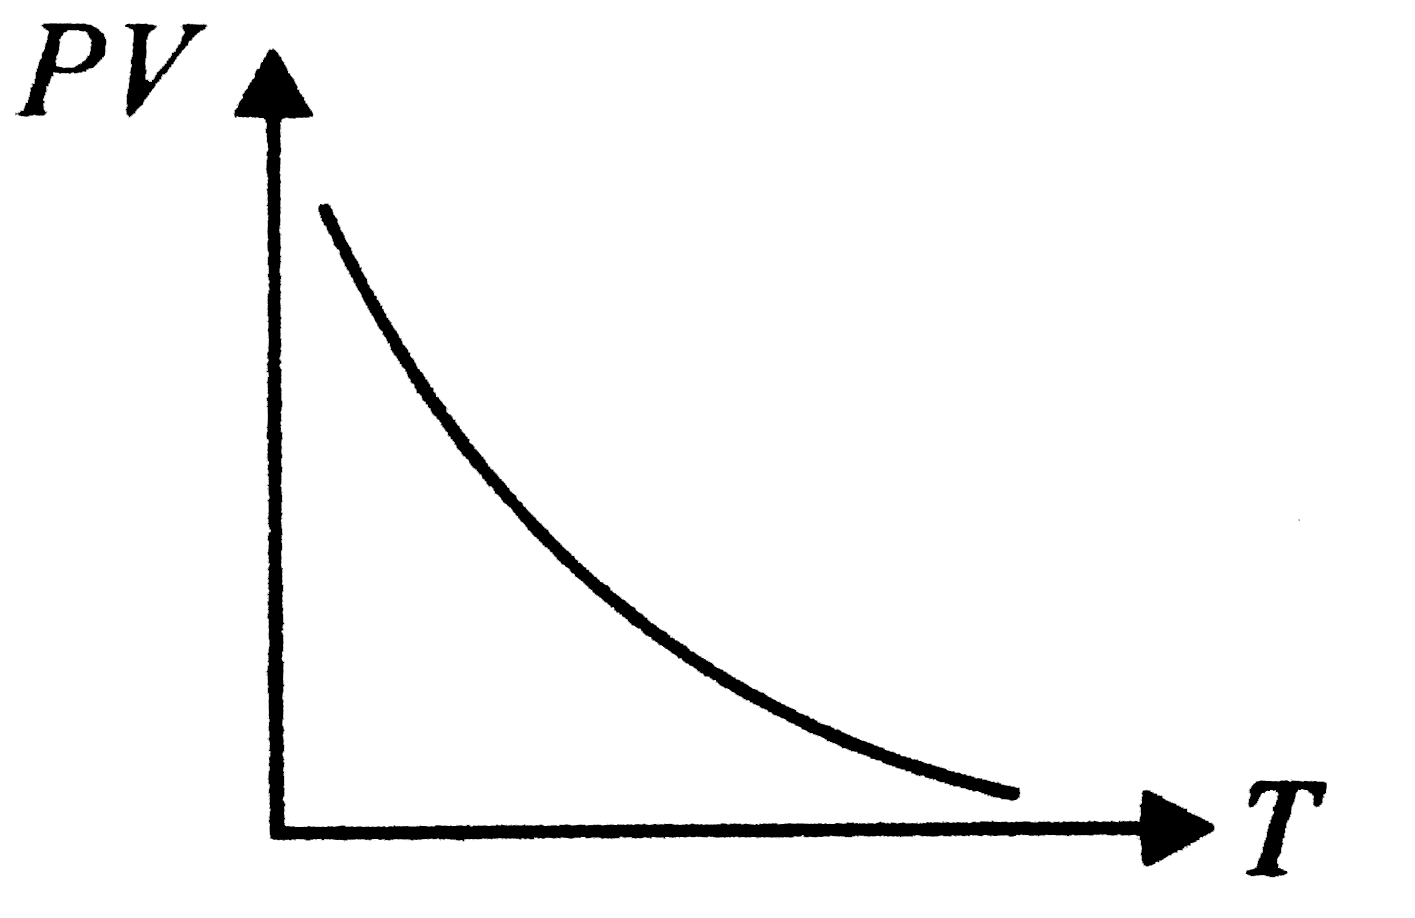
- Question 2 - Select One
Which of the following graphs shows the relative change in the amount of mitochondrial DNA of a cell undergoing mitosis?
A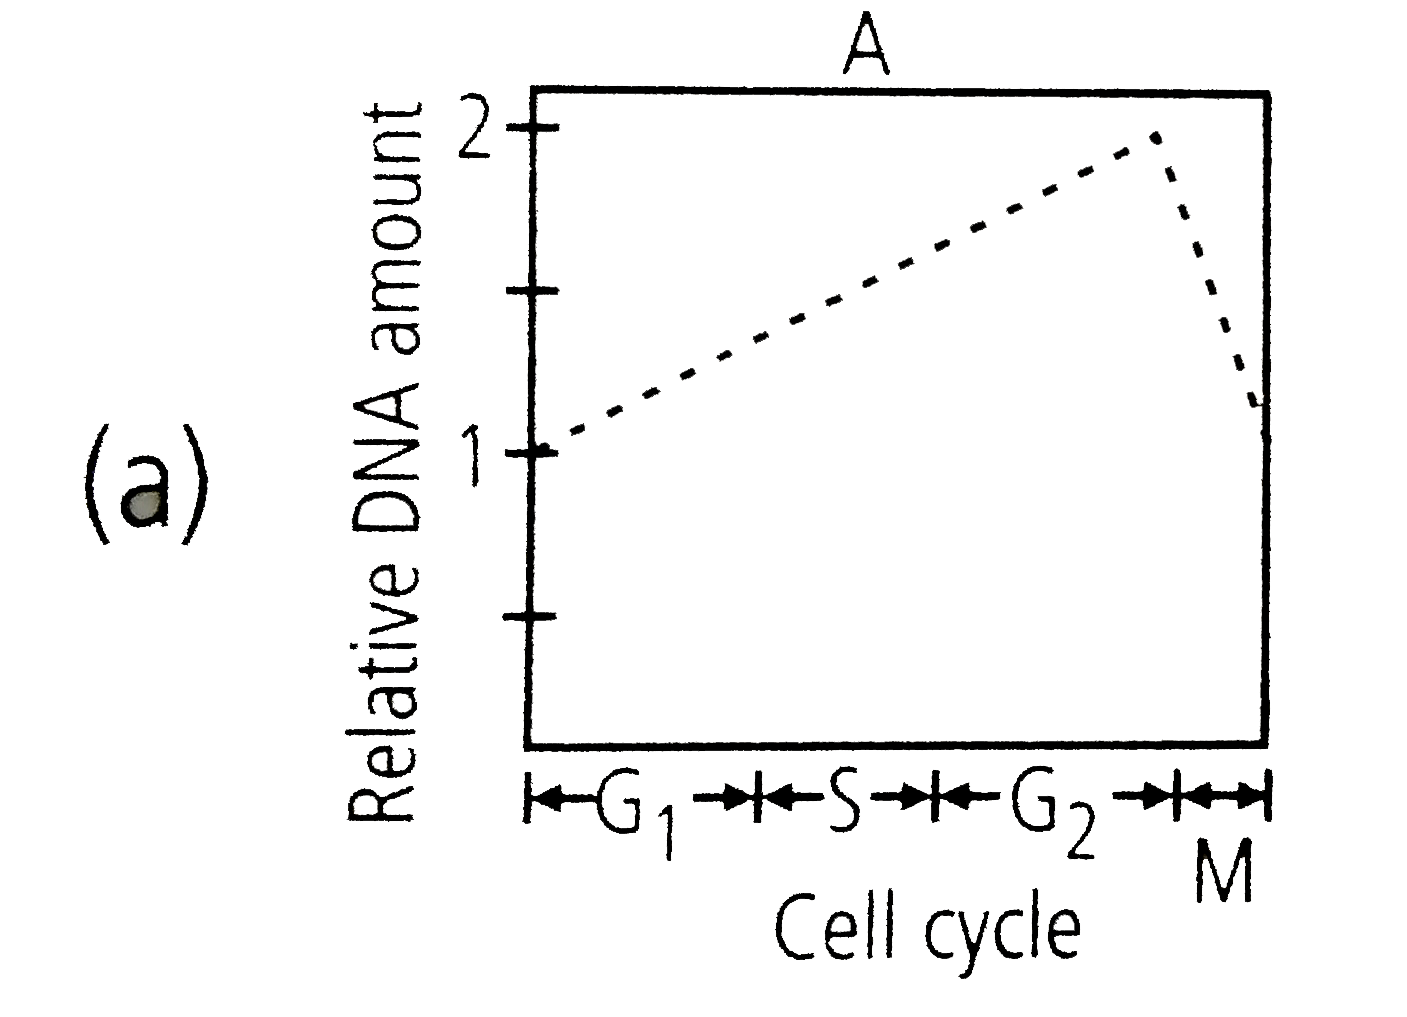 B
B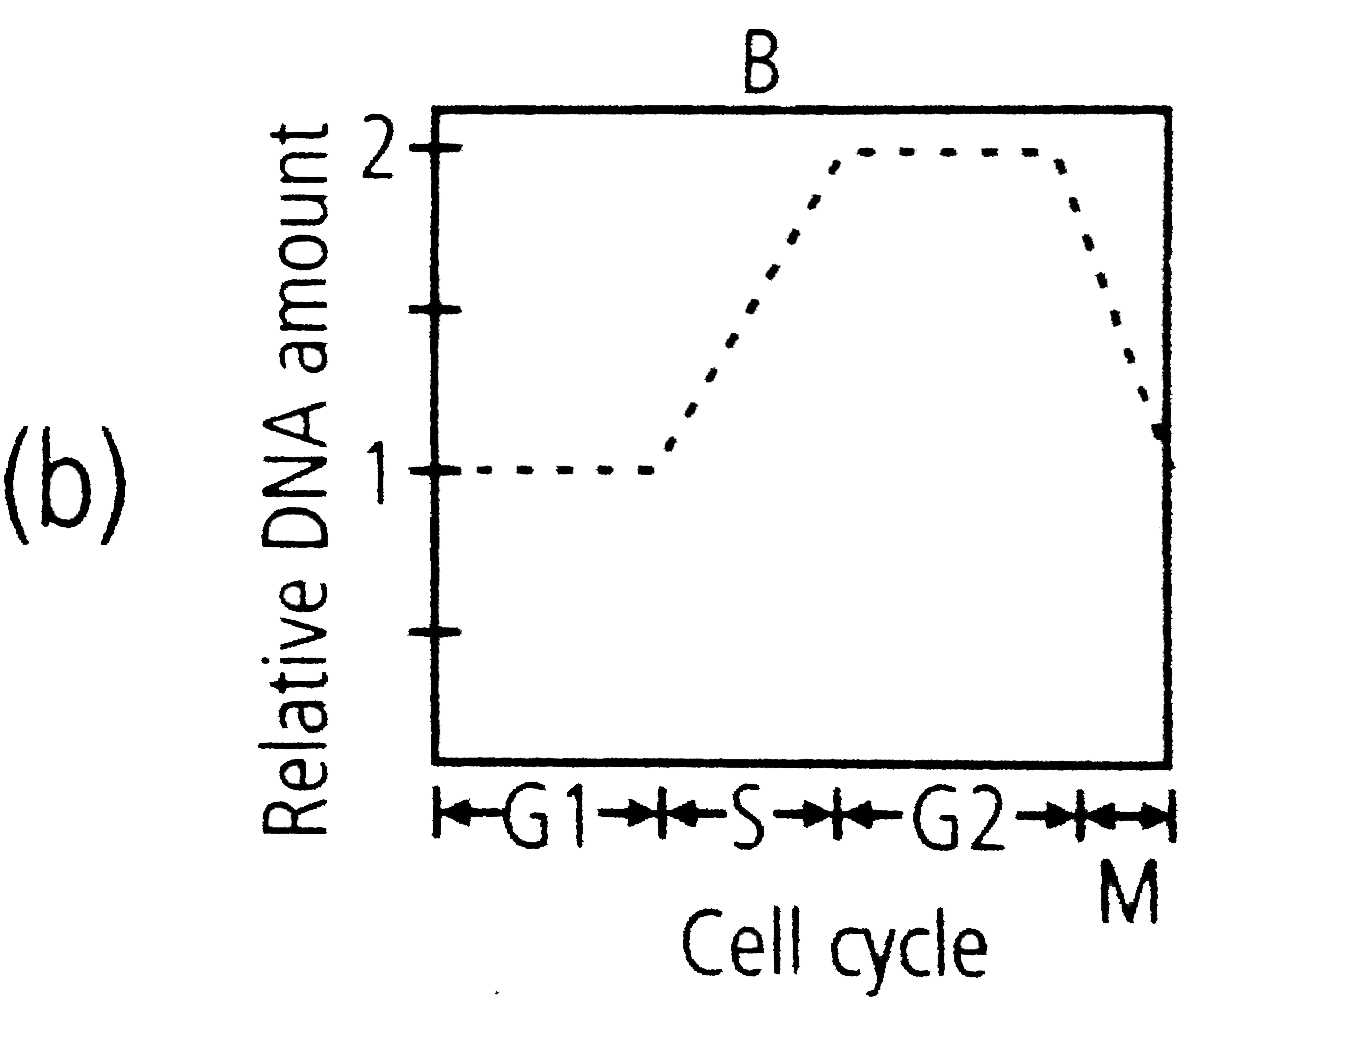 C
C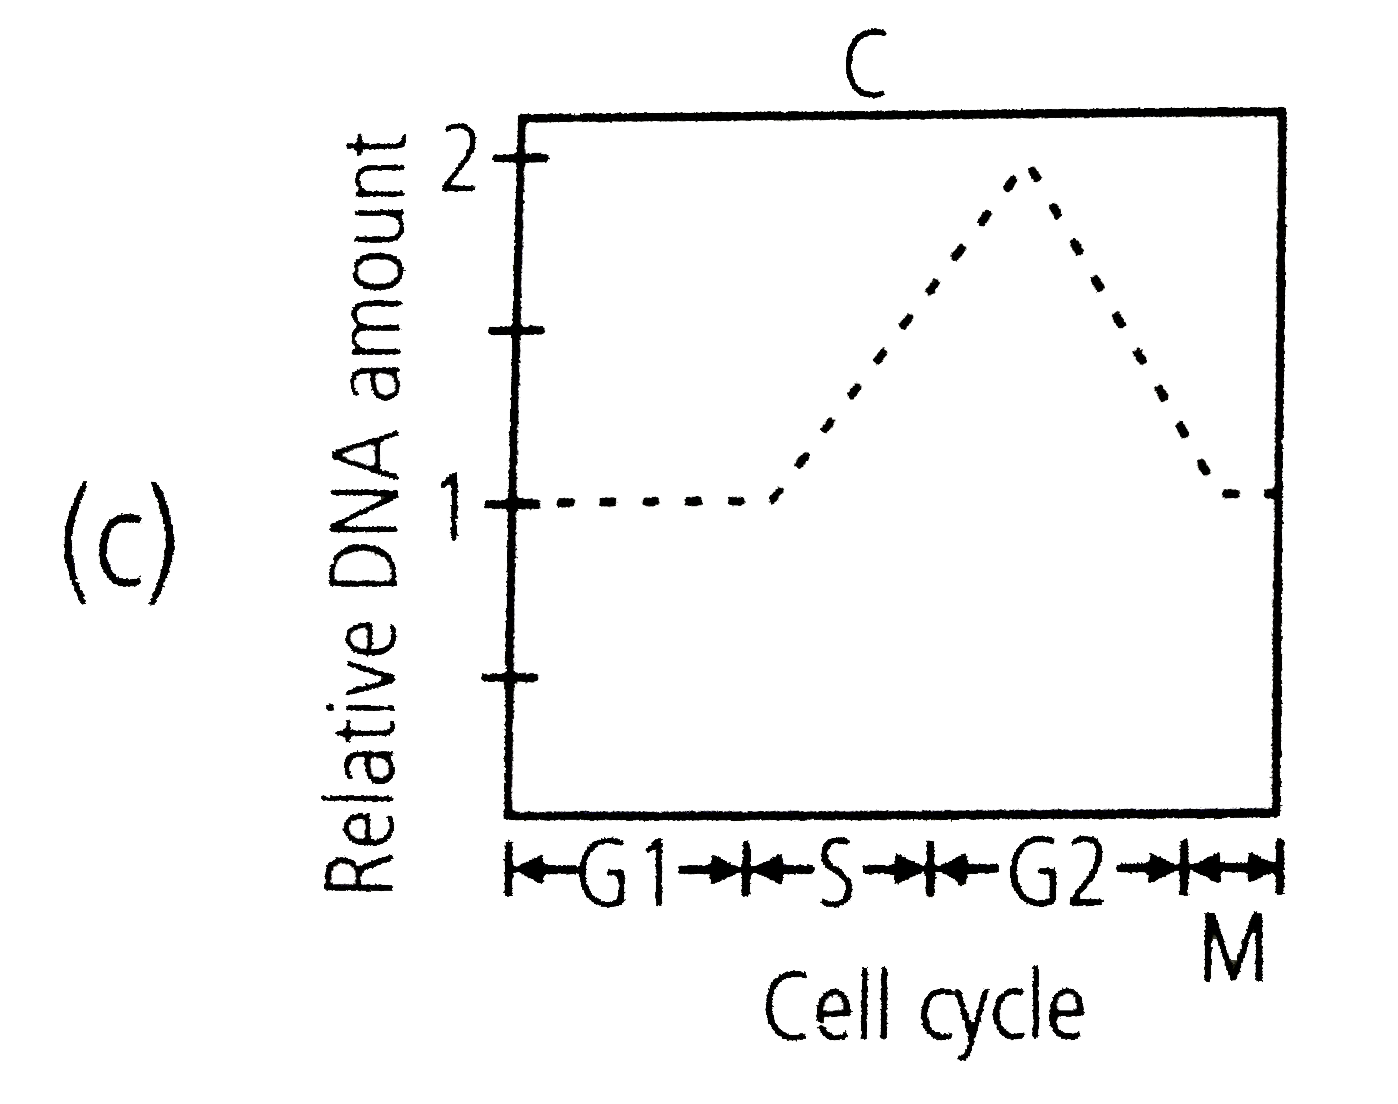 D
D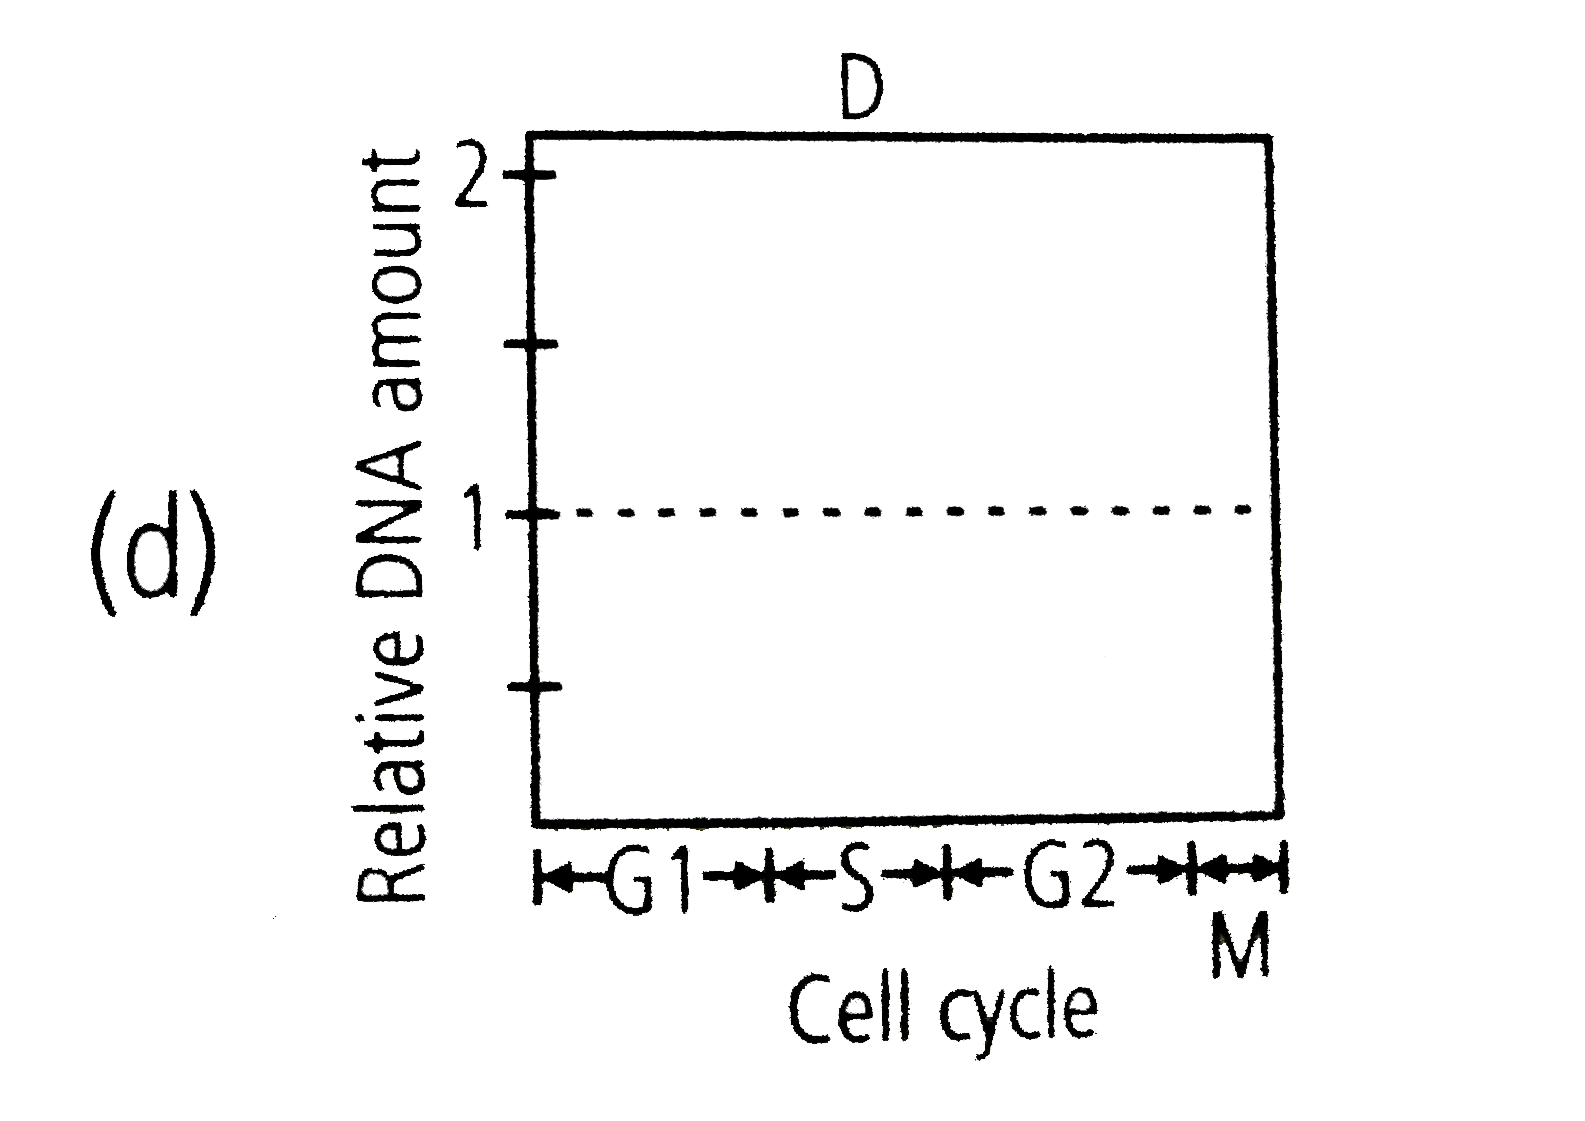
Which of the following is a correct plot of the volume of fixed amount of ideal gas as a function of temperature (at constant pressure)
View SolutionWhich of the following graphs give a straight lines for the given properties of an ideal gas
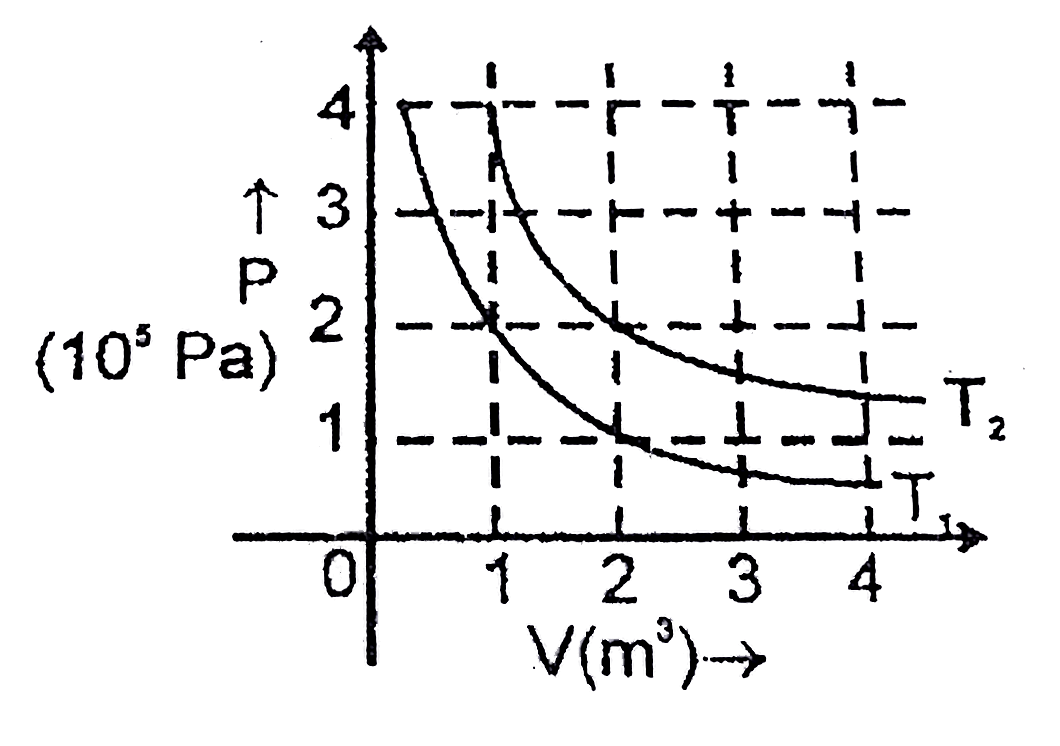
View SolutionThe following graphs shows two isotherms for a fixed mass of an ideal gas. Find the ratio of r.m.s speed of the molecules at tempertaures T1 and T2?
 View Solution
Following graphs shows the variation in the intensity of heat radiations by the the black body and frequency at a fixed temperature . Choose the correct option.
View SolutionDraw a graph of logP and log(1/V) for a fixed amount of gas at constant temperature.
View SolutionDraw a graph of log P vs log (1/V) for a fixed amount of a gas at constant temperature.
View Solution

