What is the type of graph between log P and log(1V) at constant temperature for a given amount of gas ?
To determine the type of graph between log P and log (1/V) at constant temperature for a given amount of gas, we can follow these steps:
Step 1: Start with the Ideal Gas Law
The ideal gas equation is given by:
PV=nRT
where:
- P = pressure
- V = volume
- n = number of moles of gas (constant)
- R = universal gas constant (constant)
- T = temperature (constant)
Step 2: Rearrange the Equation
Since temperature and the amount of gas are constant, we can express the equation as:
PV=λ
where λ=nRT is a constant.
Step 3: Solve for Pressure (P)
From the rearranged equation, we can express pressure P in terms of volume V:
P=λV
Step 4: Take the Logarithm of Both Sides
Taking the logarithm of both sides gives us:
logP=log(λV)
Using the properties of logarithms, we can separate this into:
logP=logλ−logV
Step 5: Rearrange the Equation
This can be rewritten as:
logP=−logV+logλ
or
logP=logλ−logV
Step 6: Substitute for log (1/V)
Since log(1/V)=−logV, we can rewrite the equation as:
logP=logλ+log(1/V)
Step 7: Identify the Linear Relationship
This equation can be compared to the linear equation Y=MX+C, where:
- Y=logP
- X=log(1/V)
- M=1 (the slope)
- C=logλ (the y-intercept)
Step 8: Conclusion about the Graph
The graph of logP (y-axis) versus log(1/V) (x-axis) is a straight line with:
- A slope of 1
- A y-intercept of logλ
Final Answer
The type of graph between logP and log(1/V) at constant temperature for a given amount of gas is a straight line with a slope of 1.
---
The ideal gas equation is given by:
PV=nRT
where:
- P = pressure
- V = volume
- n = number of moles of gas (constant)
- R = universal gas constant (constant)
- T = temperature (constant)
Since temperature and the amount of gas are constant, we can express the equation as:
PV=λ
where λ=nRT is a constant.
From the rearranged equation, we can express pressure P in terms of volume V:
P=λV
Taking the logarithm of both sides gives us:
logP=log(λV)
Using the properties of logarithms, we can separate this into:
logP=logλ−logV
This can be rewritten as:
logP=−logV+logλ
or
logP=logλ−logV
Since log(1/V)=−logV, we can rewrite the equation as:
logP=logλ+log(1/V)
This equation can be compared to the linear equation Y=MX+C, where:
- Y=logP
- X=log(1/V)
- M=1 (the slope)
- C=logλ (the y-intercept)
The graph of logP (y-axis) versus log(1/V) (x-axis) is a straight line with:
- A slope of 1
- A y-intercept of logλ
The type of graph between logP and log(1/V) at constant temperature for a given amount of gas is a straight line with a slope of 1.
Topper's Solved these Questions
- STATES OF MATTERBOOK - VMC MODULES ENGLISHCHAPTER - STATES OF MATTEREXERCISE - SOLVED EXAMPLES
20 Videos
- STATES OF MATTERBOOK - VMC MODULES ENGLISHCHAPTER - STATES OF MATTEREXERCISE - PRACTICE EXERCISE-1
3 Videos
- STATES OF MATTERBOOK - VMC MODULES ENGLISHCHAPTER - STATES OF MATTEREXERCISE - JEE-Advanced
78 Videos
- STATES OF MATTERBOOK - VMC MODULES ENGLISHCHAPTER - STATES OF MATTEREXERCISE - IMPECCABLE
50 Videos
- STOICHIOMETRY - IBOOK - VMC MODULES ENGLISHCHAPTER - STOICHIOMETRY - IEXERCISE - JEE Advanced (Archive)
31 Videos
Similar Questions
What is the type of graph between log P and log V at constant temperature?
View SolutionThe slope of the graph between log P and log V at constant temperature for a given mass of gas is
View SolutionWhat is the type of graph that would result between log(V) and log(T) at constant pressure?
View SolutionThe graph betwene P and V at constant temperature should look like
View SolutionWhich of the following shows correct relation between volume and temperature at constant pressure for a given amount of gas
View SolutionDraw a graph of logP and log(1/V) for a fixed amount of gas at constant temperature.
View SolutionFollowing is the graph between logT50 and loga (a= initial concentration) for a given reaction at 27∘C. Hence order is

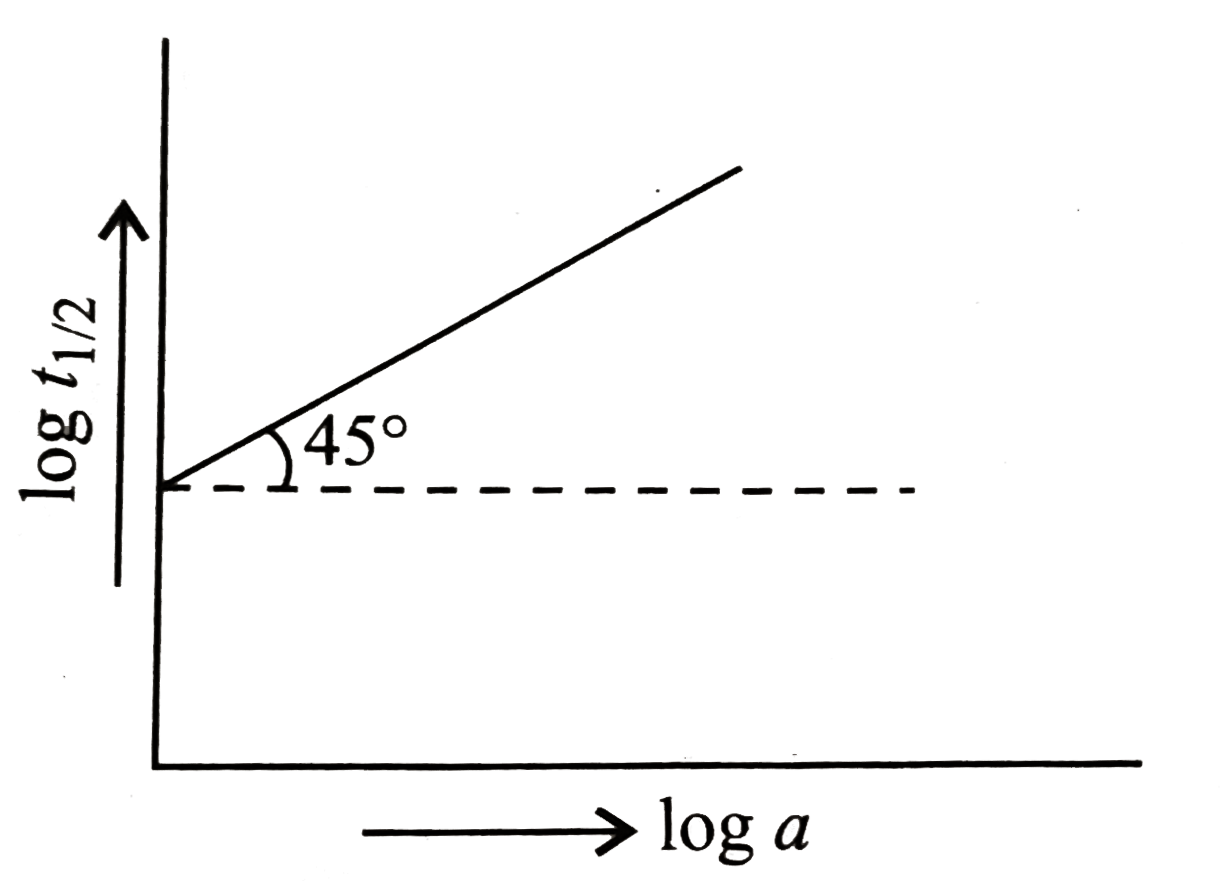
View SolutionFollowing is the graph between logt1/2 and loga (a initial concentration) for a given reaction at 300K

Find the order of reaction.
View SolutionAt constant temperature if a graph plotted between logP and log(1V) has an intercept of unity then what will be the value of constant (k)
View SolutionGraph between speed v of sound in air and pressure P at a constant temperature is given by
View Solution
