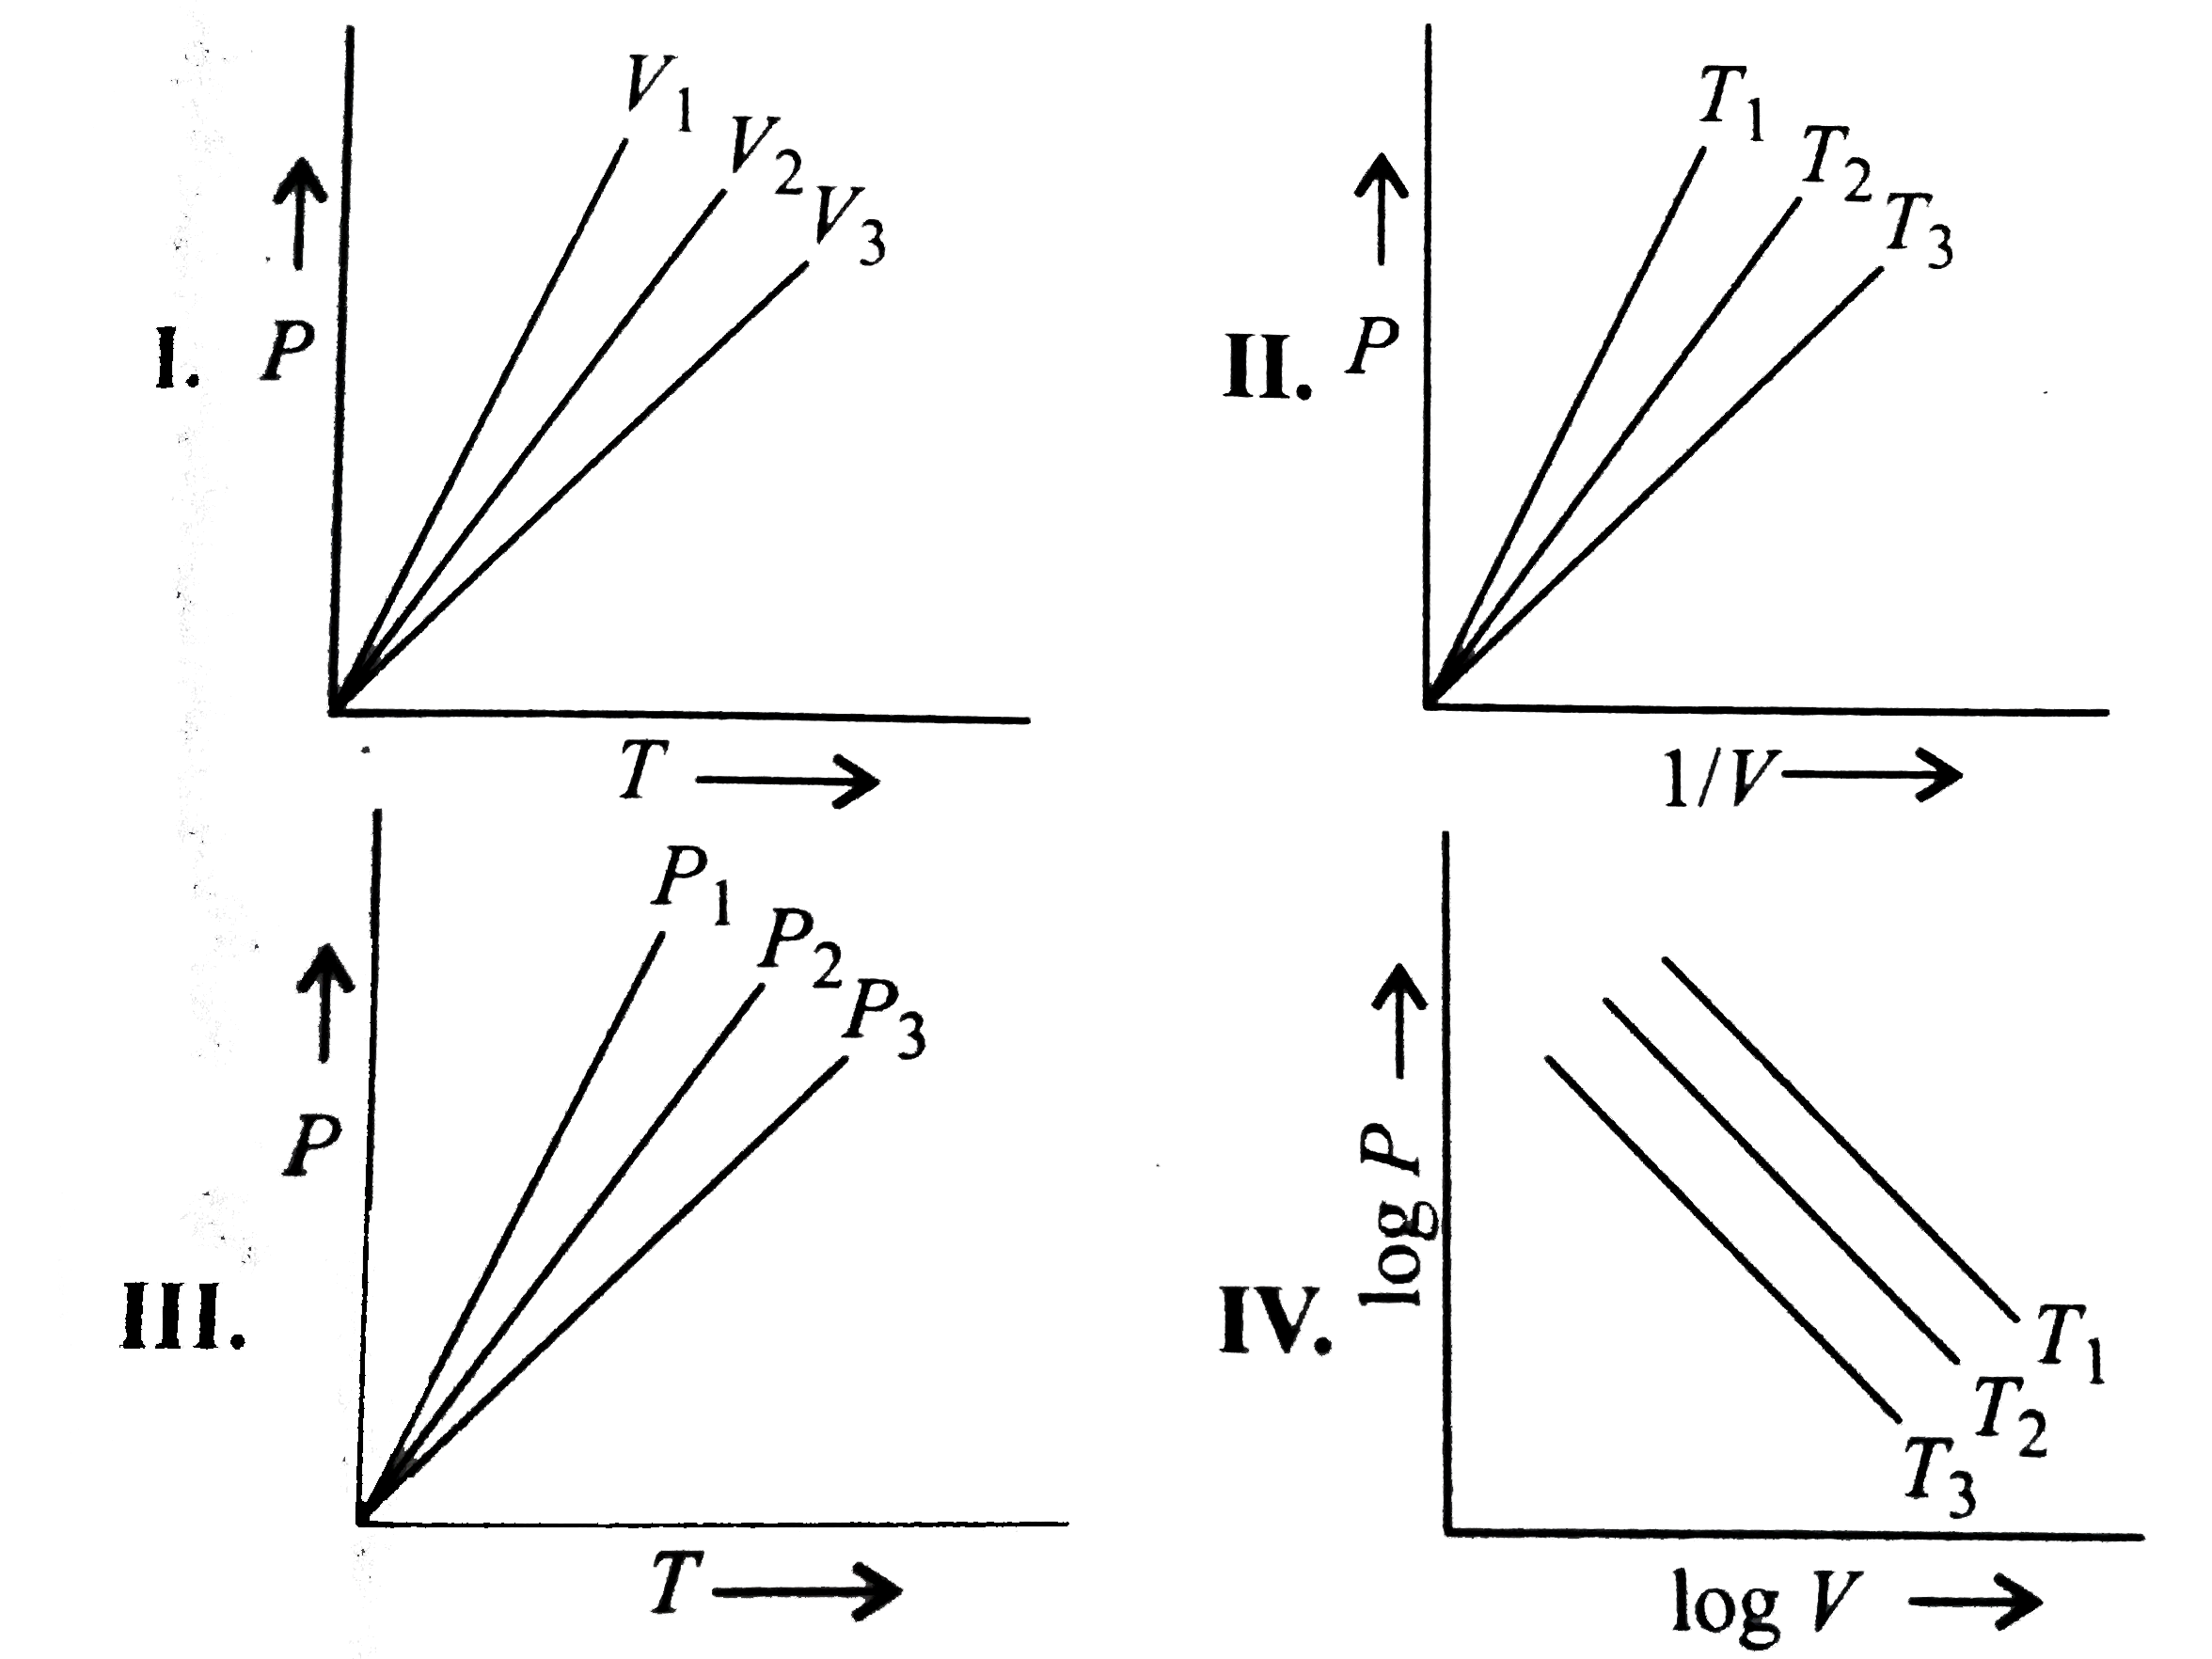
For 1mol of an ideal gas, V1>V2>V3 in fig. (I),T1>T2>T3 in fig. (II), P1>P2>P3 in fig. (III), and T1>T2>T3 in fig. (IV) , then which curves are correct.
I,II
I,II,III
II,IV
I,III,IV
PV=RT if P1>P2, V1<V2.
Also logP=−logV+logRT
Topper's Solved these Questions
- STATES OF MATTERBOOK - CENGAGE CHEMISTRY ENGLISHCHAPTER - STATES OF MATTEREXERCISE - Exercises (Assertion-Reasoning)
24 Videos
- STATES OF MATTERBOOK - CENGAGE CHEMISTRY ENGLISHCHAPTER - STATES OF MATTEREXERCISE - Exercises (Integer)
10 Videos
- STATES OF MATTERBOOK - CENGAGE CHEMISTRY ENGLISHCHAPTER - STATES OF MATTEREXERCISE - Exercises (Multiple Correcttype)
32 Videos
- SOME BASIC CONCEPTS AND MOLE CONCEPTBOOK - CENGAGE CHEMISTRY ENGLISHCHAPTER - SOME BASIC CONCEPTS AND MOLE CONCEPTEXERCISE - Archives Subjective
11 Videos
- STOICHIOMETRYBOOK - CENGAGE CHEMISTRY ENGLISHCHAPTER - STOICHIOMETRYEXERCISE - Archives Subjective
33 Videos
Similar Questions
Examine the following plots and predict whether in (i) P1<P2andT1>T2 , in (ii) T1=T2<T3, in (iii) V1>V2,in(iv)P1>P2orP2>P1
_E01_267_Q01.png)
View SolutionLeta1>a2>a3>...>an>1.
p1>p2>p3>...>pn>0 such that p1+p2+p3+...+pn=1.
Also, F(x)=(p1ax1+pnaxn)1/x.
limx→0+F(x) equals
View SolutionIf for a sequence (Tn),(i)Sn=2n2+3n+1(ii)Sn=2(3n−1) find Tn and hence T1 and T2
View SolutionA tank full of water has a small hole at its bottom. Let t1 be the time taken to empty first one third of the tank and t2 be the time taken to empty second one third of the tank and t3 be the time taken to empty rest of the tank then
(a). t1=t2=t3
(b). t1>t2>t3
(c). t1<t2<t3
(d). t1>t2<t3
View SolutionThe % yield of ammonia as a function of time in the reaction, N2(g)+3H2(g)⇔2NH3(g)'ΔH<0
at (p,T1) is given below
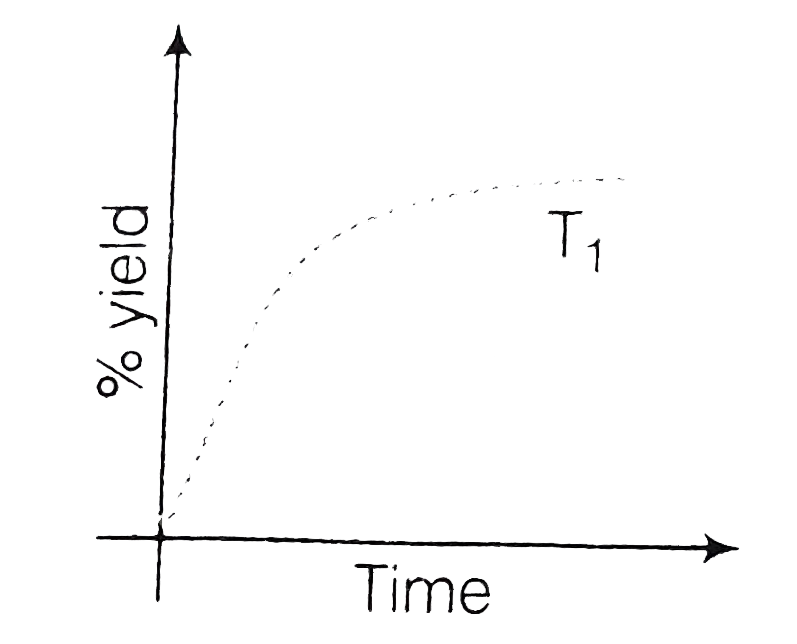
If this reaction is conducted at (p,T1), with T2>T1 the % yield by of ammonia as a function of time is represented by
View SolutionThe activity of a sample of radioactive material is A1 at time t1andA2 at time t2(t2>t1). It mean life is T .
View SolutionV vs T curves at constant pressure P1 and P2 for an ideal gas are shown below
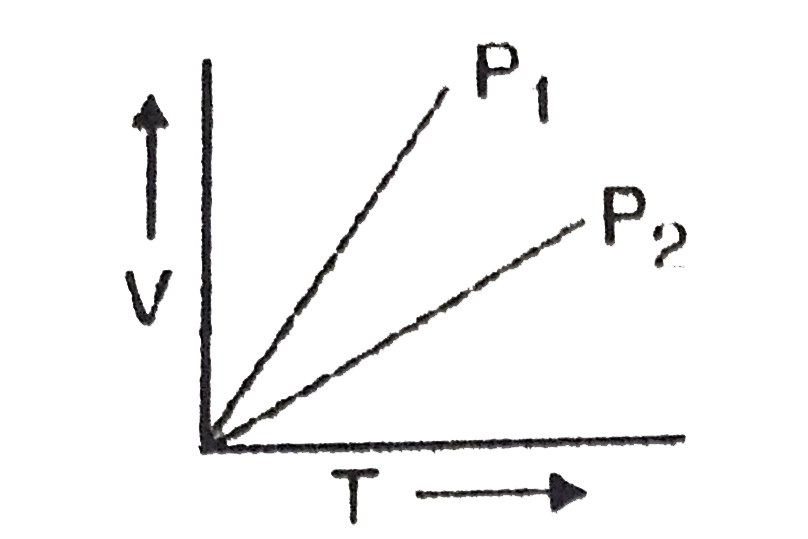
Which is correct ?
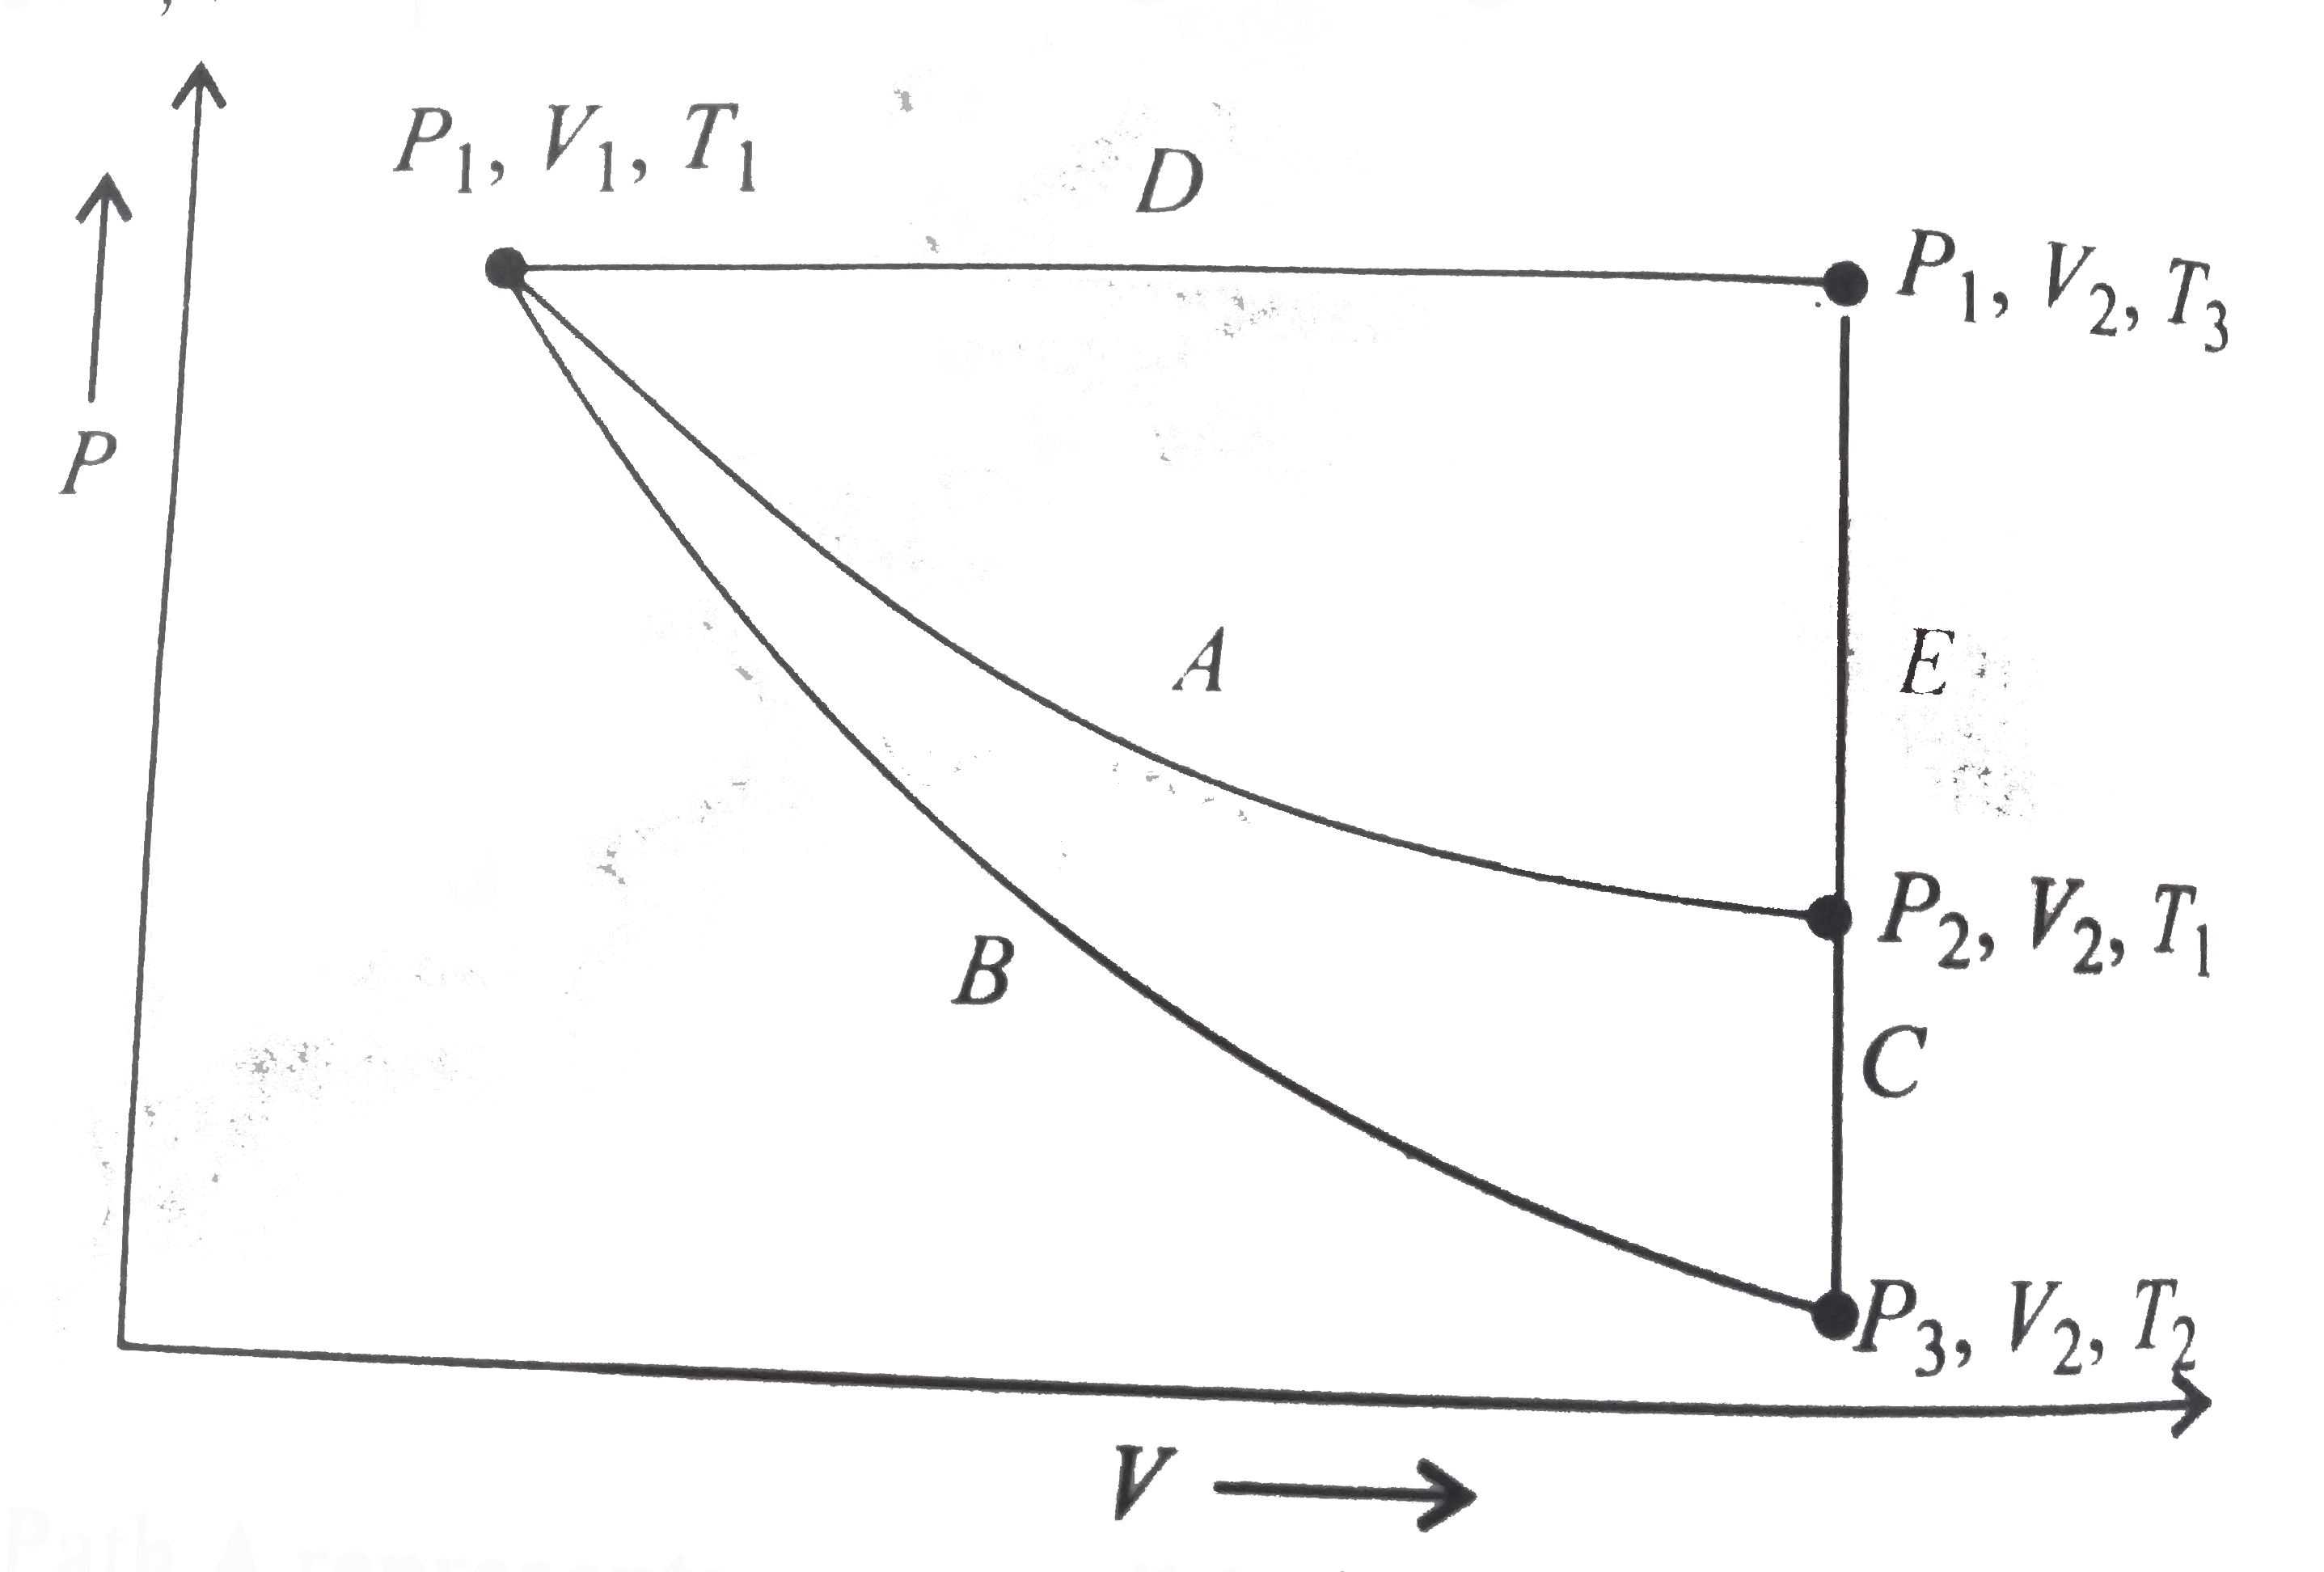
View SolutionFor an ideal gas, an illustratio of three different paths A(B+C) and (D+E) from an initial state P1,V1,T1 to a final state P2,V2,T1 is shown in the given figure.
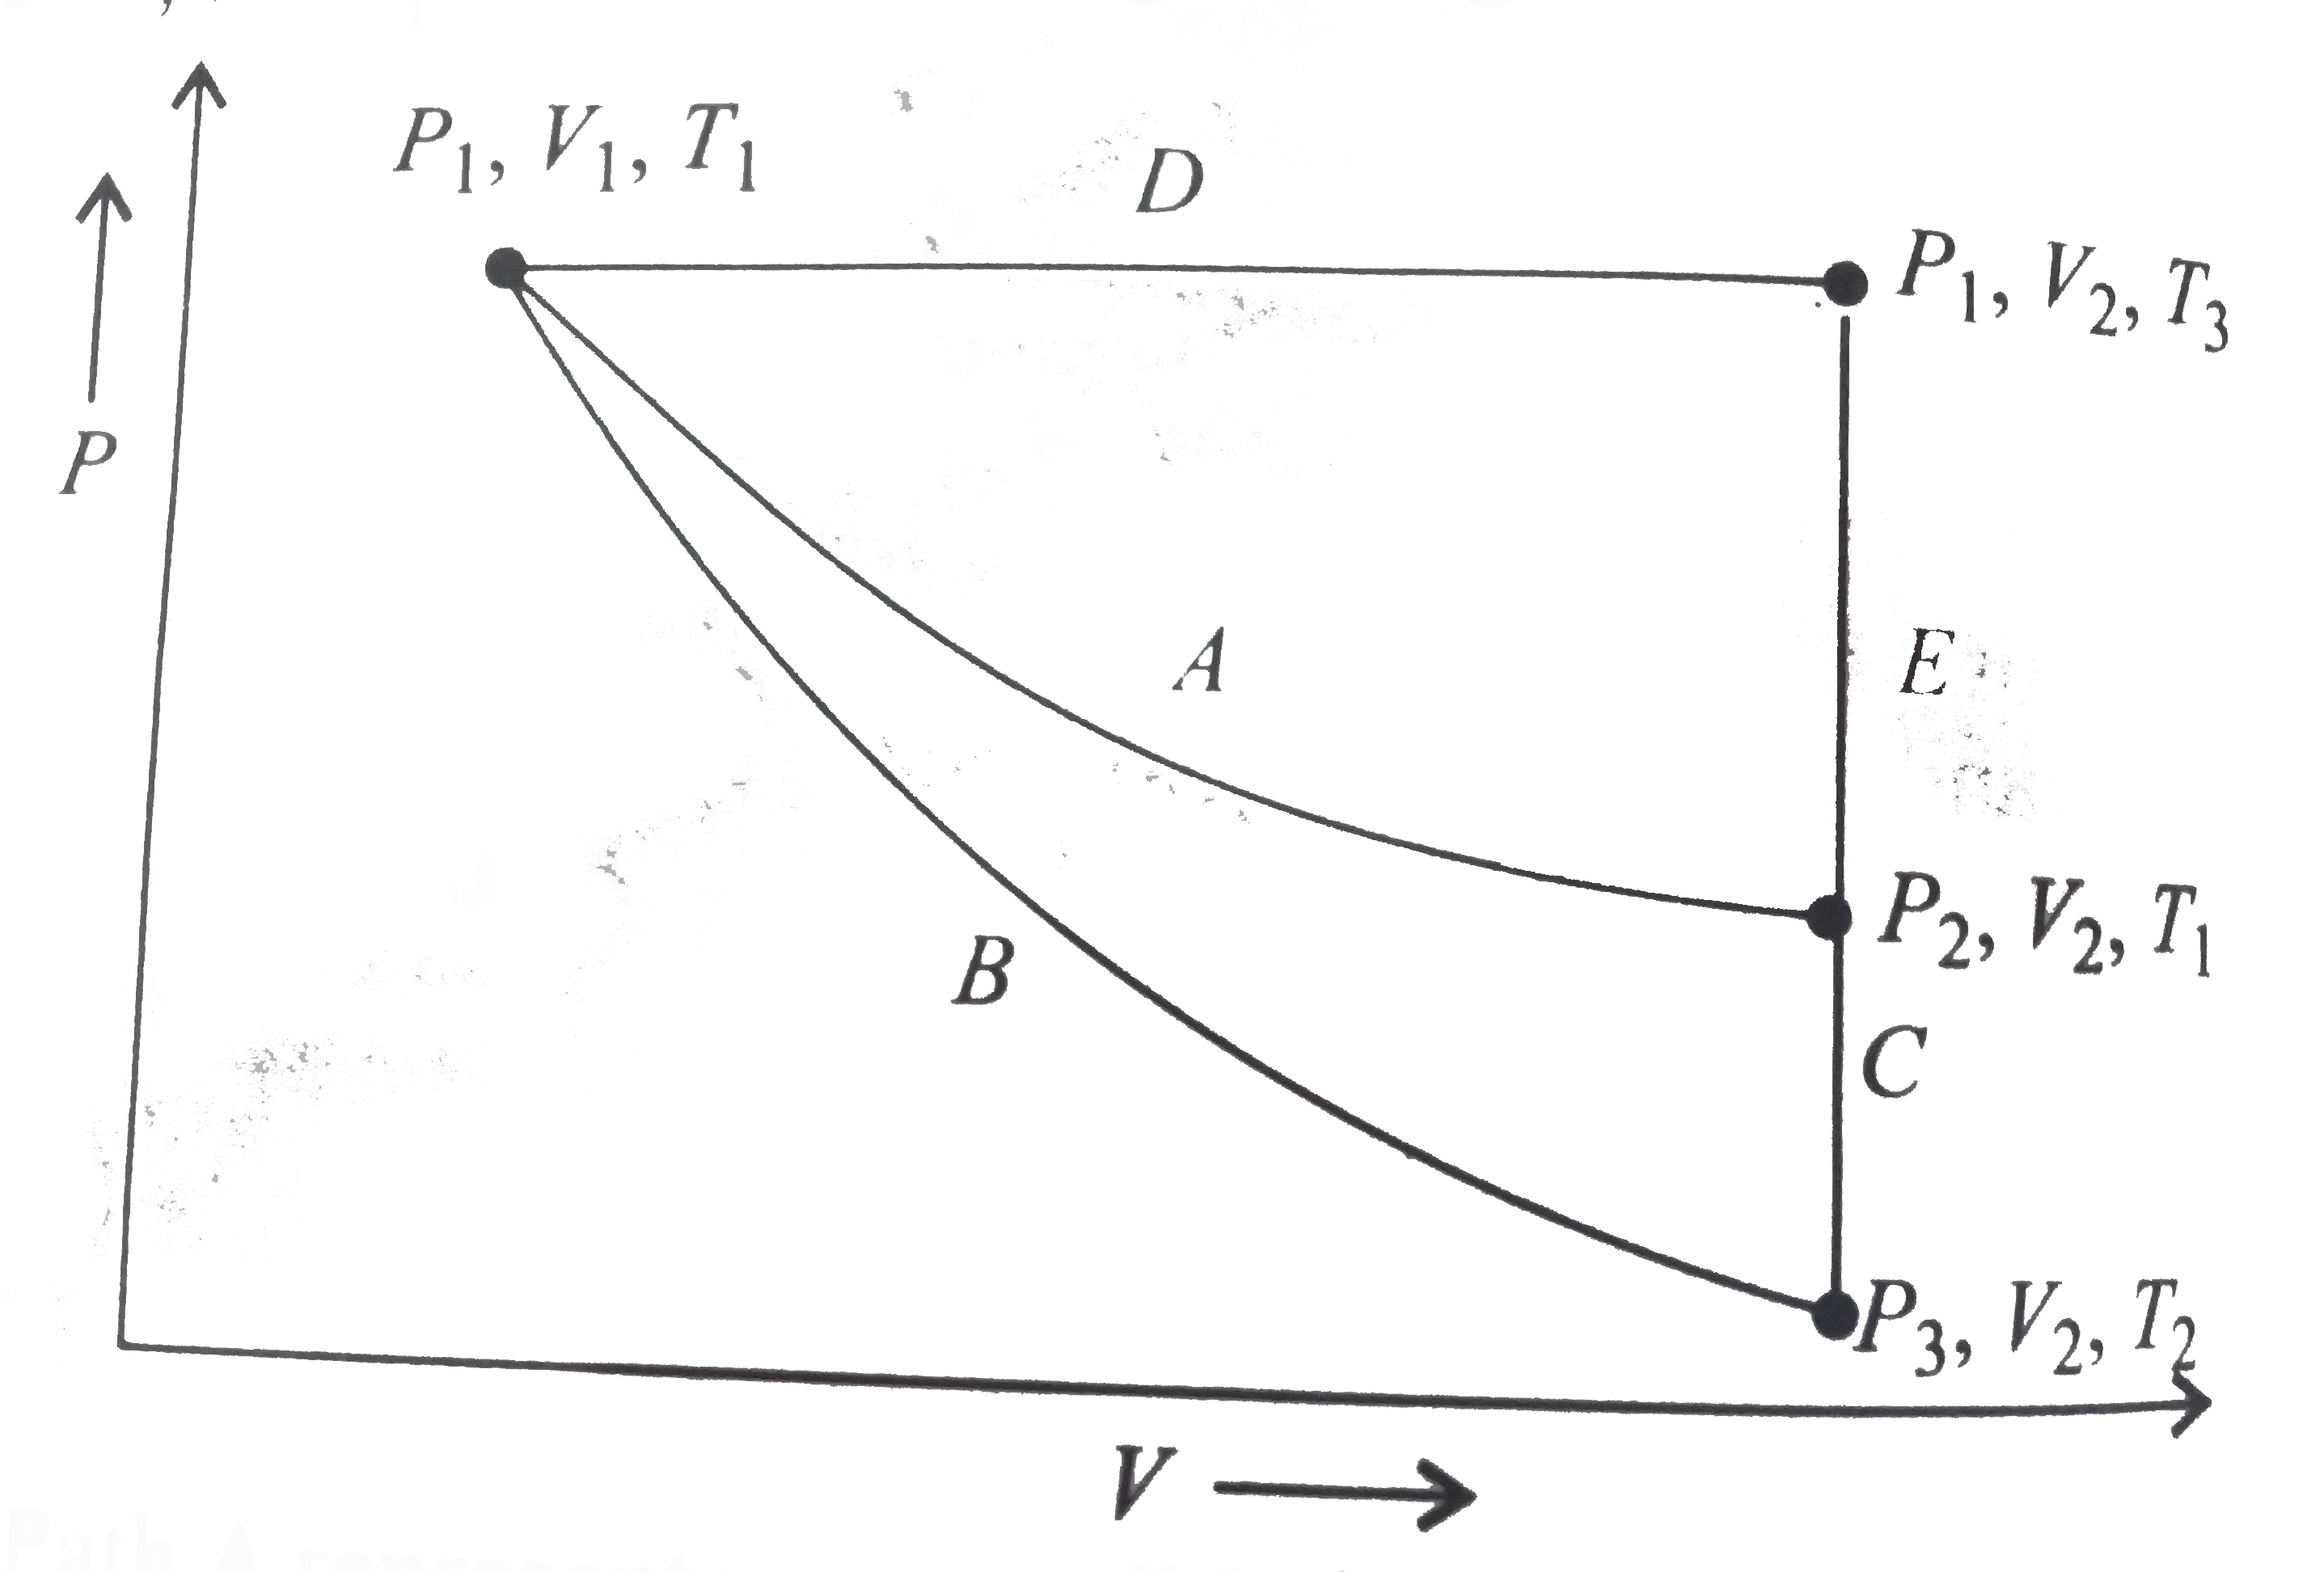
Path Arepresents a reversible isothermal expansion form P1,V1 to P2,V2, Path (B+C) represents a reversible adiabatic expansion (B) from P1,V1,T1→P3,V2,T2 followed by reversible heating the gas at constant volume (C)from P3,V2,T2 to P2,V2,T1. Path (D+E) represents a reversible expansion at constant pressure P1(D) from P1,V1,T1 to P1,V2,T3 followed by a reversible cooling at constant volume V2(E) from P1,V2,T3→P2,V2,T1.
What is ΔS for path A?
View SolutionFor an ideal gas, an illustratio of three different paths A(B+C) and (D+E) from an initial state P1,V1,T1 to a final state P2,V2,T1 is shown in the given figure.
Path Arepresents a reversible isothermal expansion form P1,V1 to P2,V2, Path (B+C) represents a reversible adiabatic expansion (B) from P1,V1,T1→P3,V2,T2 followed by reversible heating the gas at constant volume (C)from P3,V2,T2 to P2,V2,T1. Path (D+E) represents a reversible expansion at constant pressure P1(D) from P1,V1,T1 to P1,V2,T3 followed by a reversible cooling at constant volume V2(E) from P1,V2,T3→P2,V2,T1.
What is ΔS for path (D+E)?
View SolutionFor an ideal gas, an illustration of three different paths A,(B+C) and (D+E) from an initial state P1,V1,T1 to a final state P2,V2,T1 is shown in the given figure.
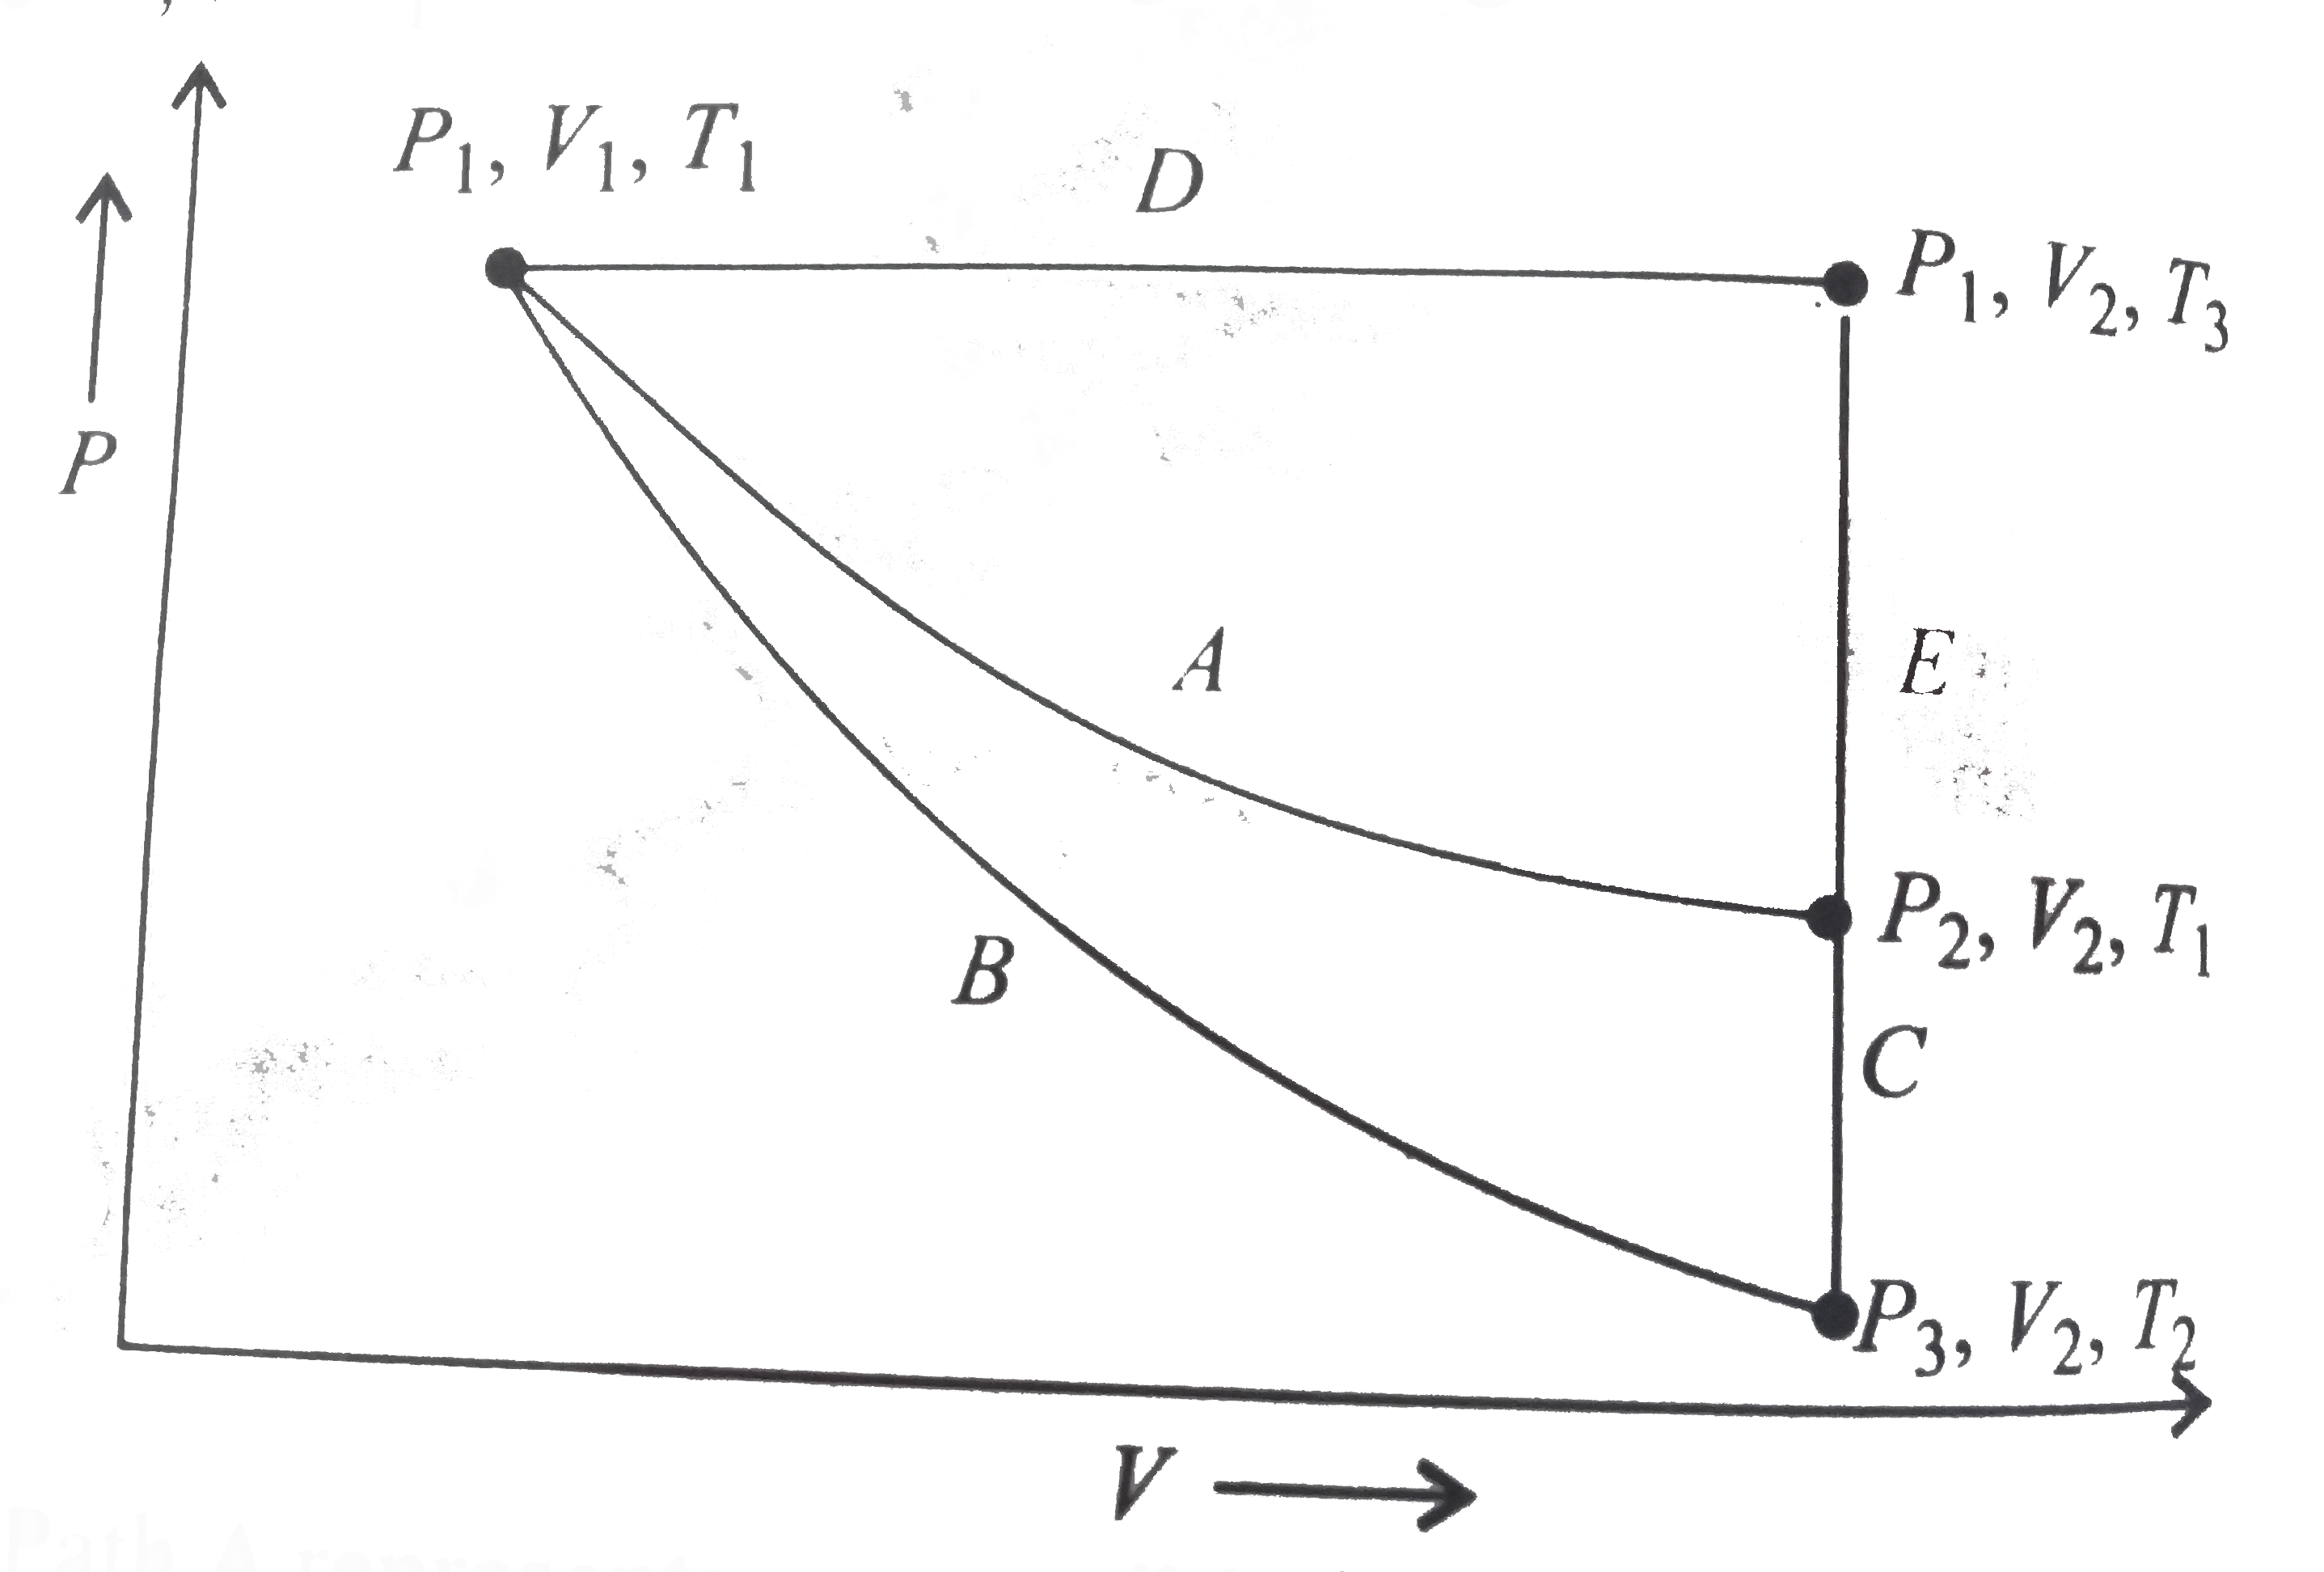
Path Arepresents a reversible isothermal expansion form P1,V1 to P2,V2, Path (B+C) represents a reversible adiabatic expansion (B) from P1,V1,T1→P3,V2,T2 followed by reversible heating the gas at constant volume (C)from P3,V2,T2 to P2,V2,T1. Path (D+E) represents a reversible expansion at constant pressure P1(D) from P1,V1,T1 to P1,V2,T3 followed by a reversible cooling at constant volume V2(E) from P1,V2,T3→P2,V2,T1.
What is qrev, for path A?
View Solution
