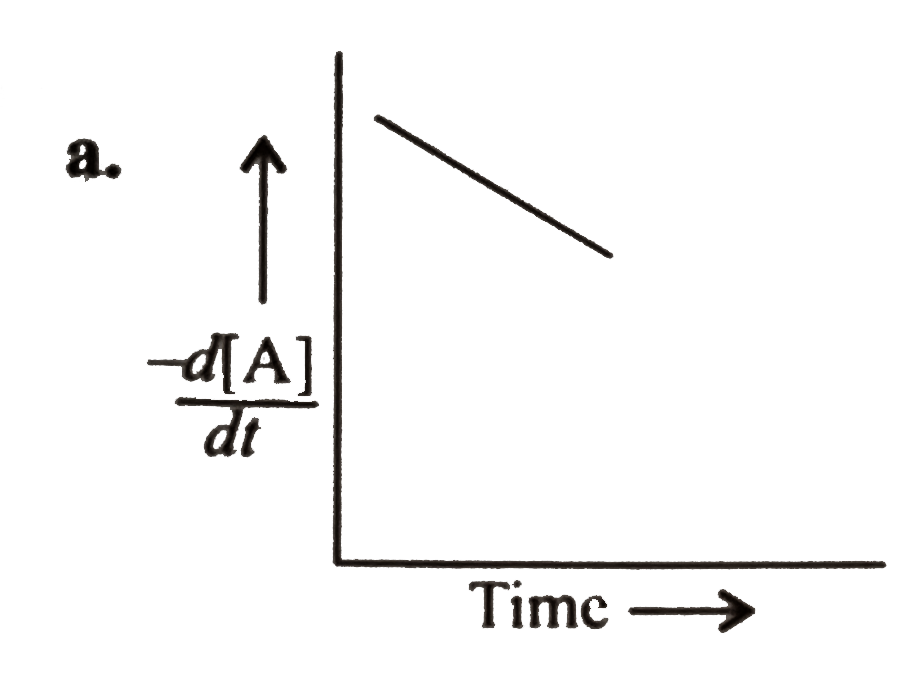
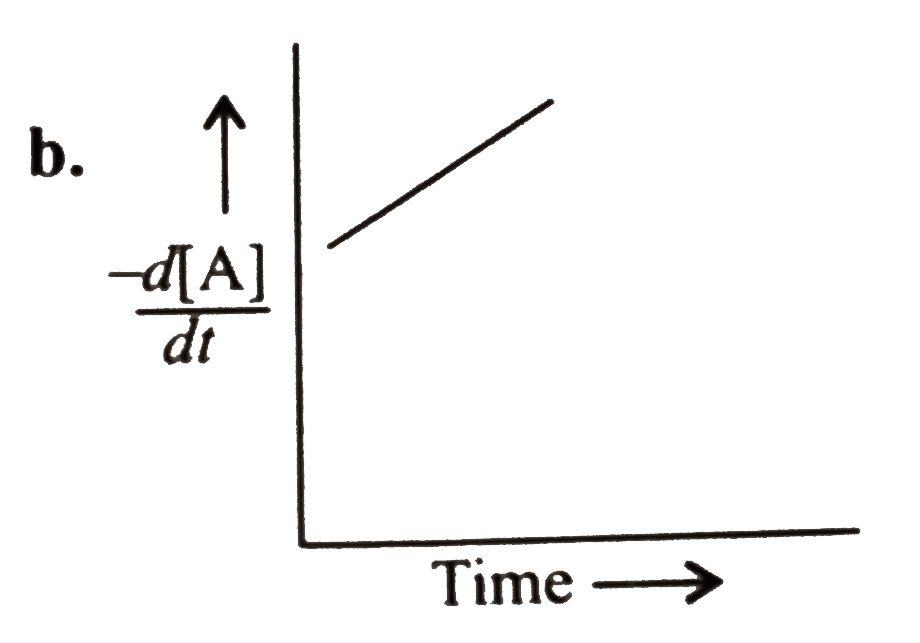
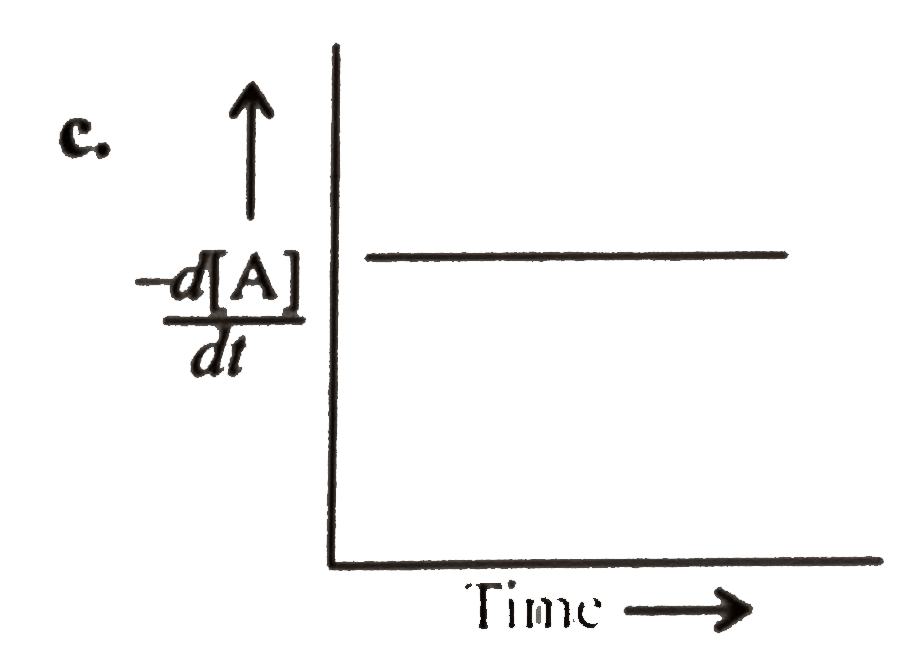
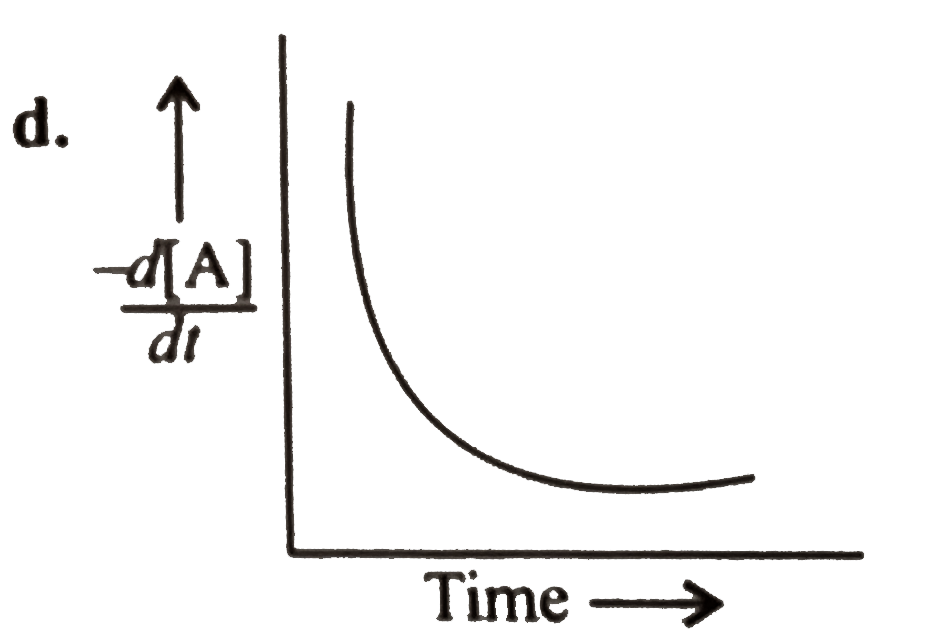
The graph between concentration (X) of the Product and time of the reaction A→B is of the type 1. Hence, graph between −d[A]dt and time will be of the type:
![The graph between concentration (X) of the Product and time of the reaction Ararr B is of the type 1. Hence, graph between -(d[A])/(dt) and time will be of the type:](https://d10lpgp6xz60nq.cloudfront.net/physics_images/KSV_PHY_CHM_P2_C04_E01_159_Q01.png)
The correct Answer is:C
Since [X] with time is increaisng uniformly so change in concentration of AorB, i.e., −d[A]dtord[B]dt is constant.
Topper's Solved these Questions
- CHEMICAL KINETICSBOOK - CENGAGE CHEMISTRY ENGLISHCHAPTER - CHEMICAL KINETICSEXERCISE - Exercises Assertion-Reasoning
22 Videos
- CHEMICAL KINETICSBOOK - CENGAGE CHEMISTRY ENGLISHCHAPTER - CHEMICAL KINETICSEXERCISE - Exercises Integer
15 Videos
- CHEMICAL KINETICSBOOK - CENGAGE CHEMISTRY ENGLISHCHAPTER - CHEMICAL KINETICSEXERCISE - Exercises Multiple Correct
33 Videos
- CARBOXYLIC ACIDS AND THEIR DERIVATIVESBOOK - CENGAGE CHEMISTRY ENGLISHCHAPTER - CARBOXYLIC ACIDS AND THEIR DERIVATIVESEXERCISE - Exercises Archives (Analytical And Descriptive)
34 Videos
- COORDINATION COMPOUNDSBOOK - CENGAGE CHEMISTRY ENGLISHCHAPTER - COORDINATION COMPOUNDSEXERCISE - Archives Subjective
18 Videos
Similar Questions
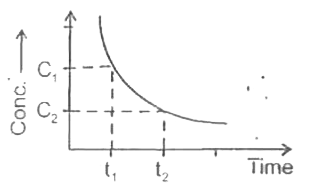
The graph plotted between concentration versus time
View SolutionFor the reactionA→B, for which graph between half life (t1/2)and∈itialconcentration(a)oftherectantisgivenbelow<br><imga≤ocr_imageload∈g=lazysrc=https://d10lpgp6xz60nq.cloudfront.net/physics_images/NRA_PHY_CHM_JMA_C07_E01_022_Q01.pngwh=80%mx-autosty≤=background:white;><br>Hencegraphbetween-(d[A])/(dt) and time will be:
View SolutionThe plote between concentration versus time for a zero order reaction is represented by :
View SolutionThe graph between the instantaneous concentration (N) of a radioactive element and time (t) is.
View SolutionThe graph between displacement and time for a particle moving with uniform acceleration is a
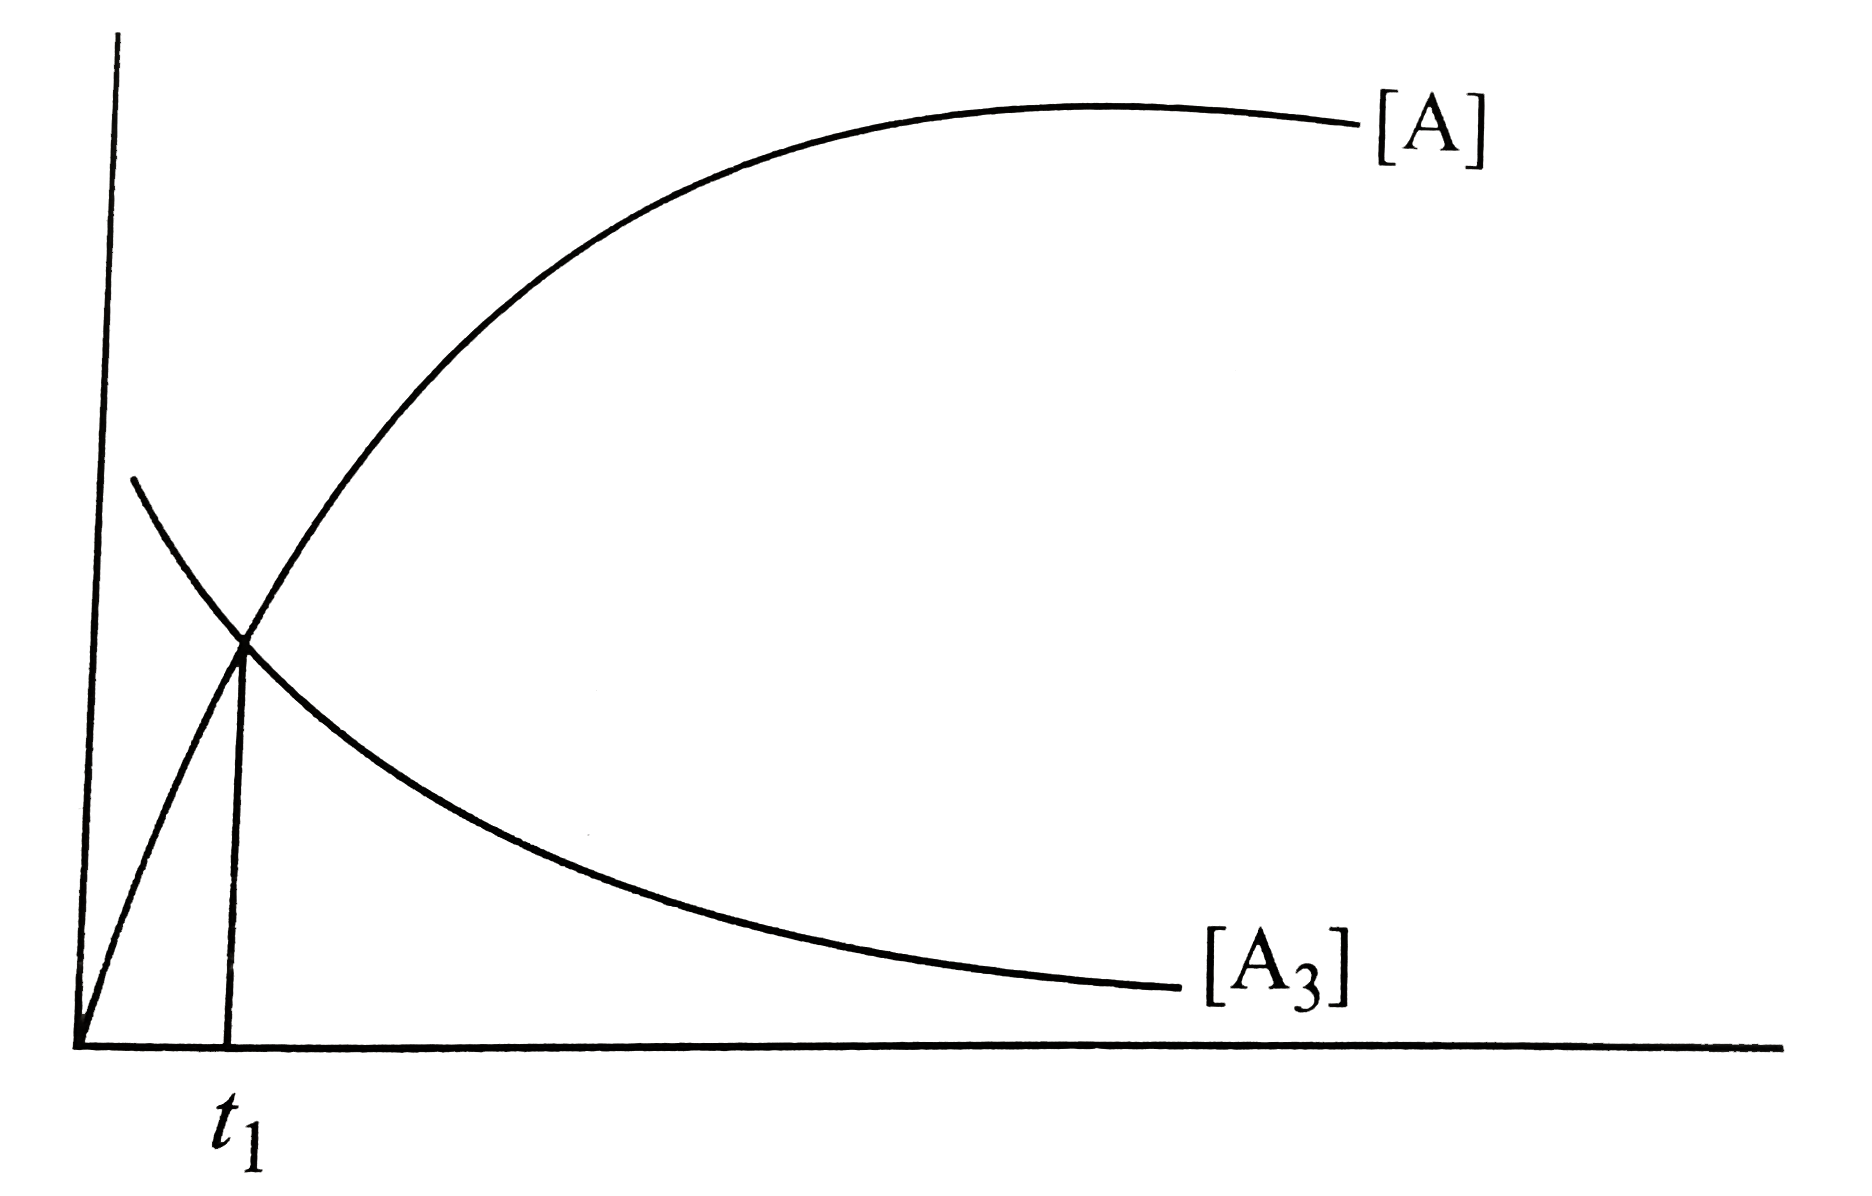
View SolutionUsing the given graph showing concentration of reactants and Products as a function of times for the reaction:
A3→3A
The time t1 corresponds to
View SolutionIn the graph represent direction of distance (d) vs time (t) ?
View SolutionFor a reaction X→Y, the graph of the product concentration (x) versus time (t) came out to be a straight line passing through the
origin. Hence and time would be the graph of d[X]dt and the time
would be
View SolutionThe graph between time period (T) and length (l) of a simple pendulum is
View SolutionFor the second order reaction, concentration (x) of the product at time t starting with initial concentration [A]o is :
View Solution
