In the graph represent direction of distance (d) vs time (t) ?
The correct Answer is:C
To solve the question regarding the graph that represents the direction of distance (d) vs time (t), we need to analyze the characteristics of distance with respect to time.
1. Understanding Distance vs Time:
- Distance is a scalar quantity that represents how far an object has traveled from its initial position. It is always non-negative and increases or remains constant over time for a moving object.
2. Analyzing the Graphs:
- We need to evaluate the given options (A, B, C, D) based on the behavior of distance over time.
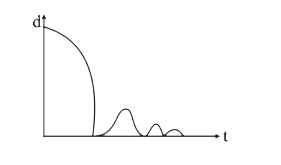
3. Evaluating Option A:
- In graph A, as time increases, the distance decreases. This contradicts the principle that distance should either increase or remain constant. Therefore, Option A is incorrect.
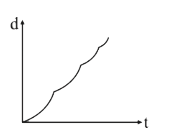
4. Evaluating Option B:
- In graph B, the distance initially increases but then decreases after reaching a peak. This indicates that the object is moving away and then moving back towards the starting point, which is not a valid representation of distance over time. Thus, Option B is also incorrect.
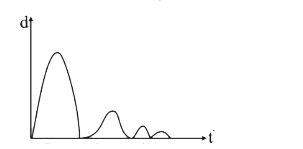
5. Evaluating Option D:
- In graph D, similar to graph B, the distance increases initially and then decreases after reaching a peak. This again suggests a return towards the starting point, which is not consistent with the definition of distance. Hence, Option D is incorrect.
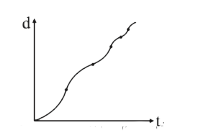
6. Evaluating Option C:
- In graph C, the distance consistently increases as time progresses. This is the only graph that correctly represents the behavior of distance with respect to time for a moving object. Therefore, Option C is the correct answer.
Conclusion:
The correct graph that represents the direction of distance (d) vs time (t) is Option C.
---
- Distance is a scalar quantity that represents how far an object has traveled from its initial position. It is always non-negative and increases or remains constant over time for a moving object.
- We need to evaluate the given options (A, B, C, D) based on the behavior of distance over time.
- In graph A, as time increases, the distance decreases. This contradicts the principle that distance should either increase or remain constant. Therefore, Option A is incorrect.
- In graph B, the distance initially increases but then decreases after reaching a peak. This indicates that the object is moving away and then moving back towards the starting point, which is not a valid representation of distance over time. Thus, Option B is also incorrect.
- In graph D, similar to graph B, the distance increases initially and then decreases after reaching a peak. This again suggests a return towards the starting point, which is not consistent with the definition of distance. Hence, Option D is incorrect.
- In graph C, the distance consistently increases as time progresses. This is the only graph that correctly represents the behavior of distance with respect to time for a moving object. Therefore, Option C is the correct answer.
The correct graph that represents the direction of distance (d) vs time (t) is Option C.
Topper's Solved these Questions
- KINEMATICS OF A PARTICLE BOOK - VMC MODULES ENGLISHCHAPTER - KINEMATICS OF A PARTICLE EXERCISE - JEE MAIN (archive)
19 Videos
- KINEMATICS OF A PARTICLE BOOK - VMC MODULES ENGLISHCHAPTER - KINEMATICS OF A PARTICLE EXERCISE - JEE Advanced (archive)
14 Videos
- KINEMATICS OF A PARTICLE BOOK - VMC MODULES ENGLISHCHAPTER - KINEMATICS OF A PARTICLE EXERCISE - LEVEL 1
75 Videos
- JEE MAIN REVISON TEST-23BOOK - VMC MODULES ENGLISHCHAPTER - JEE MAIN REVISON TEST-23EXERCISE - PHYSICS (SECTION 2)
1 Video
- LAWS OF MOTION BOOK - VMC MODULES ENGLISHCHAPTER - LAWS OF MOTION EXERCISE - IMPECCABLE
53 Videos
Similar Questions
A body is thrown vertically upwards which graph represents variation of velocity w.r.t time
View SolutionLet y=Asin(ωt−kx) represent the variation of distance y of a particle with time t. Which of the following is not meaningful?
View SolutionWhich of the following x-t graphs represents the distance-time variation of a body released from the top of a buiding?
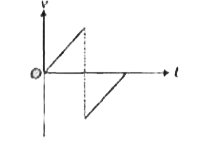
View SolutionThe velocity (v) - time (t) graph for a particle moving along x - axis is shown in the figure. The corresponding position (x) - time (t) is best represented by
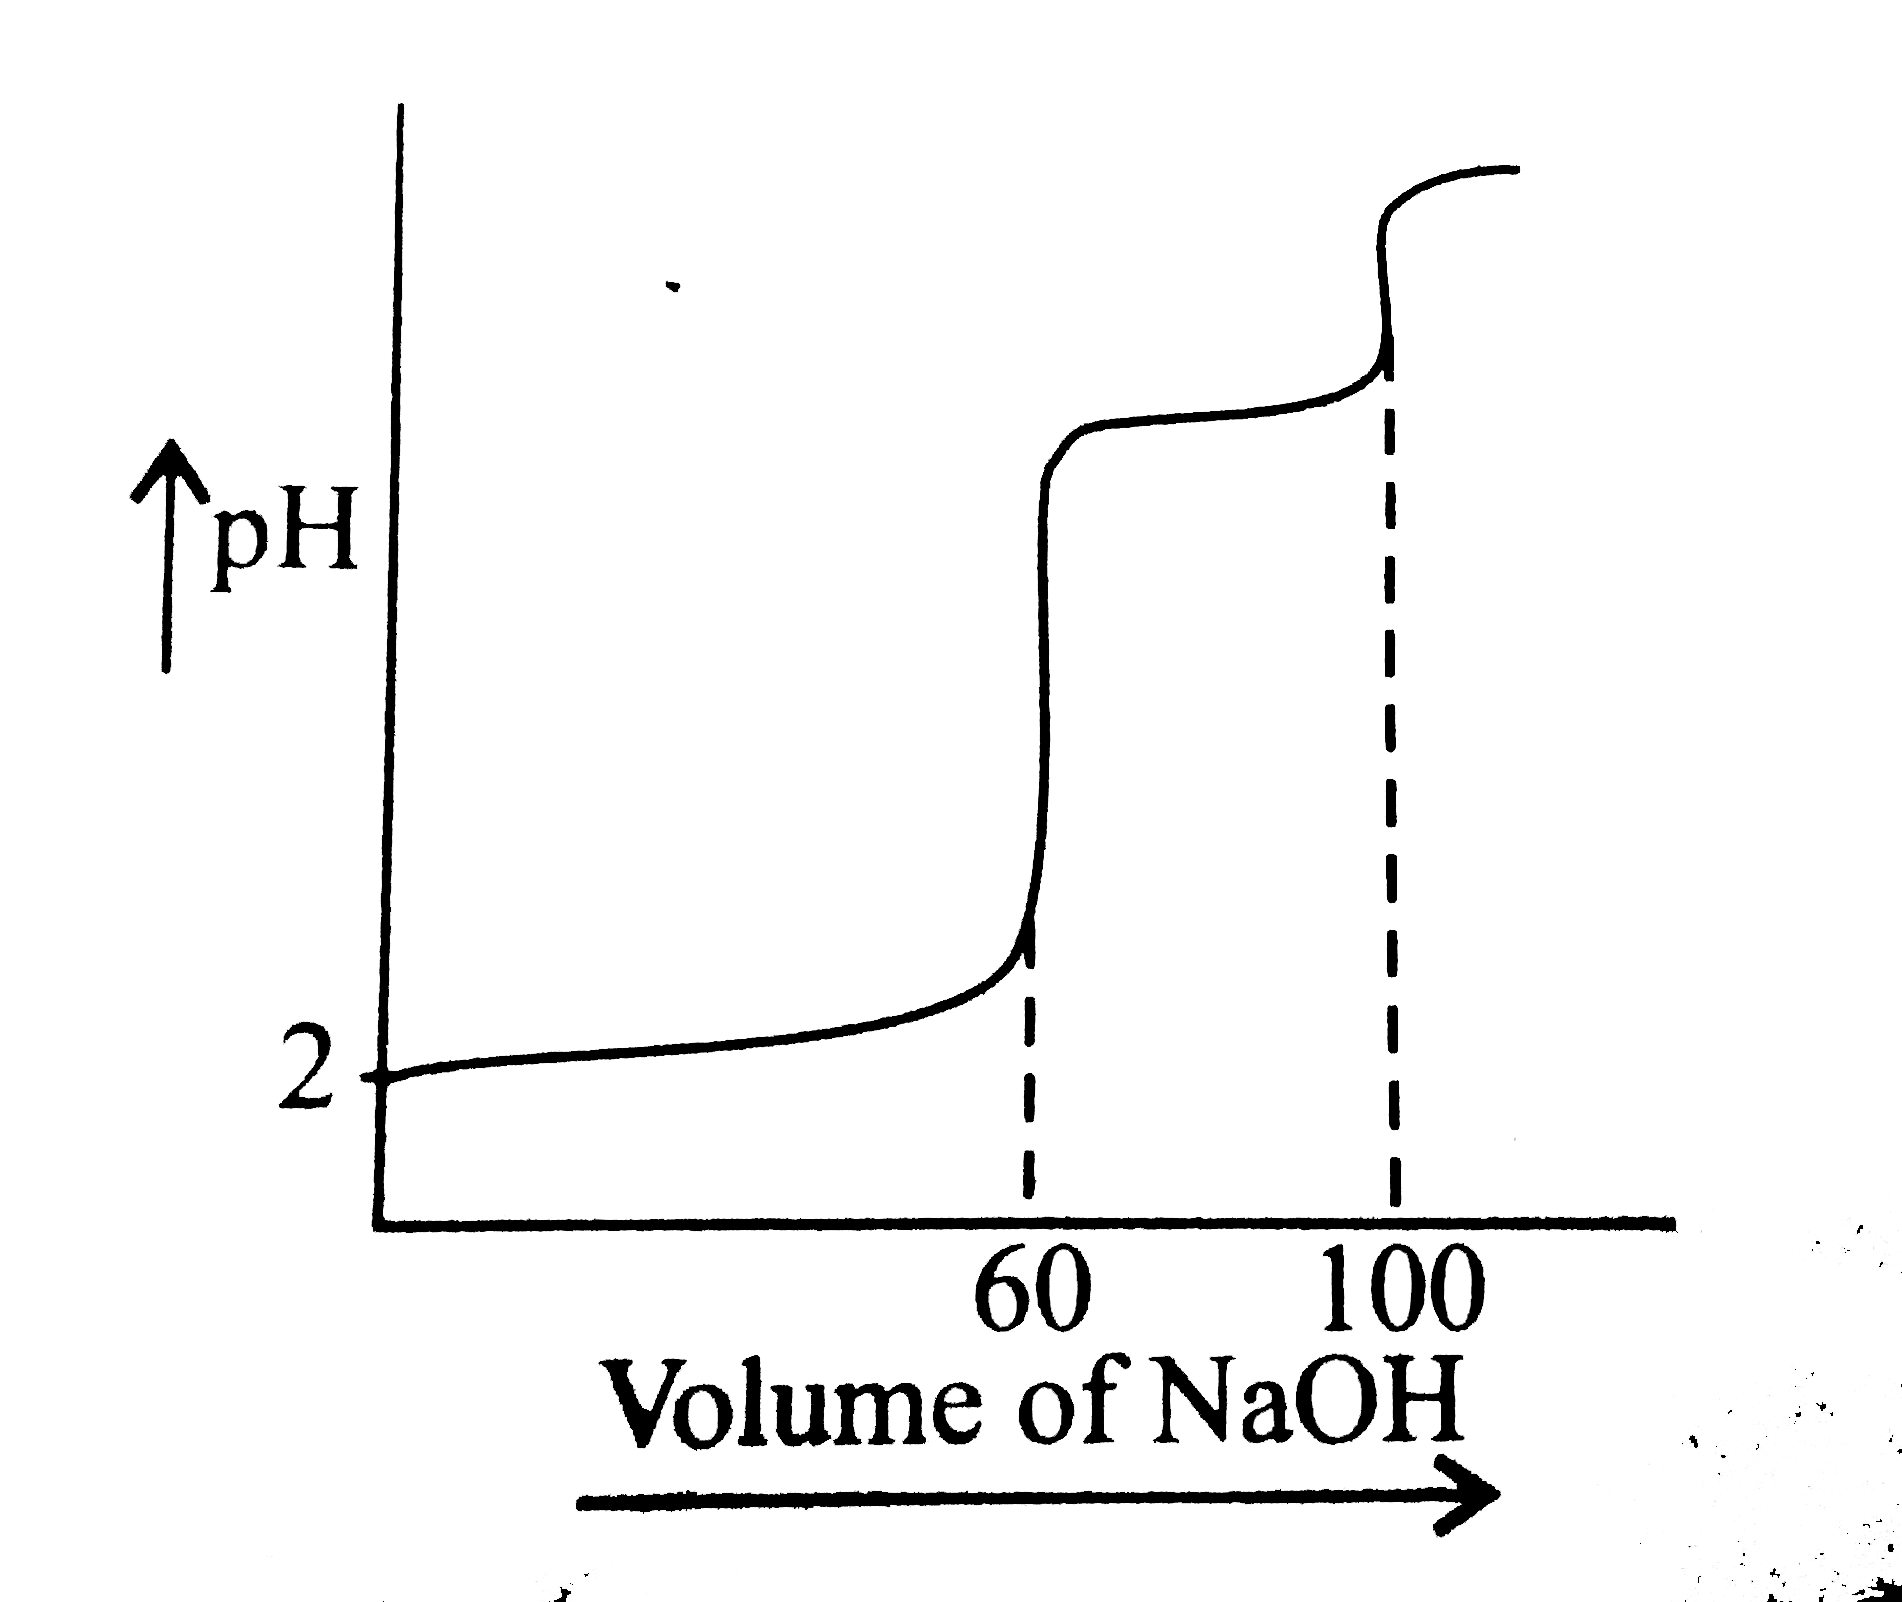
View SolutionThe following graph represents the titration of pH vs volume
View SolutionDraw a graph (not to the scale) representing the variation of square of time period (T2) with the length (l) of a pendulum.
View SolutionWhich of the following graph(s) represent retardation ? [v : velocity, t : time, x : position]
View SolutionThe graph below shws the velocity versus time graph for a body
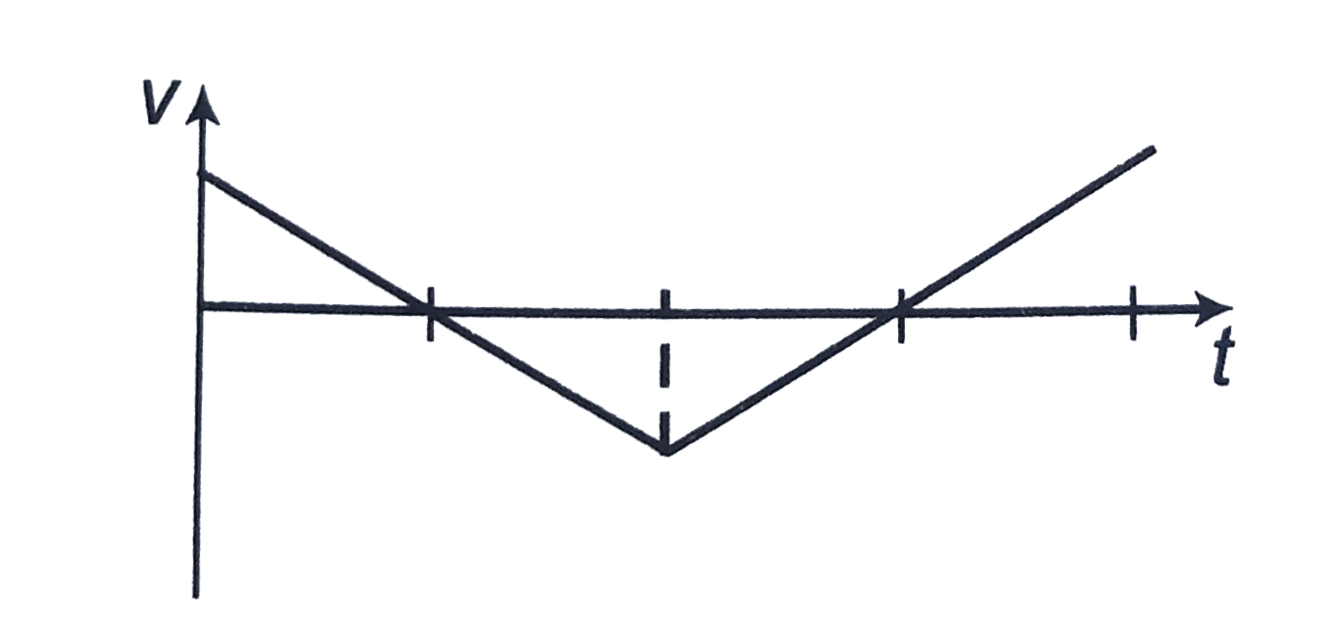
Which of the following graph represents the corresponding acceleration v//s time graph?
View SolutionA body is thrown vertically upwards. Which one of the following graphs correctly represent the velocity vs time?
View SolutionFigure a represents the speed-time graph for a particle .Find the distance covered by the particle betweent=10 min and t= 30 min .

View Solution