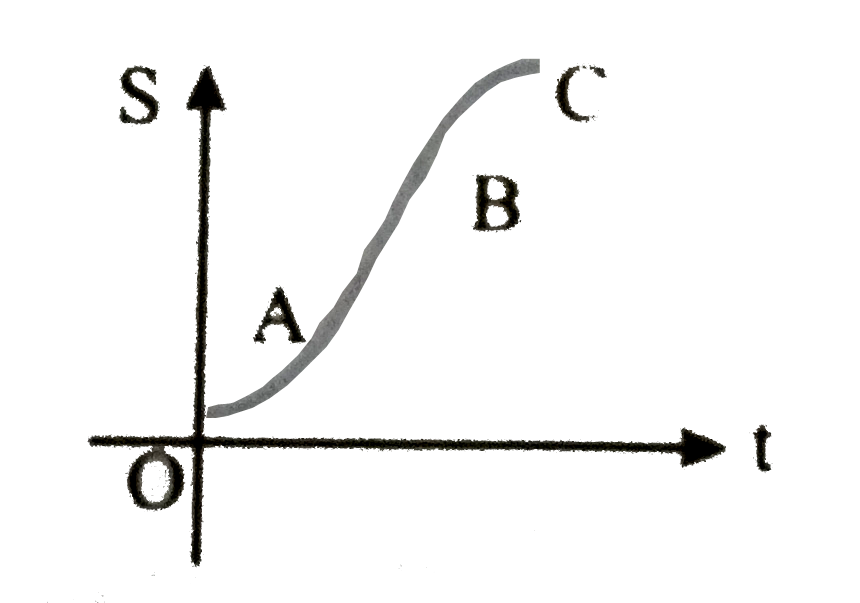
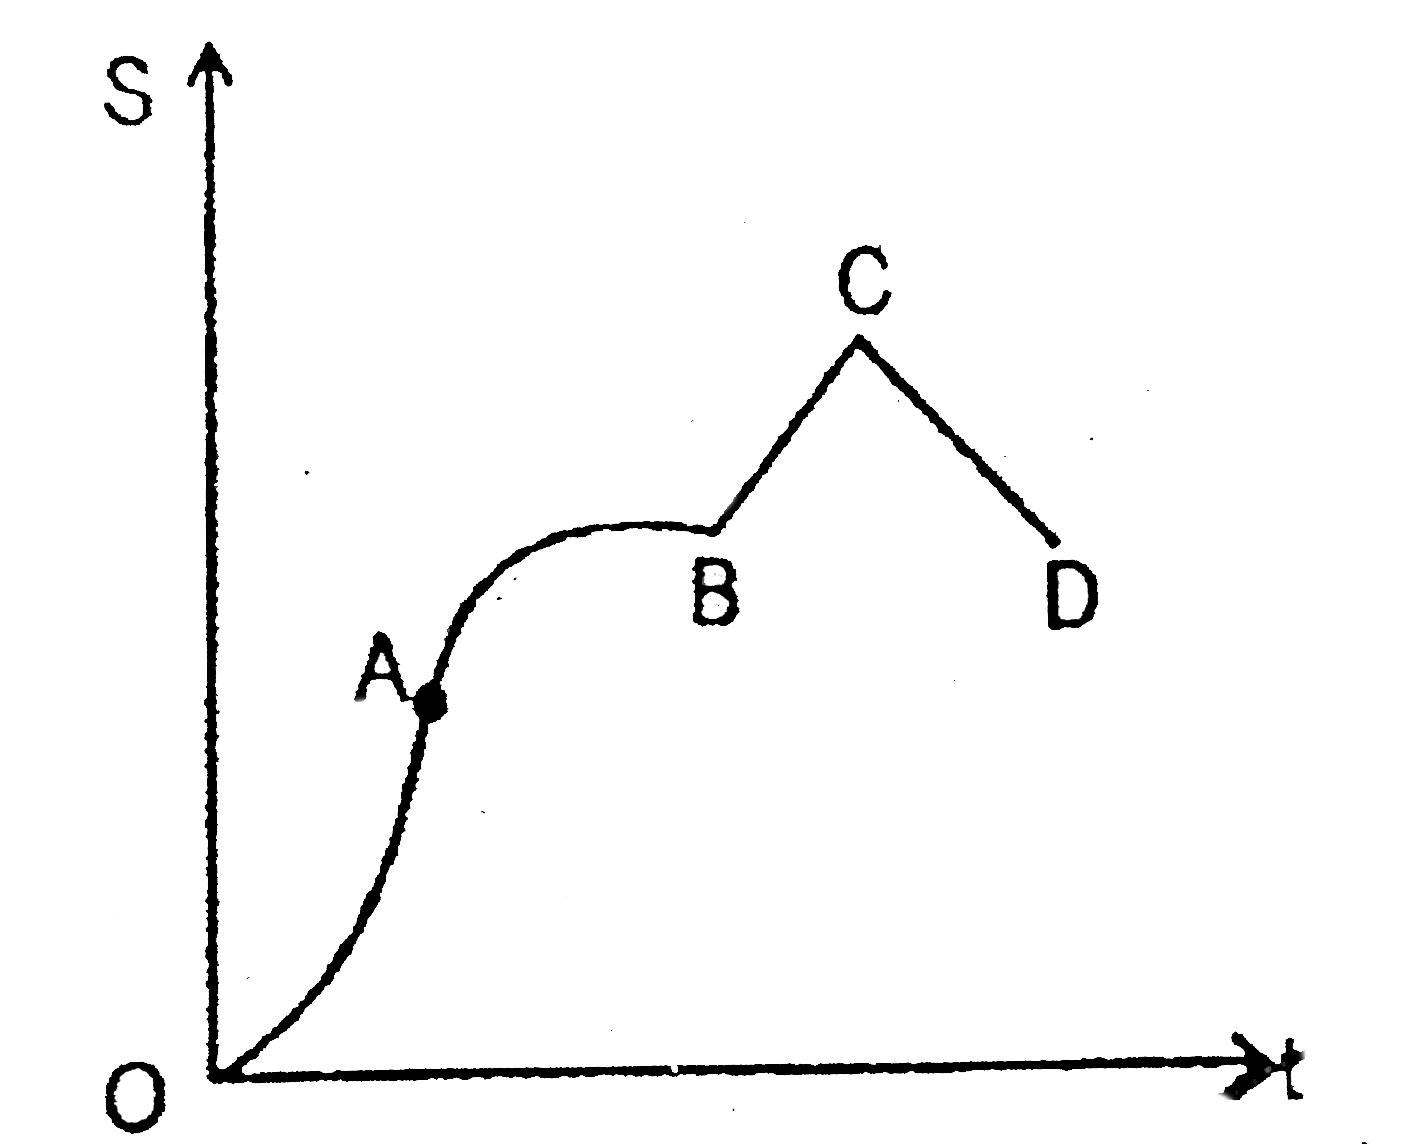
Displacement time graph of a particle moving along a straight line are given in the figures shown. Which of the graphs 1s practically possible ?
A

B

C

D

Text Solution
The correct Answer is:D
|
Topper's Solved these Questions
Similar Questions
Knowledge Check
Displacement time graph of a particle moving in a straight line is a shown in figure.
 Ain region A acceleration is positiveBin region B acceleration is negativeCin region C acceleration is positiveDin region D acceleration is negative
Velocity displacement graph of a particle moving in a straight line is as shown in figure.
 Amagnitude of acceleration of particle is decreasingBmagnitude of acceleration of particlre is increasingCacceleration versus displacement graph straight lineDacceleration versus displacement graph is parabola
Displacement time graph of a particle moving in a straight line is as shown in figure. Select the correct alternative (s) :
 .AWork done by all the forces in region OA and BC is positiveBWork done by all the forces in region AB is zeroCWork done by the forces in region BC is negativeDWork done by all the forces in region OA is negative.
Displacement time graph of a particle moving in a straight line is as shown in figure. Select the correct alternative (s) :
 .
.
View SolutionDisplacment-time graph of a particle moving in a straight line is as shown in figure. Choose the INCORRECT statement(s)

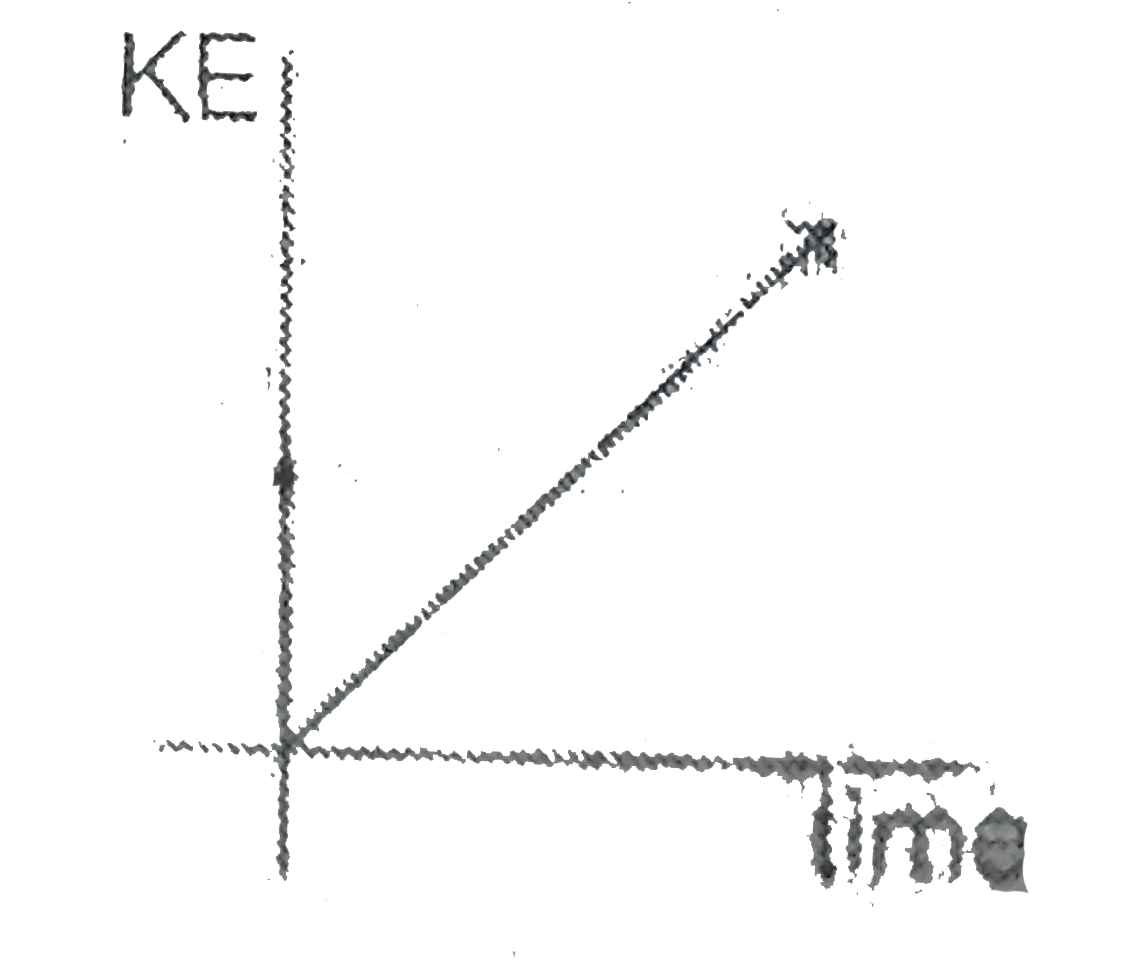
View SolutionThe kinetic energy (KE) versus time graph for a particle moving along a straight line is as shown in the figure. The force versus time graph for the particle may be

View SolutionDisplacment-time graph of a particle moving in a straight line is as shown in figure. Choose the INCORRECT statement(s)

View SolutionThe kinetic energy (KE) versus time graph for a particle moving along a straight line is as shown in the figure. The force versus time graph for the particle may be

View Solution
