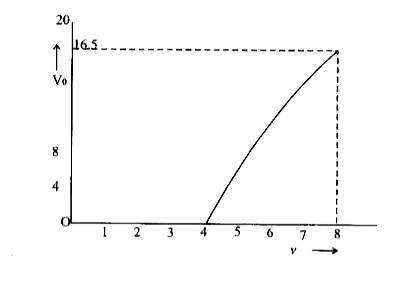
The graph between cut-off potential and frequency of incident radiations in photo-electric effect isSolution in Odia
is straight line passing through the origin
a striaght line not passing through the origin
a circle
a ellipse
Step by step video & image solution for The graph between cut-off potential and frequency of incident radiations in photo-electric effect is by Physics experts to help you in doubts & scoring excellent marks in Class 12 exams.
Updated on:21/07/2023Similar Questions
The slope of the graph drawn between stopping potential and frequency of incident radiation will be
View SolutionA graph of stopping potential of a photo sensitive metal with the frequency of incident radiation is plotted. What does the slope of this curve represent?
View SolutionThe variation of photo-current with collector potential for different frequencies of incident radiation V_1,V_2 and V_3 is as shows in the graph, then
View SolutionThe graph between cut-off potential and frequency of incident radiation in photoelectric effect is
View SolutionThe stopping potential as a function of frequency of incident radiation is plotted for two different photo electric surfaces A and B, The graphs show the work function of A is
View SolutionFor photo electric effect in metal, the graph of stopooing potential V0 versus frequency v (Hz) of he incident radiation is shown. From the graph find

threshold frequency
View SolutionFor photo electric effect in metal, the graph of stopooing potential V _(0) versus frequency v (Hz) of he incident radiation is shown. From the graph find plancks const
View Solution
