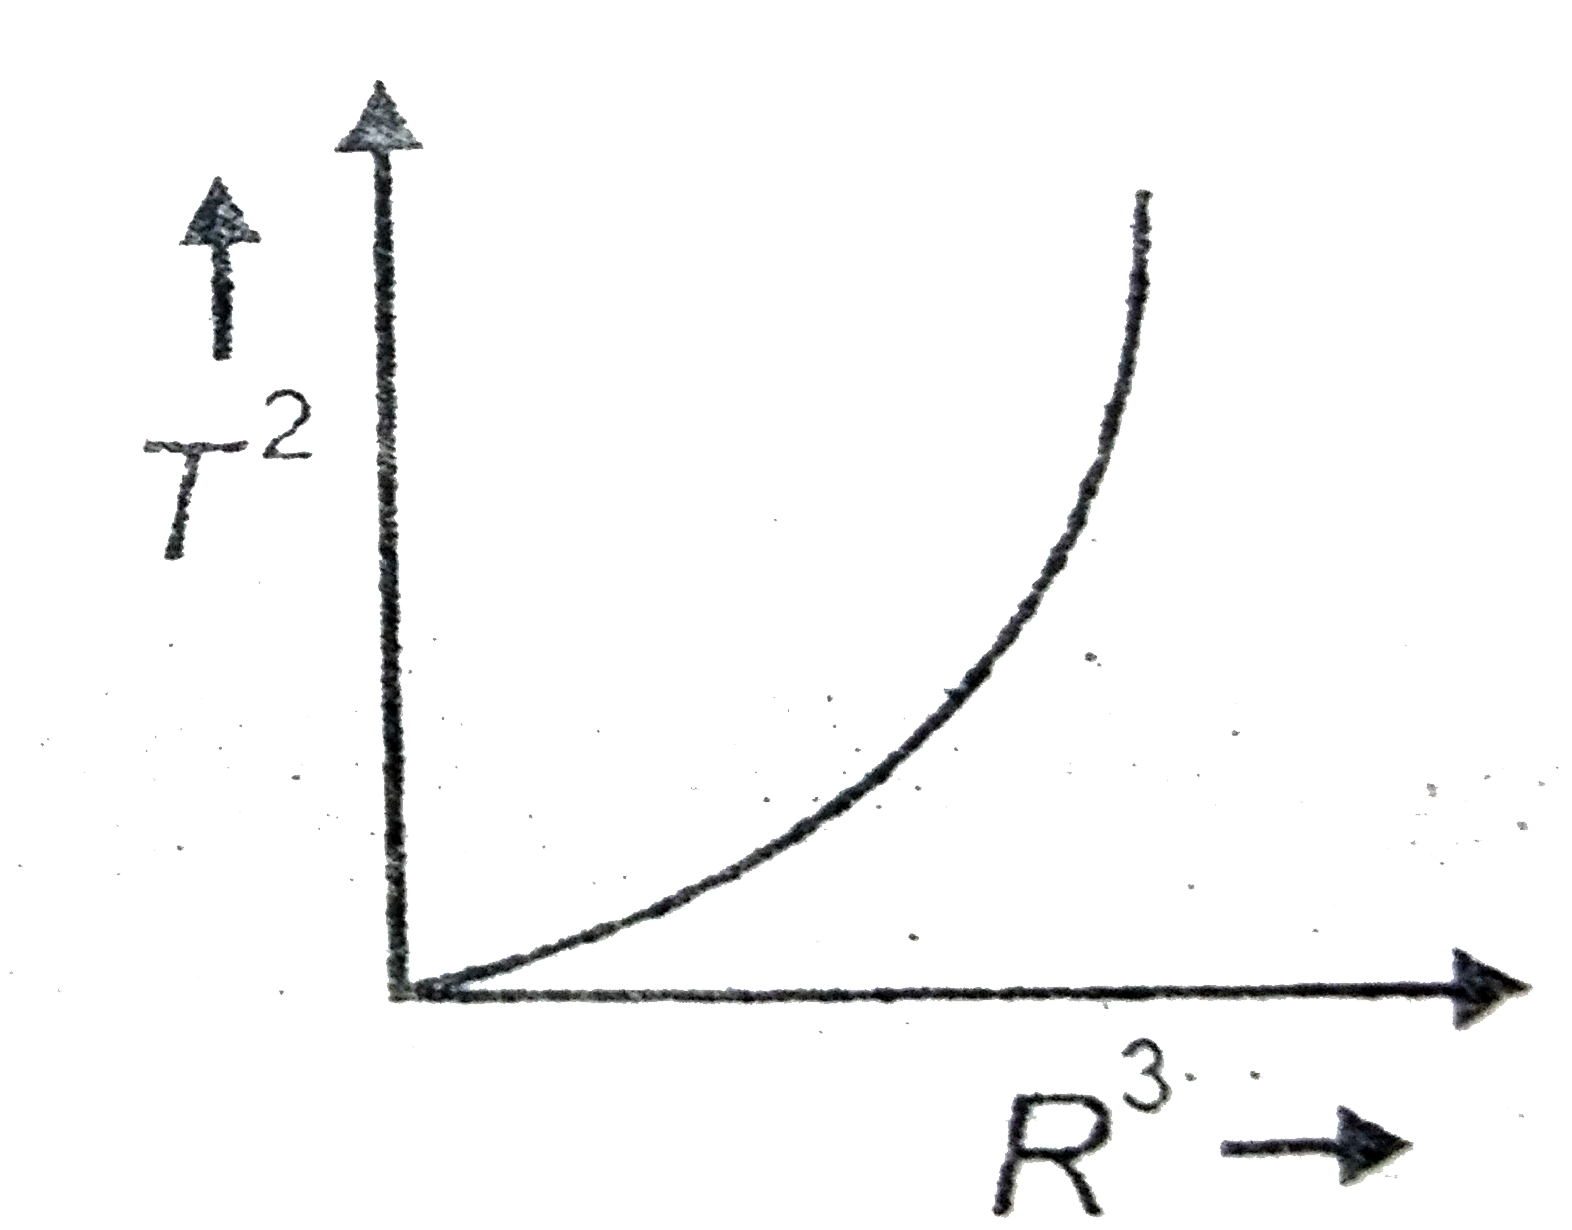
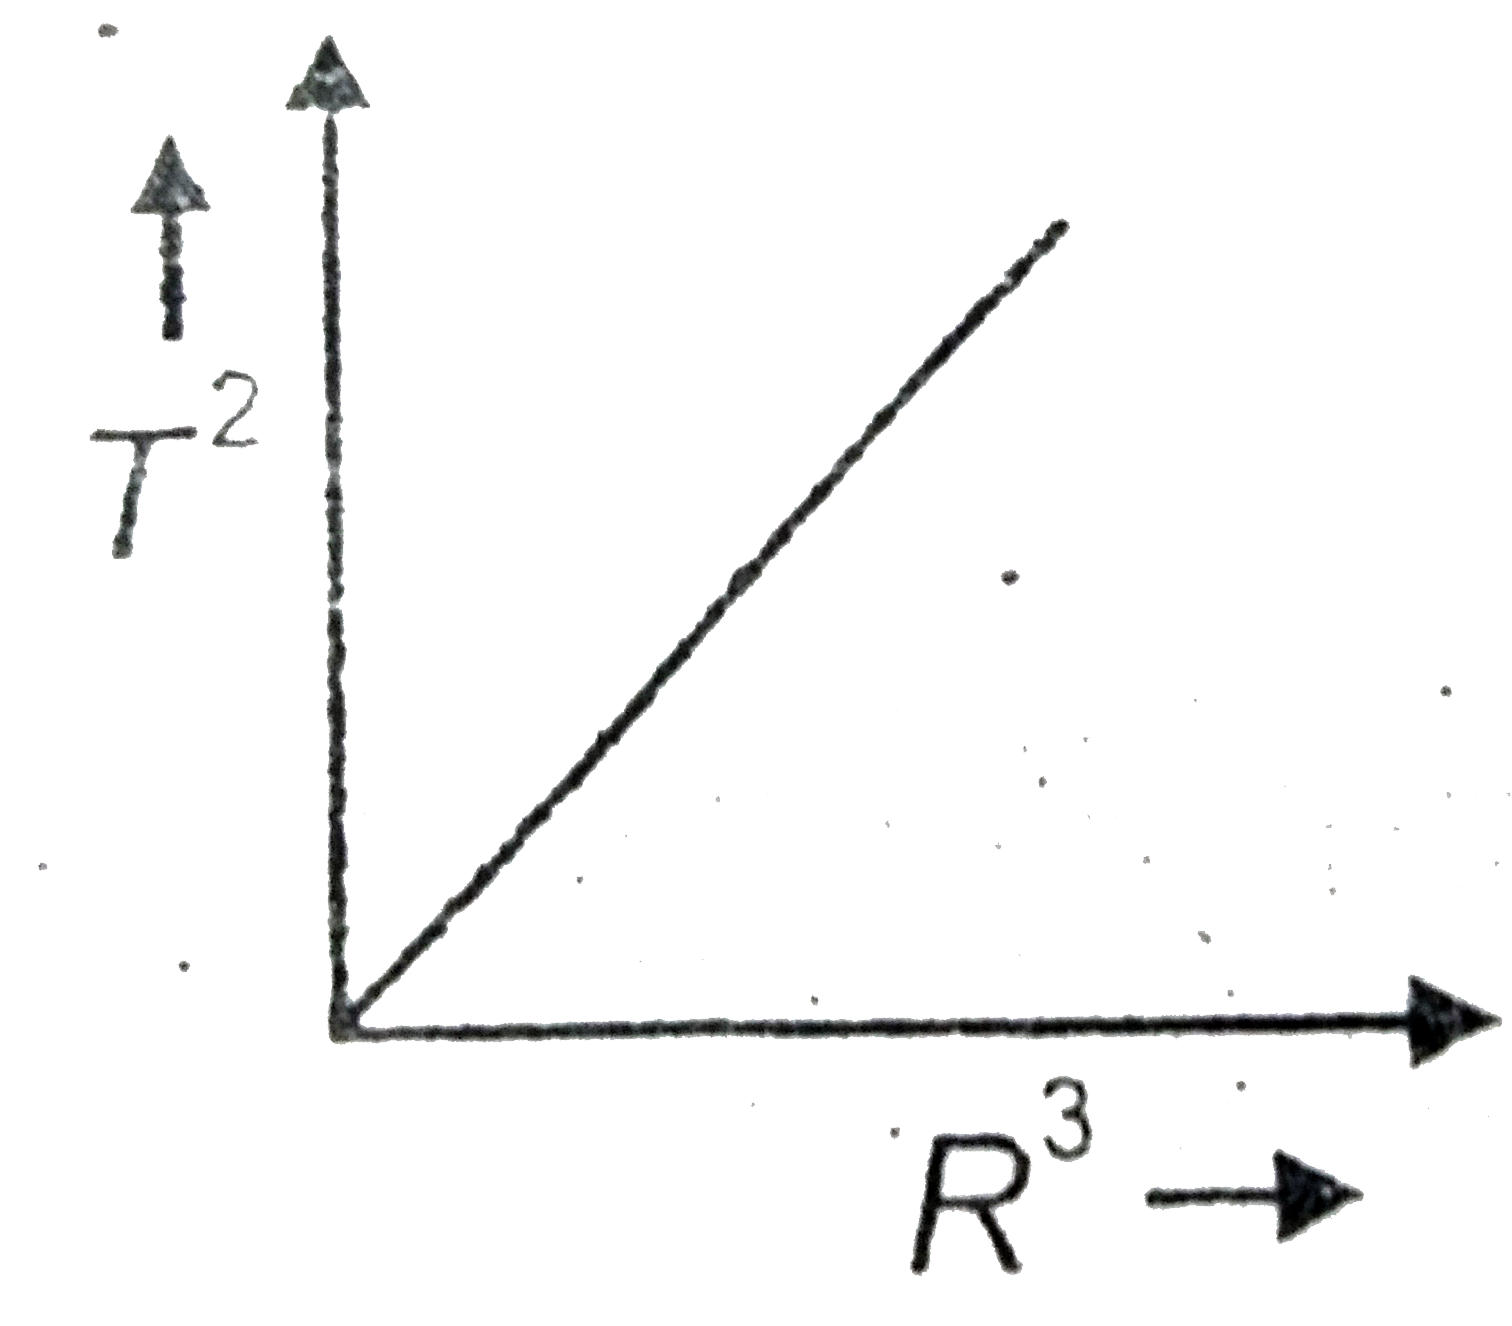
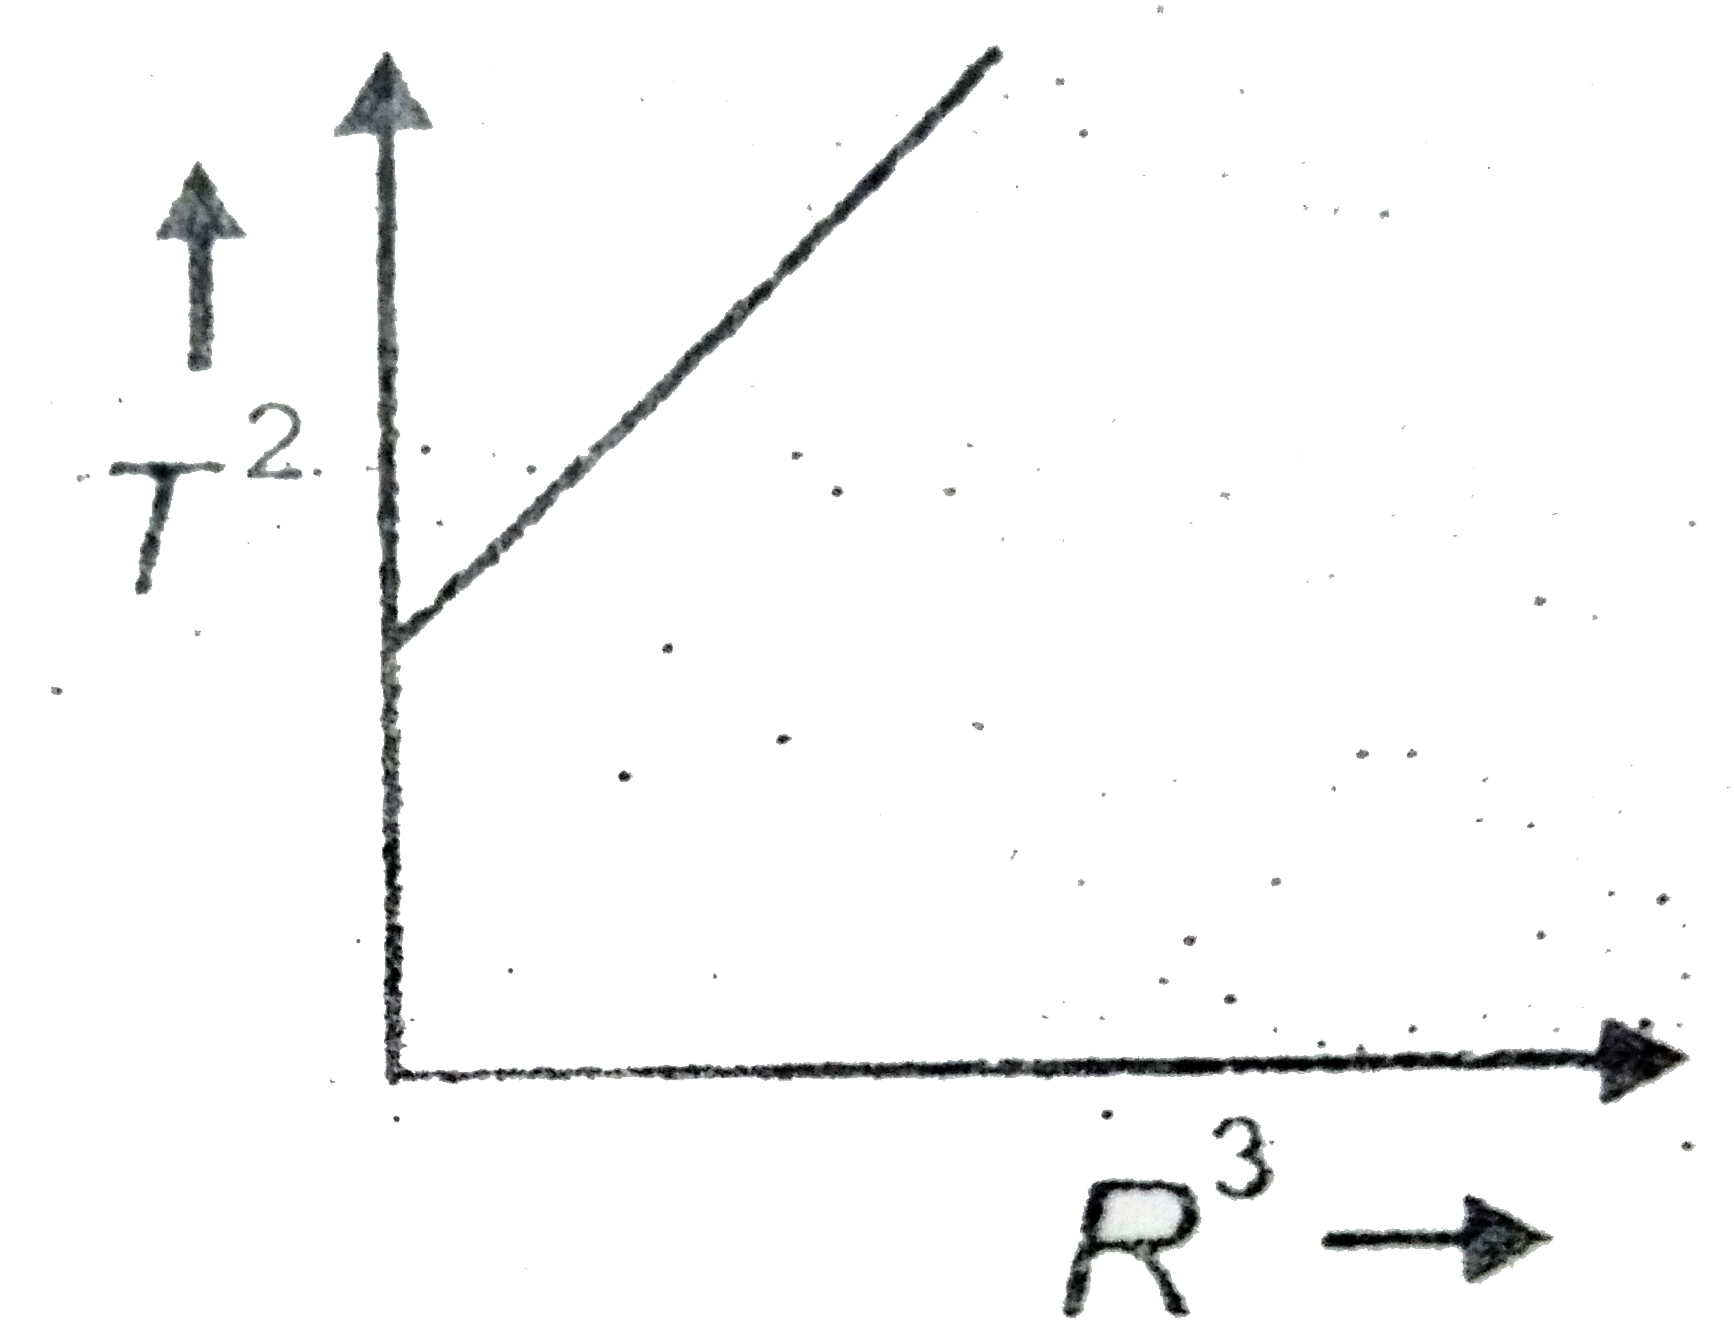
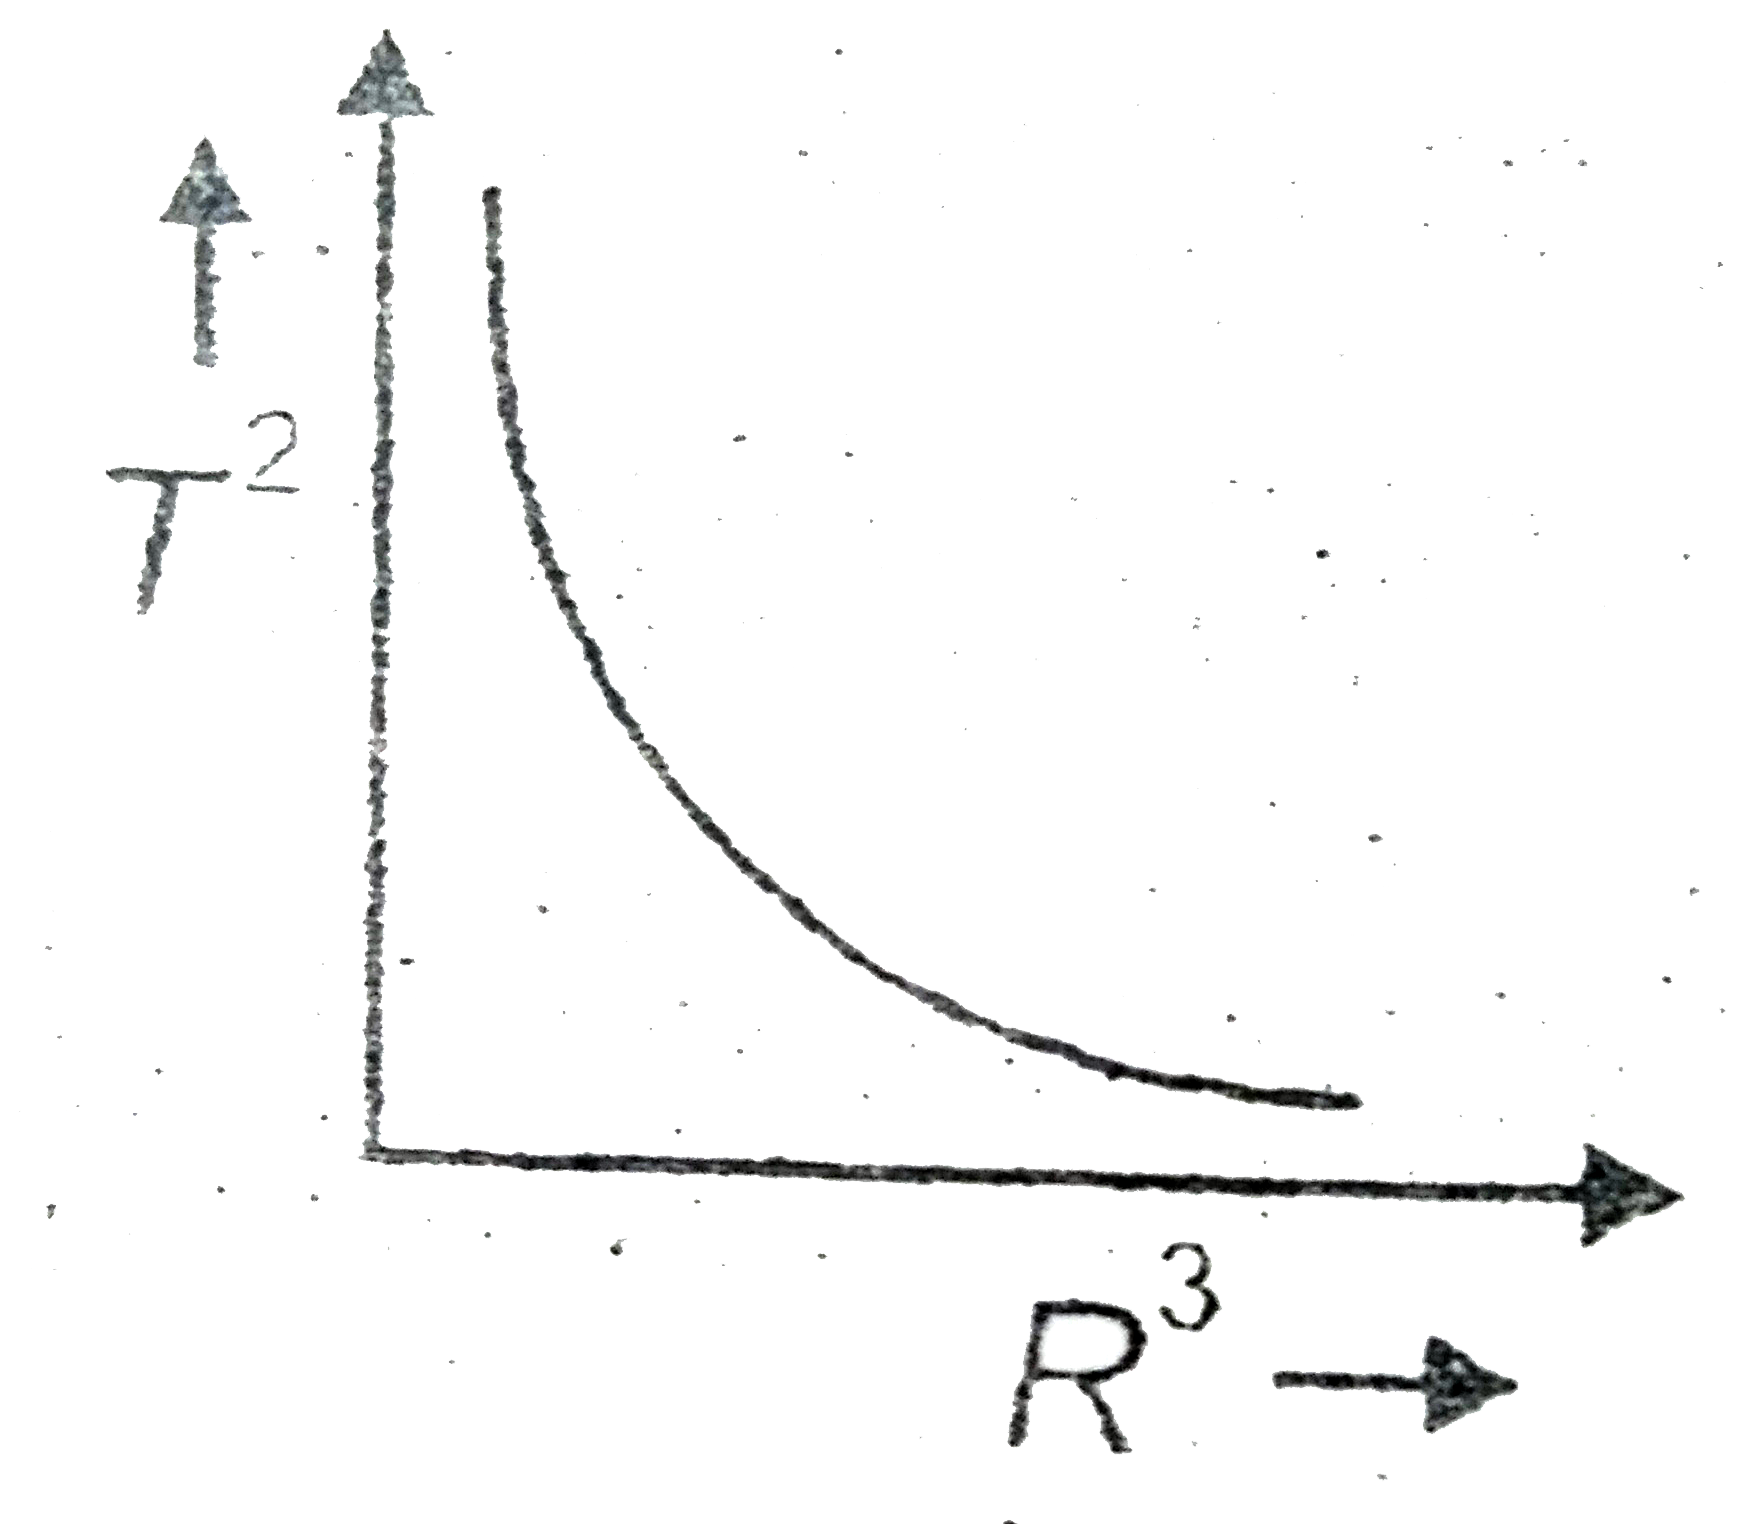
Which of the following graphs between the square of the time period and cube of the distance of the planet from the sun is correct ?


The correct Answer is:B
To solve the question regarding the relationship between the square of the time period (T²) and the cube of the distance (r³) of a planet from the sun, we can follow these steps:
1. Understand Kepler's Third Law:
According to Kepler's Third Law of planetary motion, the square of the time period (T) of a planet is directly proportional to the cube of the semi-major axis (r) of its orbit. This can be mathematically expressed as:
T2∝r3
2. Express the Proportionality as an Equation:
We can convert the proportionality into an equation by introducing a constant of proportionality (k):
T2=k⋅r3
3. Identify the Variables:
Here, we can identify:
- y=T2 (the square of the time period)
- x=r3 (the cube of the distance from the sun)
4. Graphical Representation:
Since T2 is directly proportional to r3, we can say:
y=k⋅x
This indicates that if we plot y (T²) on the y-axis and x (r³) on the x-axis, the graph will be a straight line passing through the origin.
5. Conclusion:
The correct graph between the square of the time period and the cube of the distance of the planet from the sun will be a straight line inclined to the x-axis. Therefore, the correct option is the one that represents this linear relationship.
According to Kepler's Third Law of planetary motion, the square of the time period (T) of a planet is directly proportional to the cube of the semi-major axis (r) of its orbit. This can be mathematically expressed as:
T2∝r3
We can convert the proportionality into an equation by introducing a constant of proportionality (k):
T2=k⋅r3
Here, we can identify:
- y=T2 (the square of the time period)
- x=r3 (the cube of the distance from the sun)
Since T2 is directly proportional to r3, we can say:
y=k⋅x
This indicates that if we plot y (T²) on the y-axis and x (r³) on the x-axis, the graph will be a straight line passing through the origin.
The correct graph between the square of the time period and the cube of the distance of the planet from the sun will be a straight line inclined to the x-axis. Therefore, the correct option is the one that represents this linear relationship.
Topper's Solved these Questions
- GRAVITATION BOOK - AAKASH INSTITUTE ENGLISHCHAPTER - GRAVITATION EXERCISE - ASSIGNMENT SECTION -B (Objective Type Questions (one option is correct))
20 Videos
- GRAVITATION BOOK - AAKASH INSTITUTE ENGLISHCHAPTER - GRAVITATION EXERCISE - ASSIGNMENT SECTION -C (Objective Type Questions (More than one option are correct))
12 Videos
- GRAVITATION BOOK - AAKASH INSTITUTE ENGLISHCHAPTER - GRAVITATION EXERCISE - Try Yourself
33 Videos
- ELECTROSTATIC POTENTIAL AND CAPACITANCE BOOK - AAKASH INSTITUTE ENGLISHCHAPTER - ELECTROSTATIC POTENTIAL AND CAPACITANCE EXERCISE - ASSIGNMENT SECTION - D
9 Videos
- KINETIC THEORYBOOK - AAKASH INSTITUTE ENGLISHCHAPTER - KINETIC THEORYEXERCISE - EXERCISE (ASSIGNMENT) SECTION - D Assertion - Reason Type Questions
10 Videos
Similar Questions
Which of the following graph between (x/m) vs P is correct?
View SolutionWhich of the following is the graph between the height (h) of a projectile and time (t), when it is projected from the ground
View SolutionThe graph between the length and square of the period of a simple pendulum is a
View SolutionWhich of the following x-t graphs represents the distance-time variation of a body released from the top of a buiding?
View SolutionWhich of the following graphs represents the motion of the planet moving about the Sun. T is the periode of revolution and r is the average distance (from centre to centre) between the sun and the planet
View SolutionWhich of the following distance time graphs is possible ?
View SolutionWhich of the following statements are correct about a planet revolving around Sun ?
View SolutionThe time of revolution of planet A round the sun is 8 times that of another planet B. The distance of planet A from the sun is how many times the distance of B from the sun
View SolutionFor a uniformly charged non conducting sphere of radius R which of following shows a correct graph between the electric field intensity and the distance from the centre of sphere –
View SolutionWhich of the following graph is correct between kinetic energy E, potential energy (U) and height (h) from the ground of the partical
View Solution
