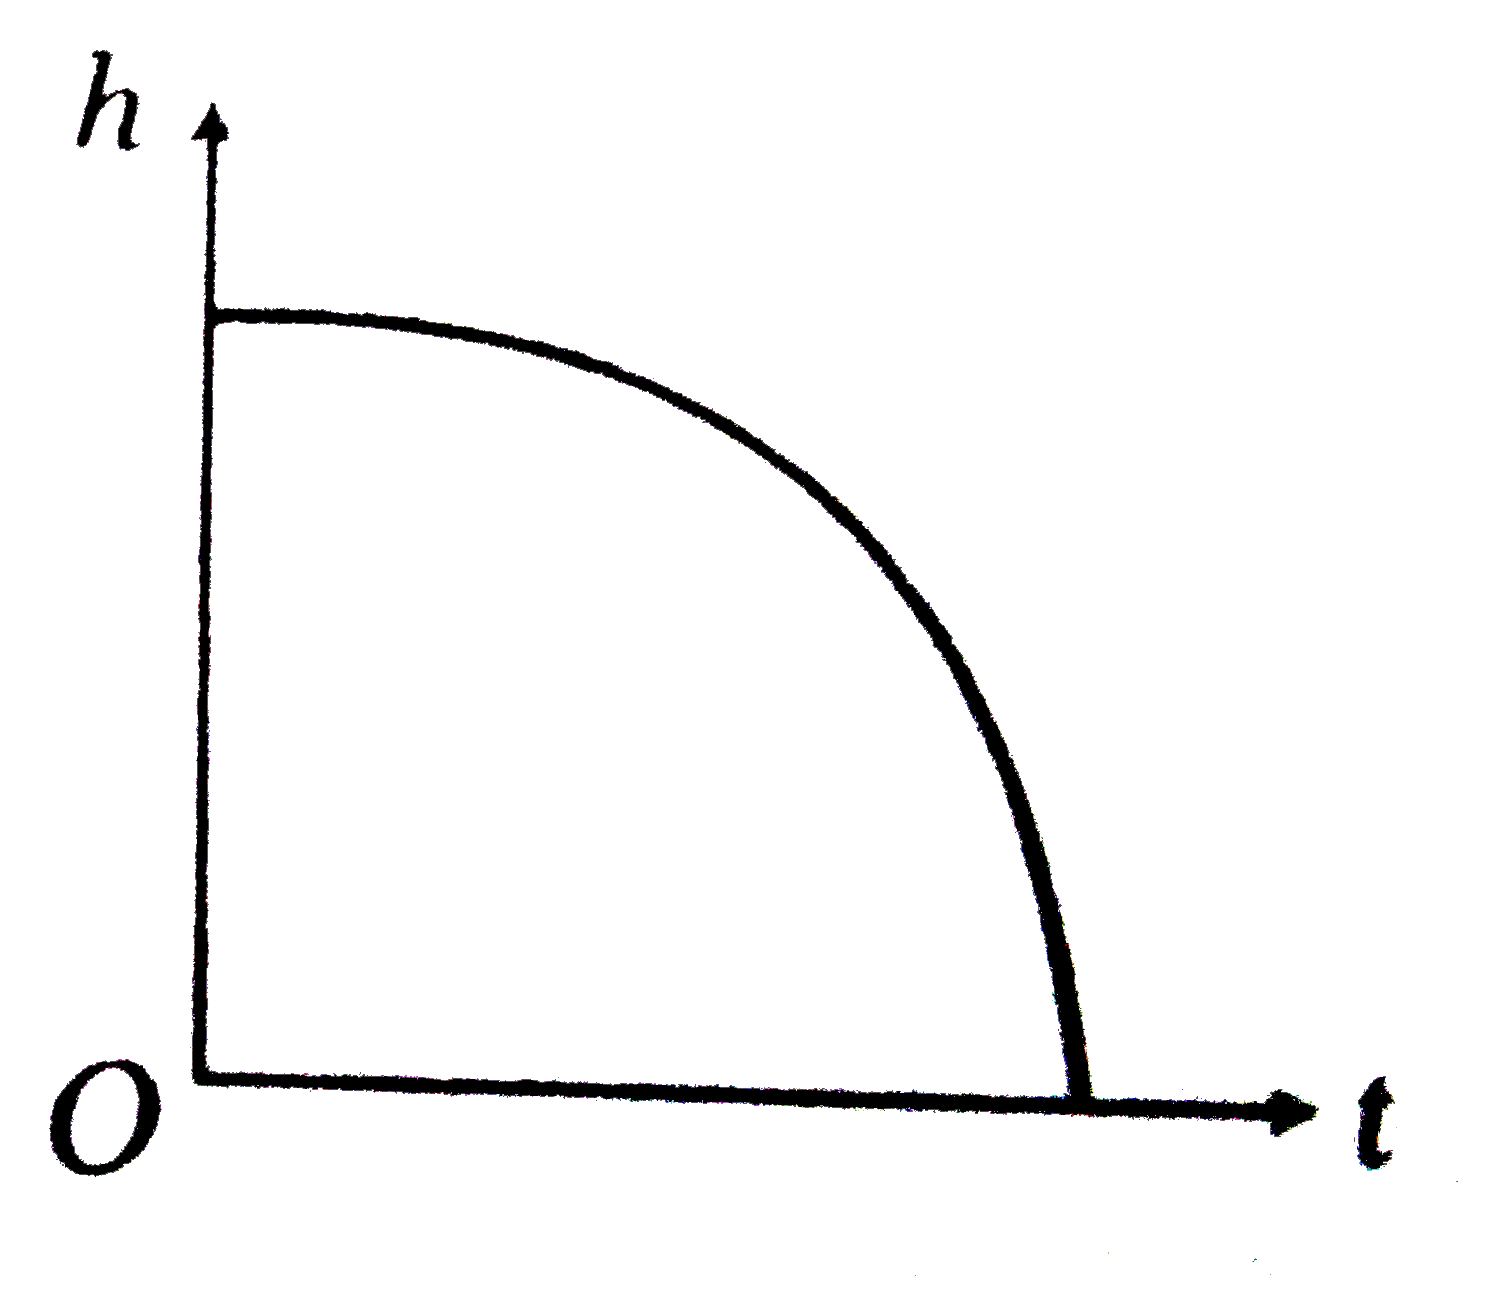
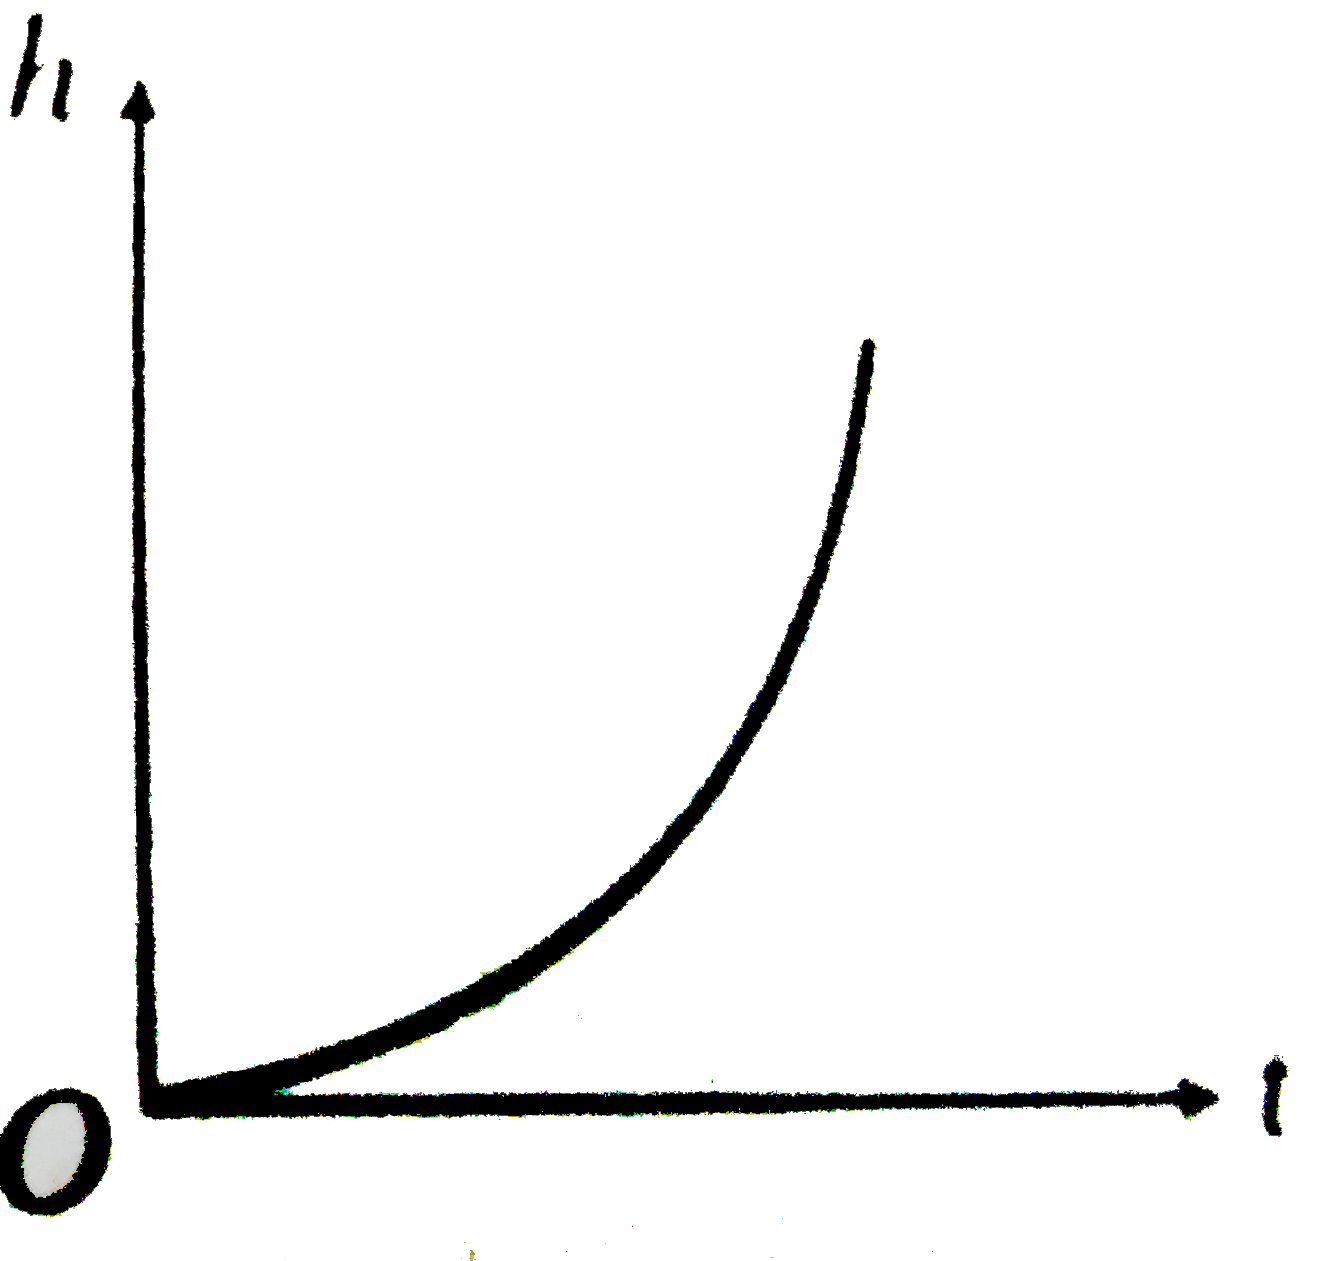
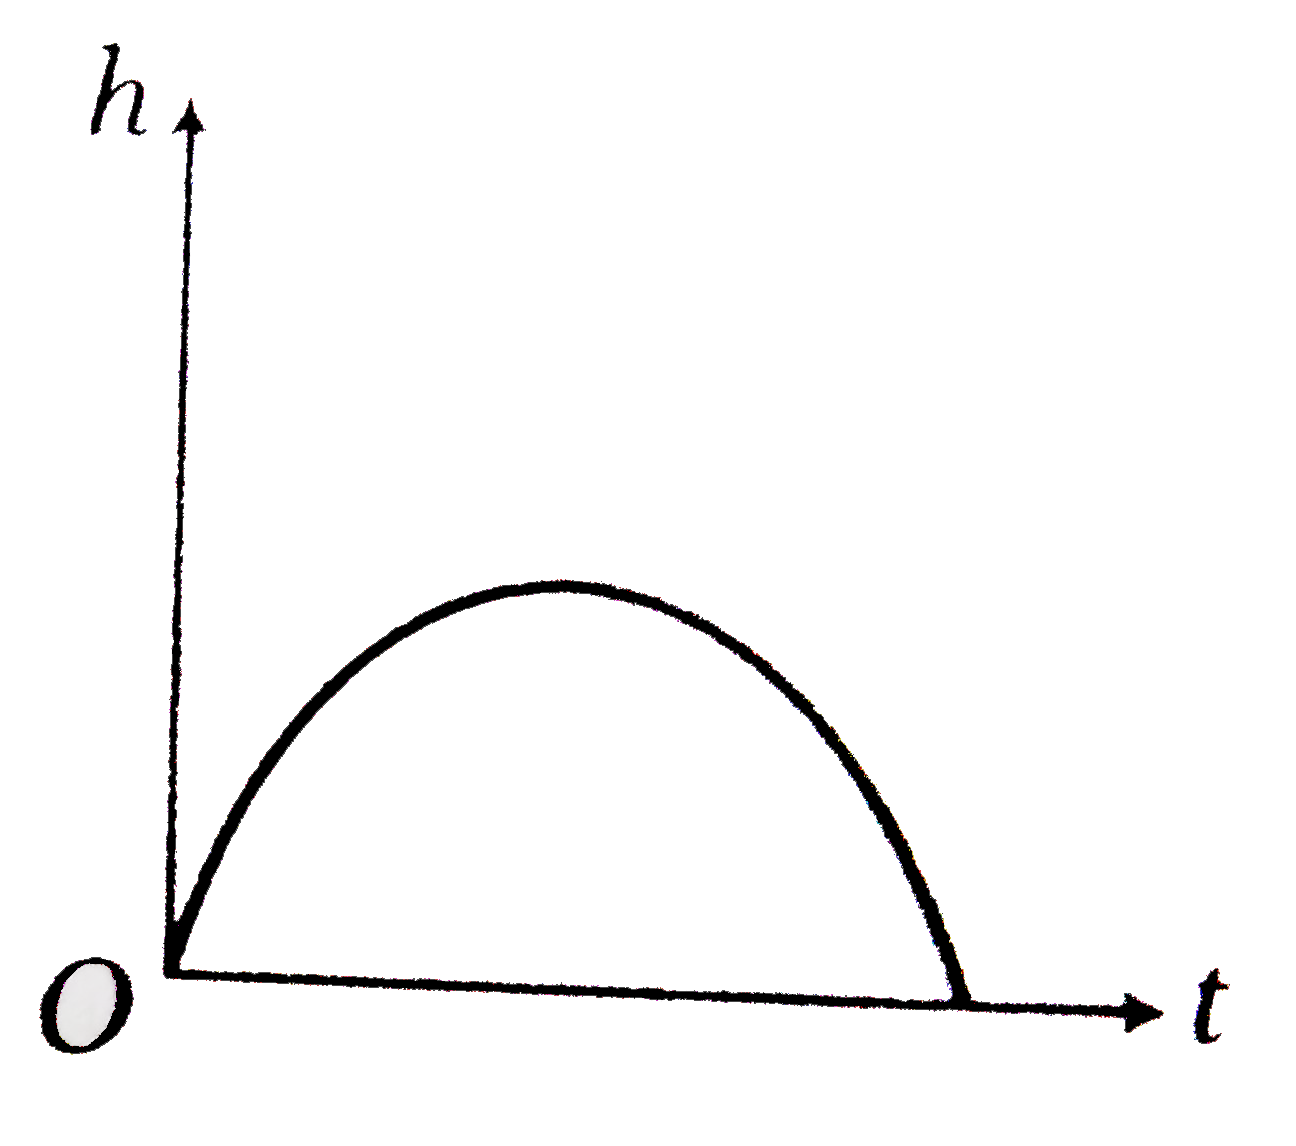
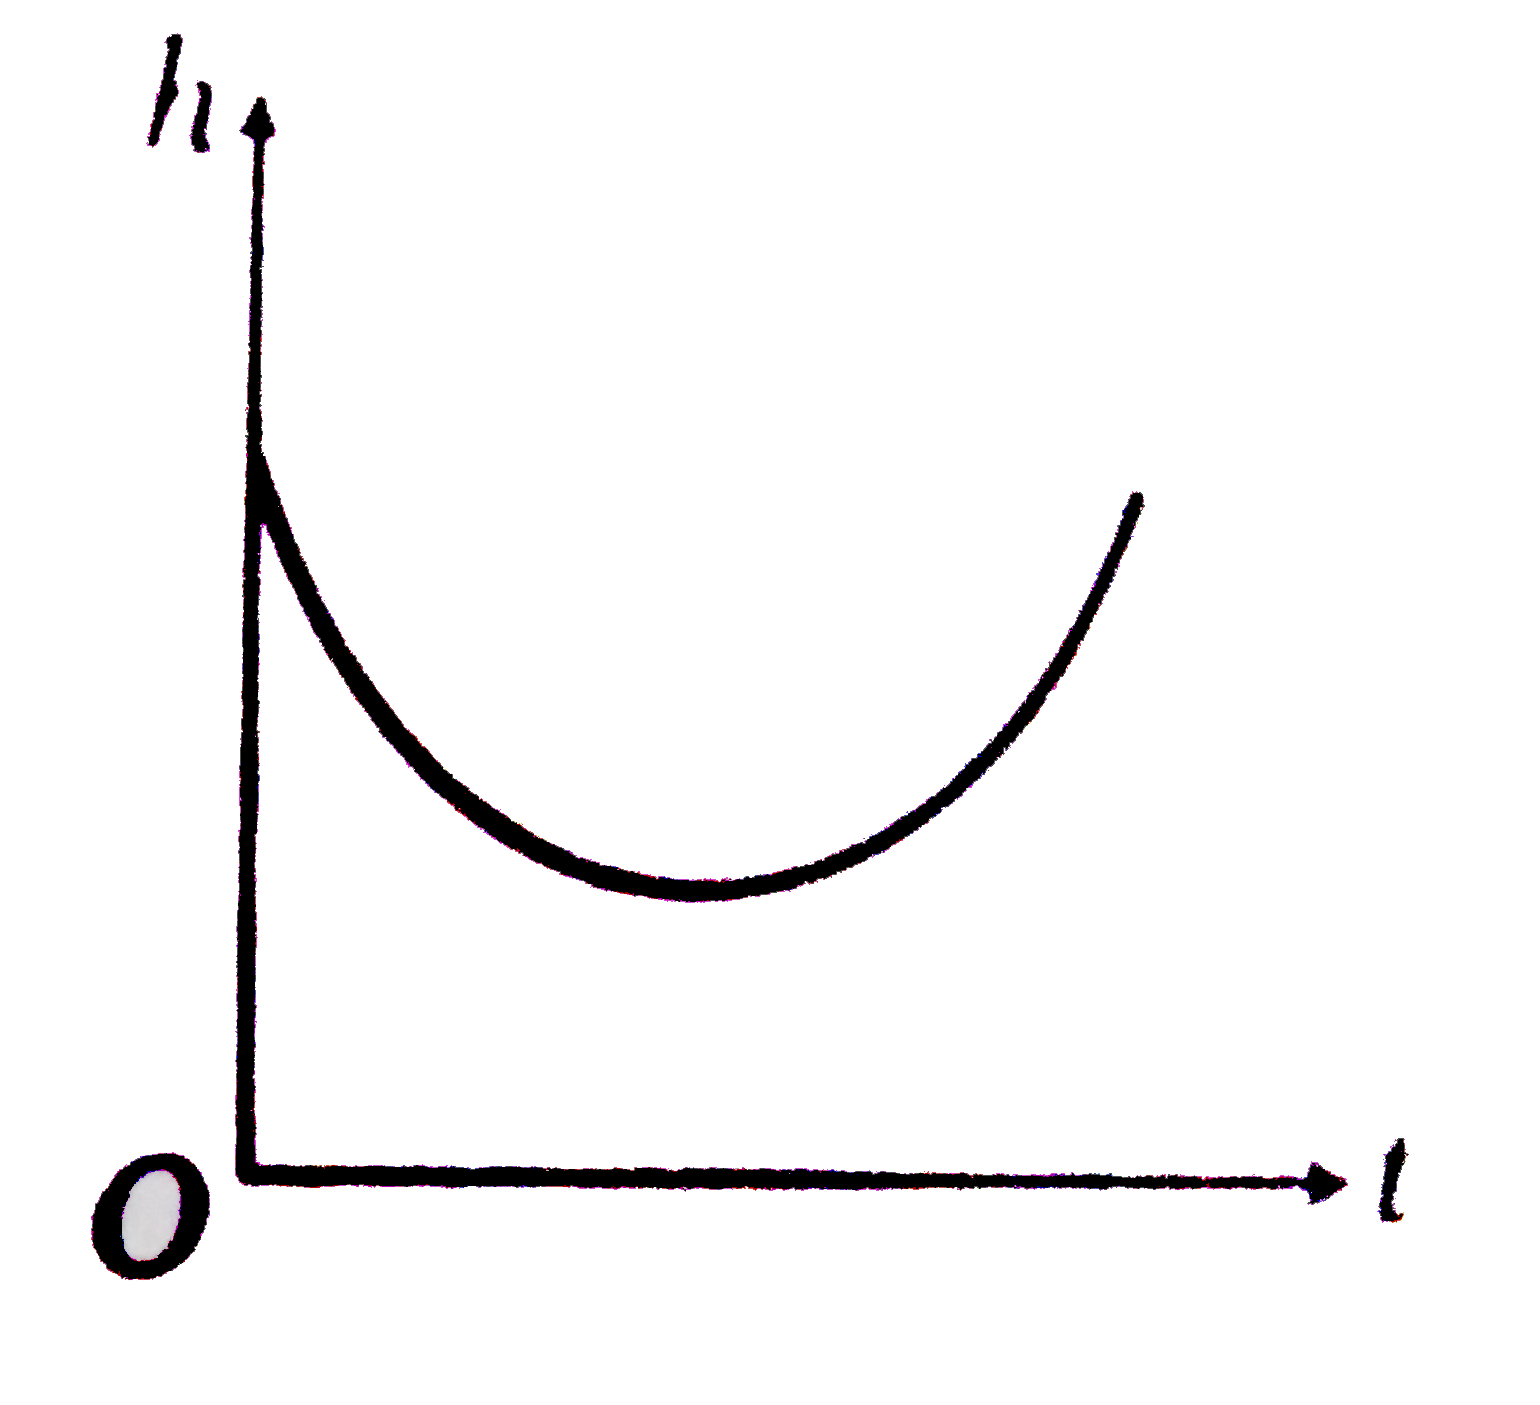
Which of the following is the graph between the height (h) of a projectile and time (t), when it is projected from the ground


The correct Answer is:C
To determine the graph between the height (h) of a projectile and time (t) when it is projected from the ground, we can analyze the motion of the projectile step by step.
1. Understanding Projectile Motion:
- When a projectile is launched from the ground, it follows a parabolic trajectory. Initially, it rises to a maximum height and then falls back to the ground.
2. Initial Conditions:
- At time t=0, the height h=0 since the projectile is launched from the ground.
3. Equation of Motion:
- The height h of the projectile at any time t can be described by the equation:
h(t)=uyt−12gt2
- Where:
- uy=u0sin(α) is the initial vertical component of the velocity.
- g is the acceleration due to gravity (acting downwards).
4. Behavior of the Height with Time:
- As time increases from t=0, the height h increases until it reaches the maximum height.
- After reaching the maximum height, the height h starts to decrease until it returns to the ground (height h=0).
5. Graph Characteristics:
- The graph starts at the origin (0,0).
- It rises to a peak (maximum height) and then falls back to the horizontal axis (height = 0).
- This behavior indicates that the graph is a concave down parabola.
6. Analyzing Options:
- We need to identify which option represents this behavior:
- Option 1: Incorrect, as it does not start from (0,0).
- Option 2: Incorrect, as it does not decrease after reaching a maximum.
- Option 3: Correct, as it starts at (0,0), increases, and then decreases back to (0,0).
- Option 4: Incorrect, as it does not start from (0,0).
Conclusion:
The correct graph representing the height of a projectile as a function of time, when projected from the ground, is represented by Option 3.
- When a projectile is launched from the ground, it follows a parabolic trajectory. Initially, it rises to a maximum height and then falls back to the ground.
- At time t=0, the height h=0 since the projectile is launched from the ground.
- The height h of the projectile at any time t can be described by the equation:
h(t)=uyt−12gt2
- Where:
- uy=u0sin(α) is the initial vertical component of the velocity.
- g is the acceleration due to gravity (acting downwards).
- As time increases from t=0, the height h increases until it reaches the maximum height.
- After reaching the maximum height, the height h starts to decrease until it returns to the ground (height h=0).
- The graph starts at the origin (0,0).
- It rises to a peak (maximum height) and then falls back to the horizontal axis (height = 0).
- This behavior indicates that the graph is a concave down parabola.
- We need to identify which option represents this behavior:
- Option 1: Incorrect, as it does not start from (0,0).
- Option 2: Incorrect, as it does not decrease after reaching a maximum.
- Option 3: Correct, as it starts at (0,0), increases, and then decreases back to (0,0).
- Option 4: Incorrect, as it does not start from (0,0).
The correct graph representing the height of a projectile as a function of time, when projected from the ground, is represented by Option 3.
Topper's Solved these Questions
- MOTIONBOOK - DC PANDEY ENGLISHCHAPTER - MOTIONEXERCISE - B. Medical entrance
1 Videos
- MOTIONBOOK - DC PANDEY ENGLISHCHAPTER - MOTIONEXERCISE - Medical entrance
12 Videos
- MOTIONBOOK - DC PANDEY ENGLISHCHAPTER - MOTIONEXERCISE - A. Taking it together
1 Videos
- MEASUREMENT AND ERRORSBOOK - DC PANDEY ENGLISHCHAPTER - MEASUREMENT AND ERRORSEXERCISE - Subjective
19 Videos
- MOTION IN A PLANEBOOK - DC PANDEY ENGLISHCHAPTER - MOTION IN A PLANEEXERCISE - (C )Medical entrances gallery
32 Videos
Similar Questions
Knowledge Check
The relation between the time of flight of projectile Tf and the time to reach the maximum height tm is
ATf=2tmBTf=tmCTf=tm2DTf=√2(tm)The height of a boulder launched from a Roman catap can be described as a function of time according to the following quadratic equation: h(t)=−16t2+224t+240.
How much time elapese between the moment the boulder is launched and the moment it hits the ground, assuming that the ground is at a height of 0 ?A7B12C14D15
In a projectile motion, if we plot a graph between power of the force acting on the projectile and time, then it would be like
View SolutionThe horizontal range and the maximum height of a projectile are equal. The angle of projection of the projectile is
View SolutionA batsman hits a sixes and the ball touches the ground outside the cricket ground. Which of the following graph describes the variation of the cricket ball's vertical velocity v with time between the time t1 as it hits the bat and time t2 when it touches the ground?
View SolutionA ball falls from a height ‘h’ and collides with the ground. Each time it collides, its velocity is halved. Which of the following graphs are correct? Here t, v and y represent time, velocity and height above ground respectively. (vertically upwards direction is taken as positive and ground as y = 0)
View SolutionThere are two identical particles A and B. One is projected vertically upward with speed √2gh from ground and other is dropped from height h along the same vertical line. Collision between them is perfectly inelastic. Find time taken by them to reach the ground after collision in terms of √hg.
View SolutionA stone projected from ground with certain speed at an angle θ with horizontal attains maximum height h1 when it is projected with same speed at an angle θ with vertical attains height h2. The horizontal range of projectile is
View Solution
