A sample of gas goes through a process shown in graph. Arrange the volume of given points in increasing order
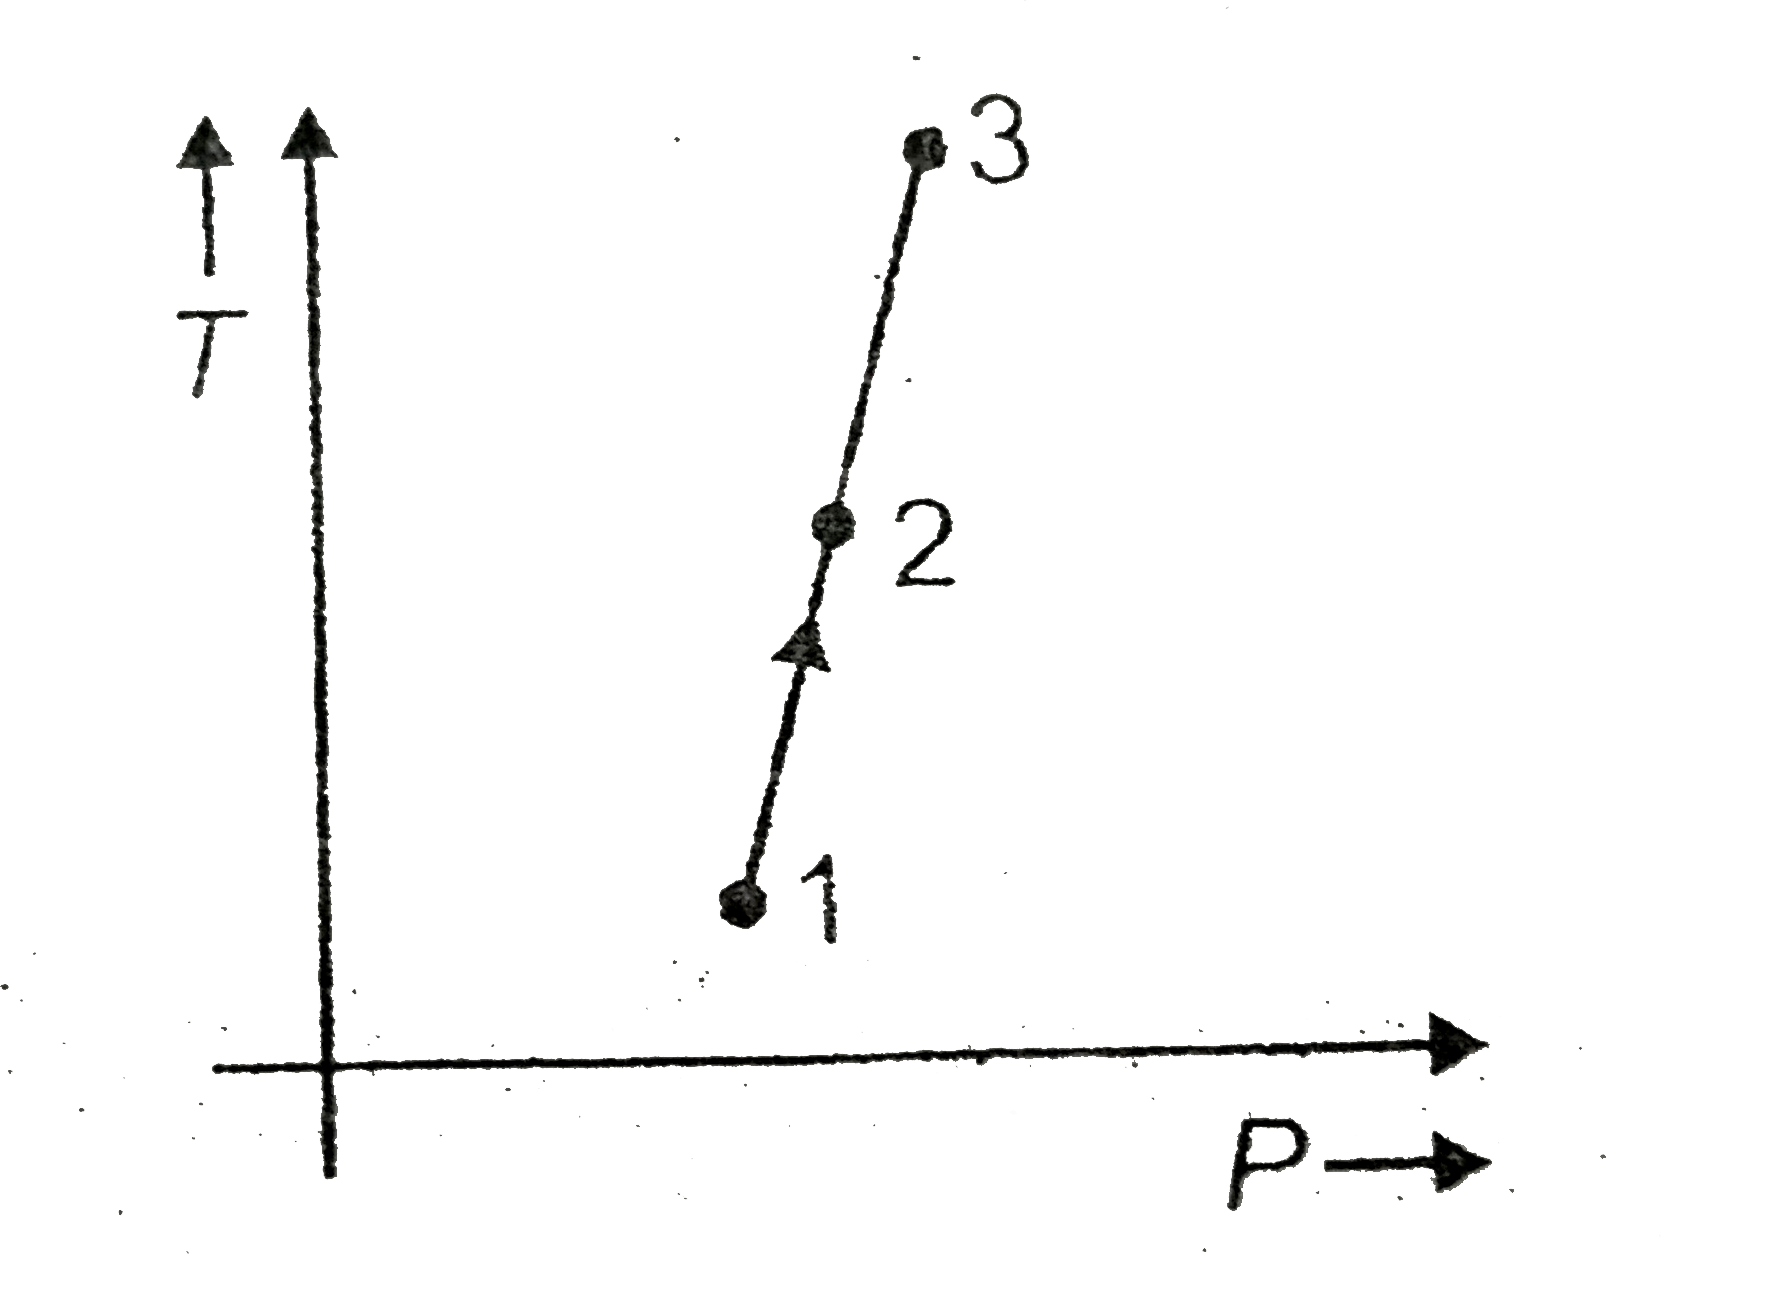
V1>V2>V3
V1>V2=V3
V3>V2>V1
V3>V2=V1
The correct Answer is:C
Step by step video & image solution for A sample of gas goes through a process shown in graph. Arrange the volume of given points in increasing order by Physics experts to help you in doubts & scoring excellent marks in Class 12 exams.
Updated on:21/07/2023Topper's Solved these Questions
- THERMODYNAMICSBook:AAKASH INSTITUTE ENGLISHChapter:THERMODYNAMICSExercise:Assignment (Section-C) Objective Type Questions (More than one option are correct)
Explore 11 Videos
- THERMODYNAMICSBook:AAKASH INSTITUTE ENGLISHChapter:THERMODYNAMICSExercise:Assignment (Section-D) Linked comprehension Type questions
Explore 3 Videos
- THERMODYNAMICSBook:AAKASH INSTITUTE ENGLISHChapter:THERMODYNAMICSExercise:Assignment (Section-A) Objective Type Questions (one option is correct)
Explore 50 Videos
- THERMAL PROPERTIES OF MATTERBook:AAKASH INSTITUTE ENGLISHChapter:THERMAL PROPERTIES OF MATTERExercise:Assignment (Section-J) Akash Challengers Questions
Explore 7 Videos
- UNITS AND MEASUREMENTSBook:AAKASH INSTITUTE ENGLISHChapter:UNITS AND MEASUREMENTSExercise:ASSIGNMENT (SECTION - D)
Explore 15 Videos
Similar Questions
Ideal gas is taken through the process shown in the figure :
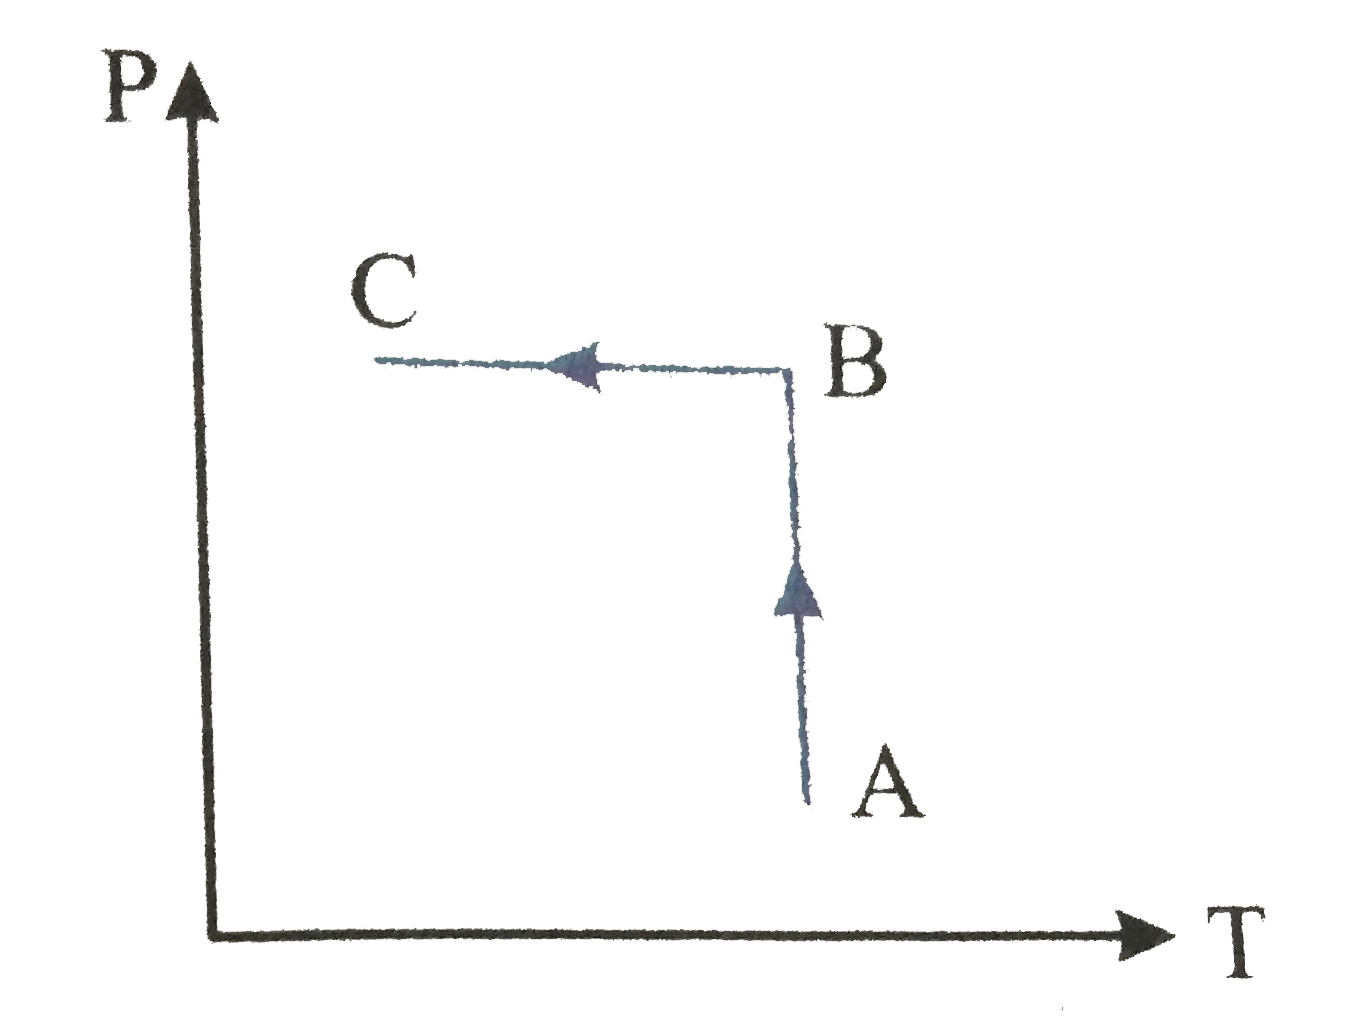
View SolutionIdeal gas is taken through the process shown in the figure :

View SolutionArrange the given halogens in increasing order of boiling points.
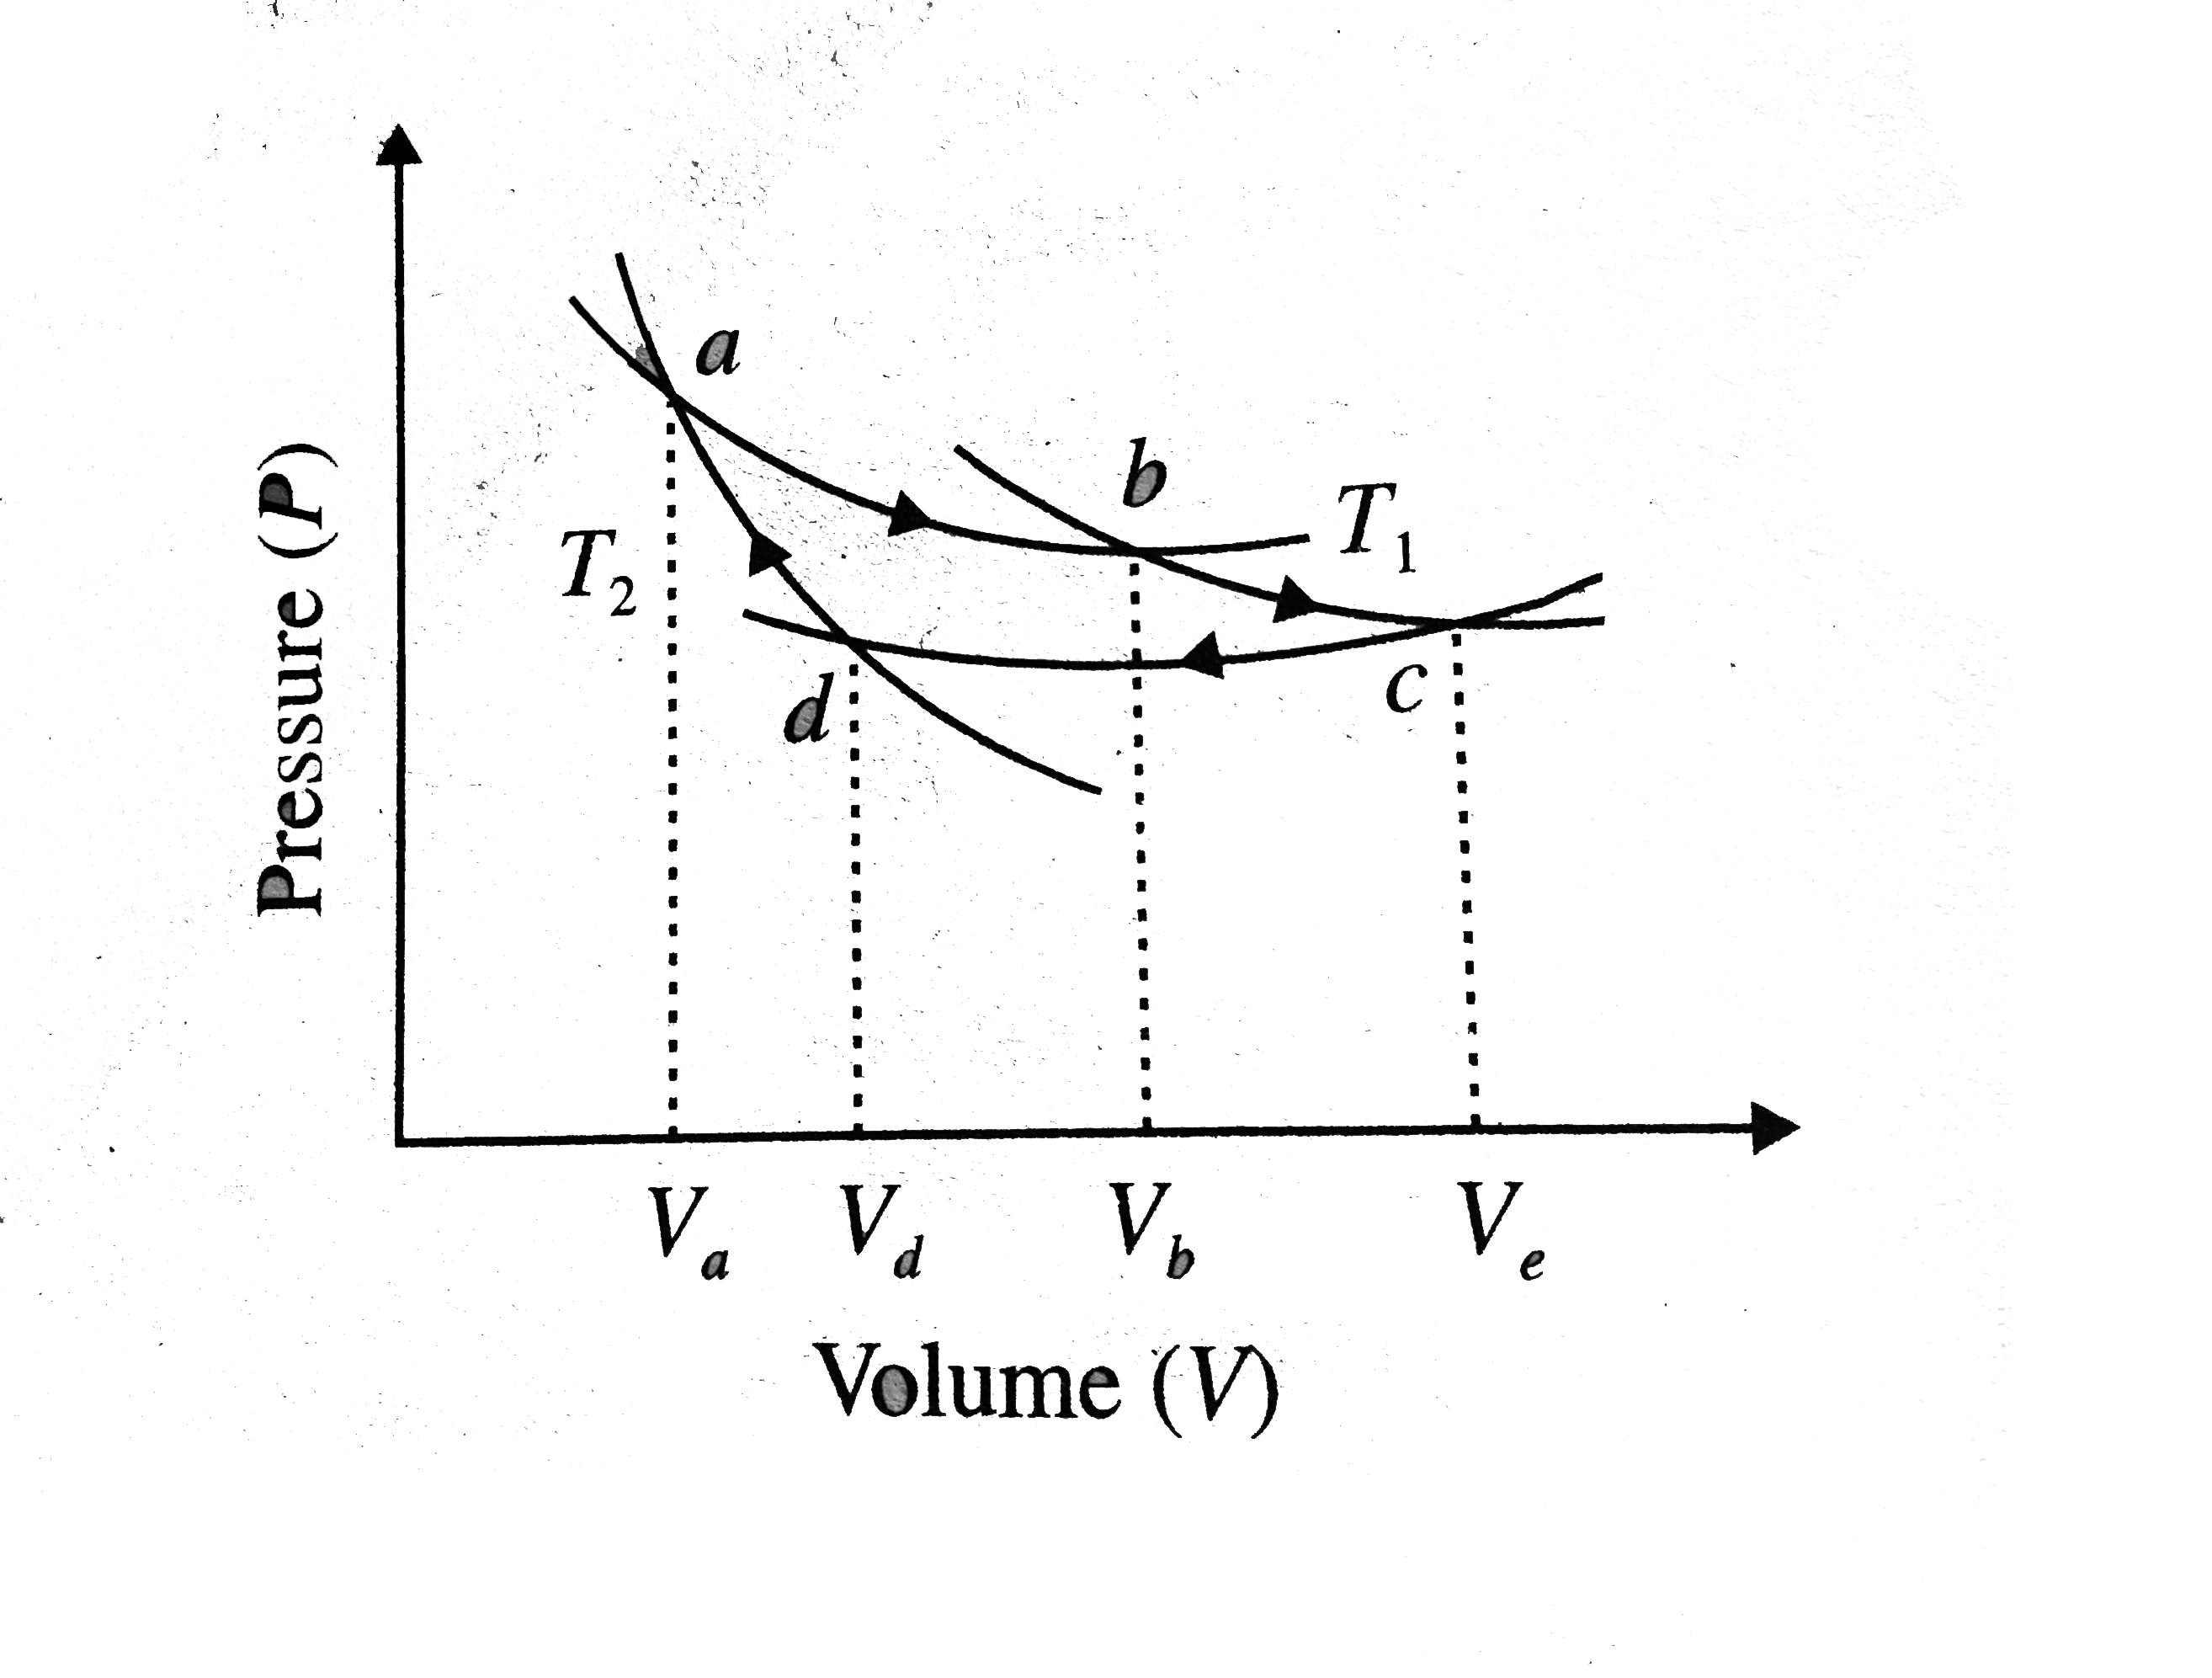
View SolutionAn ideal gas undergoes the cyclic process shown in a graph below :
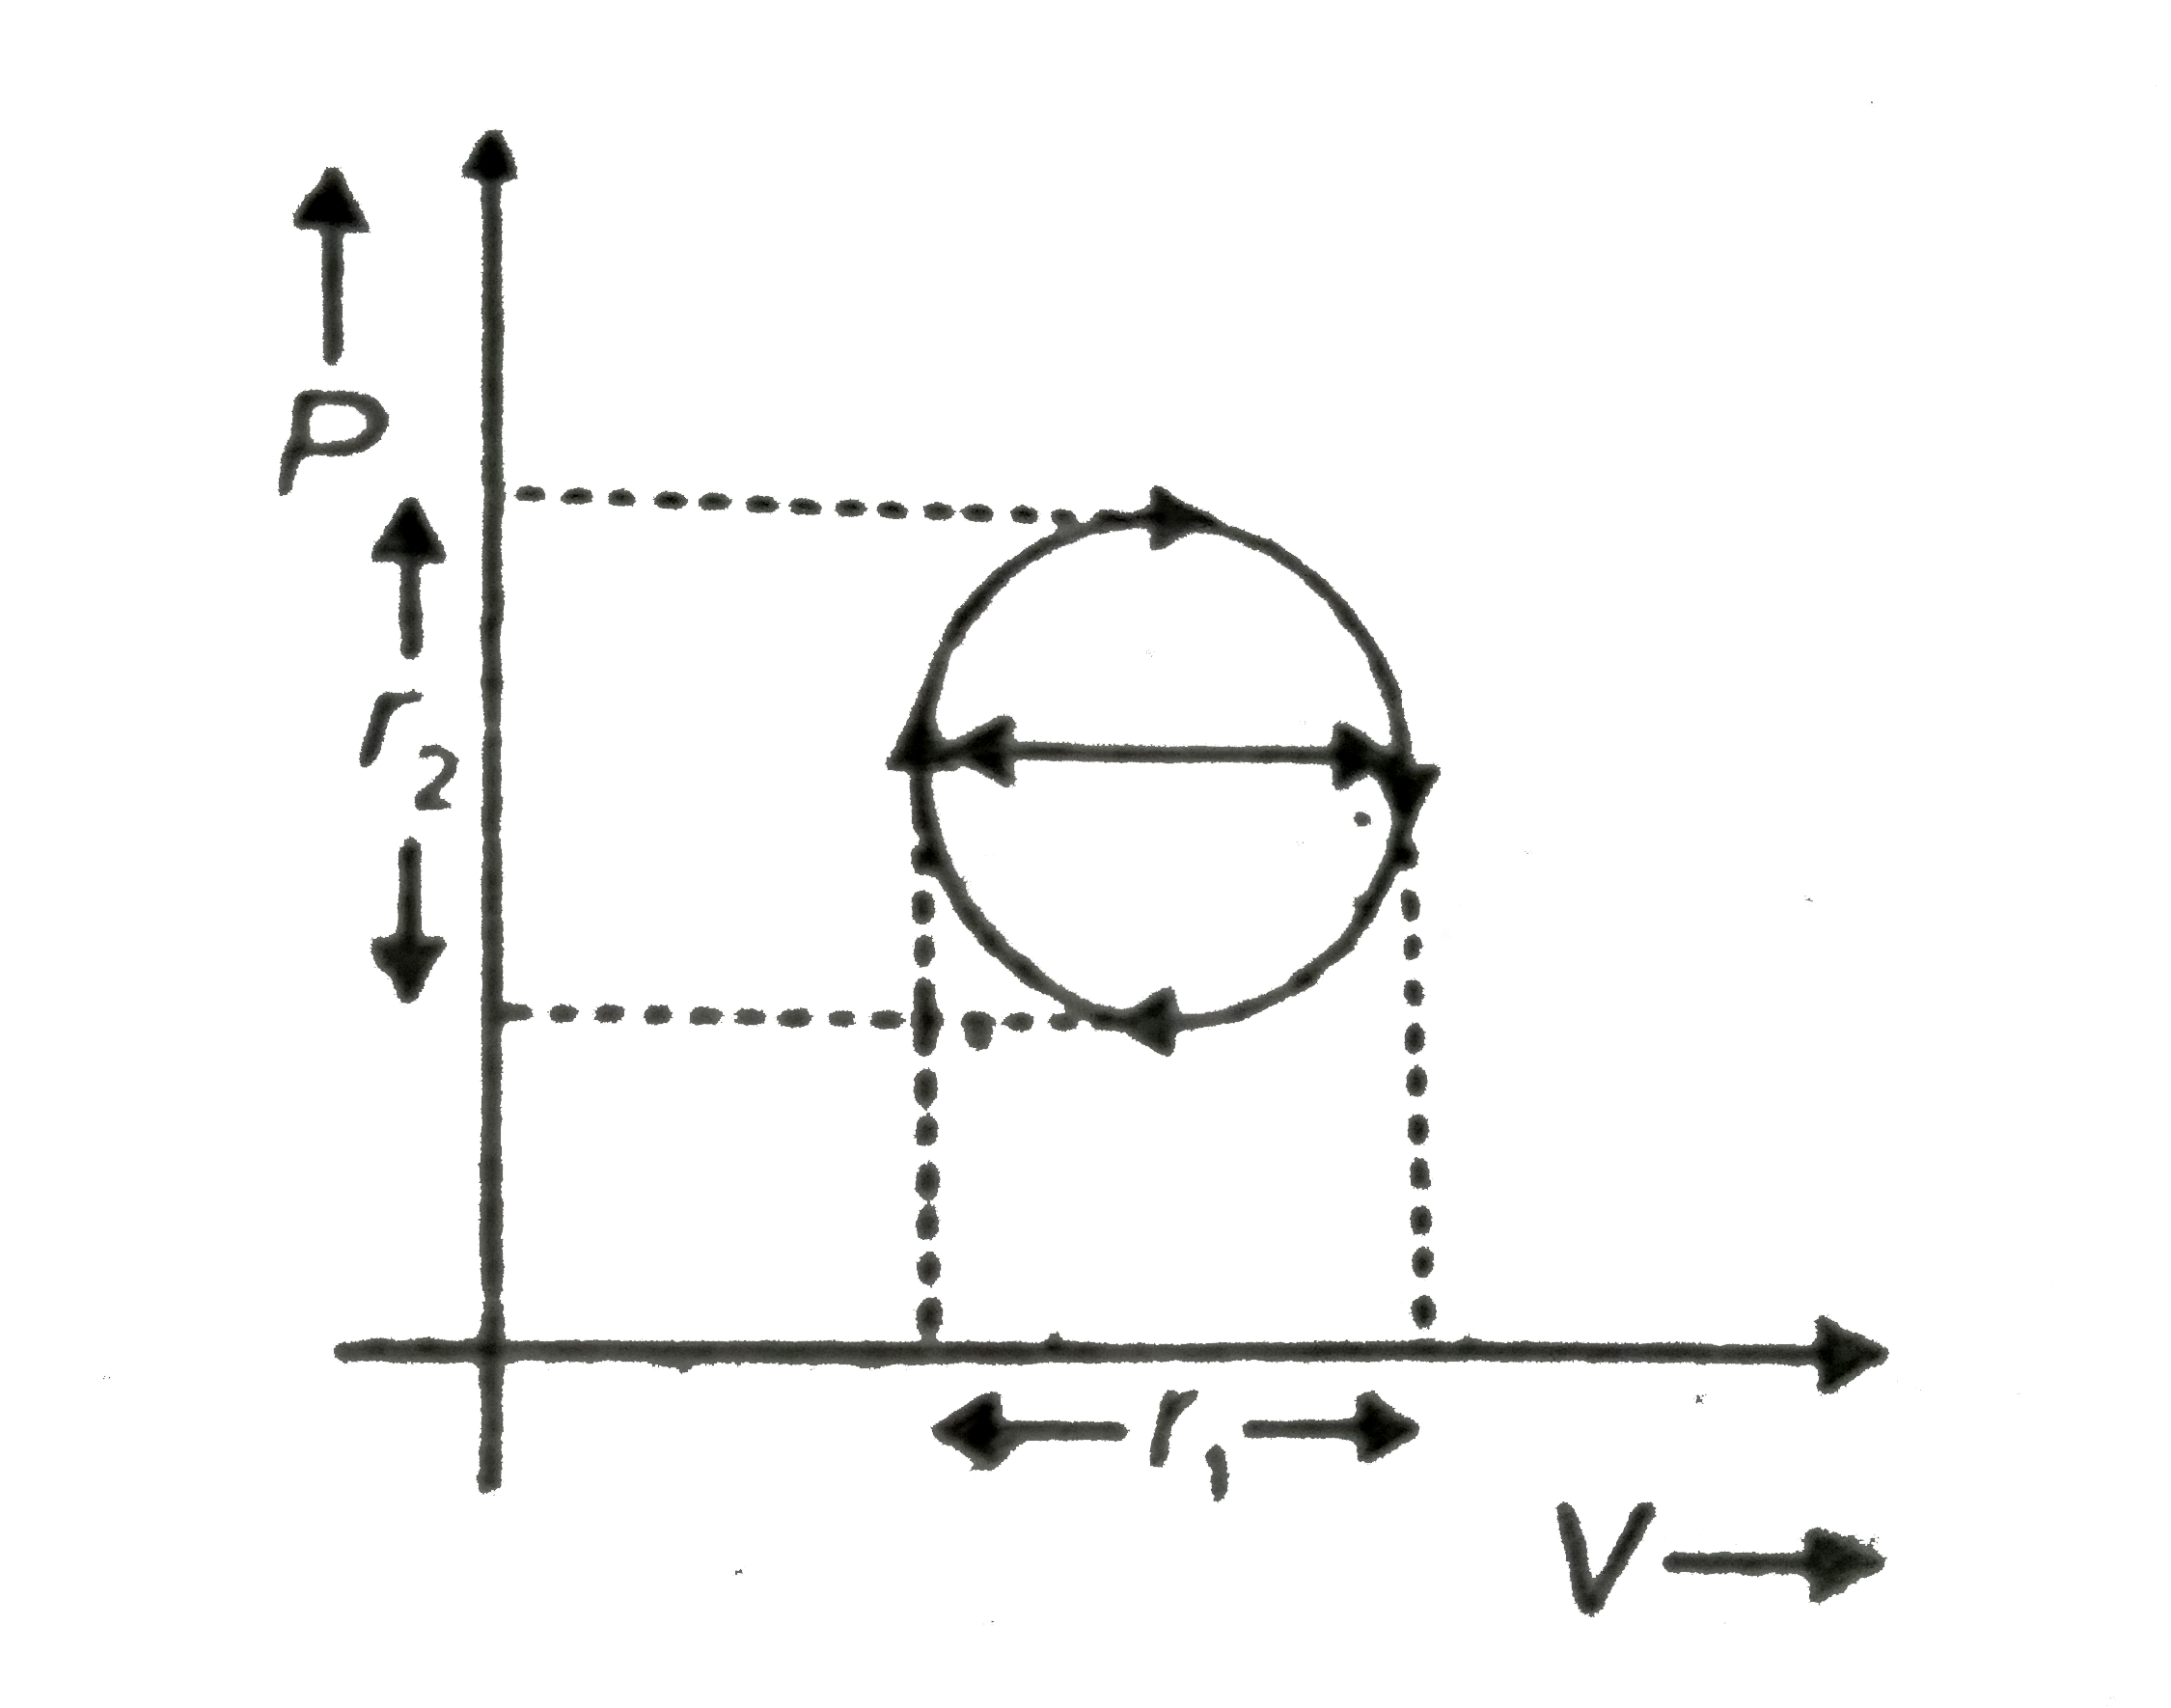
View SolutionA sample of gas is going through cyclic process, work done by gas is
View SolutionArrange the given species in the increasing order of acidic strength
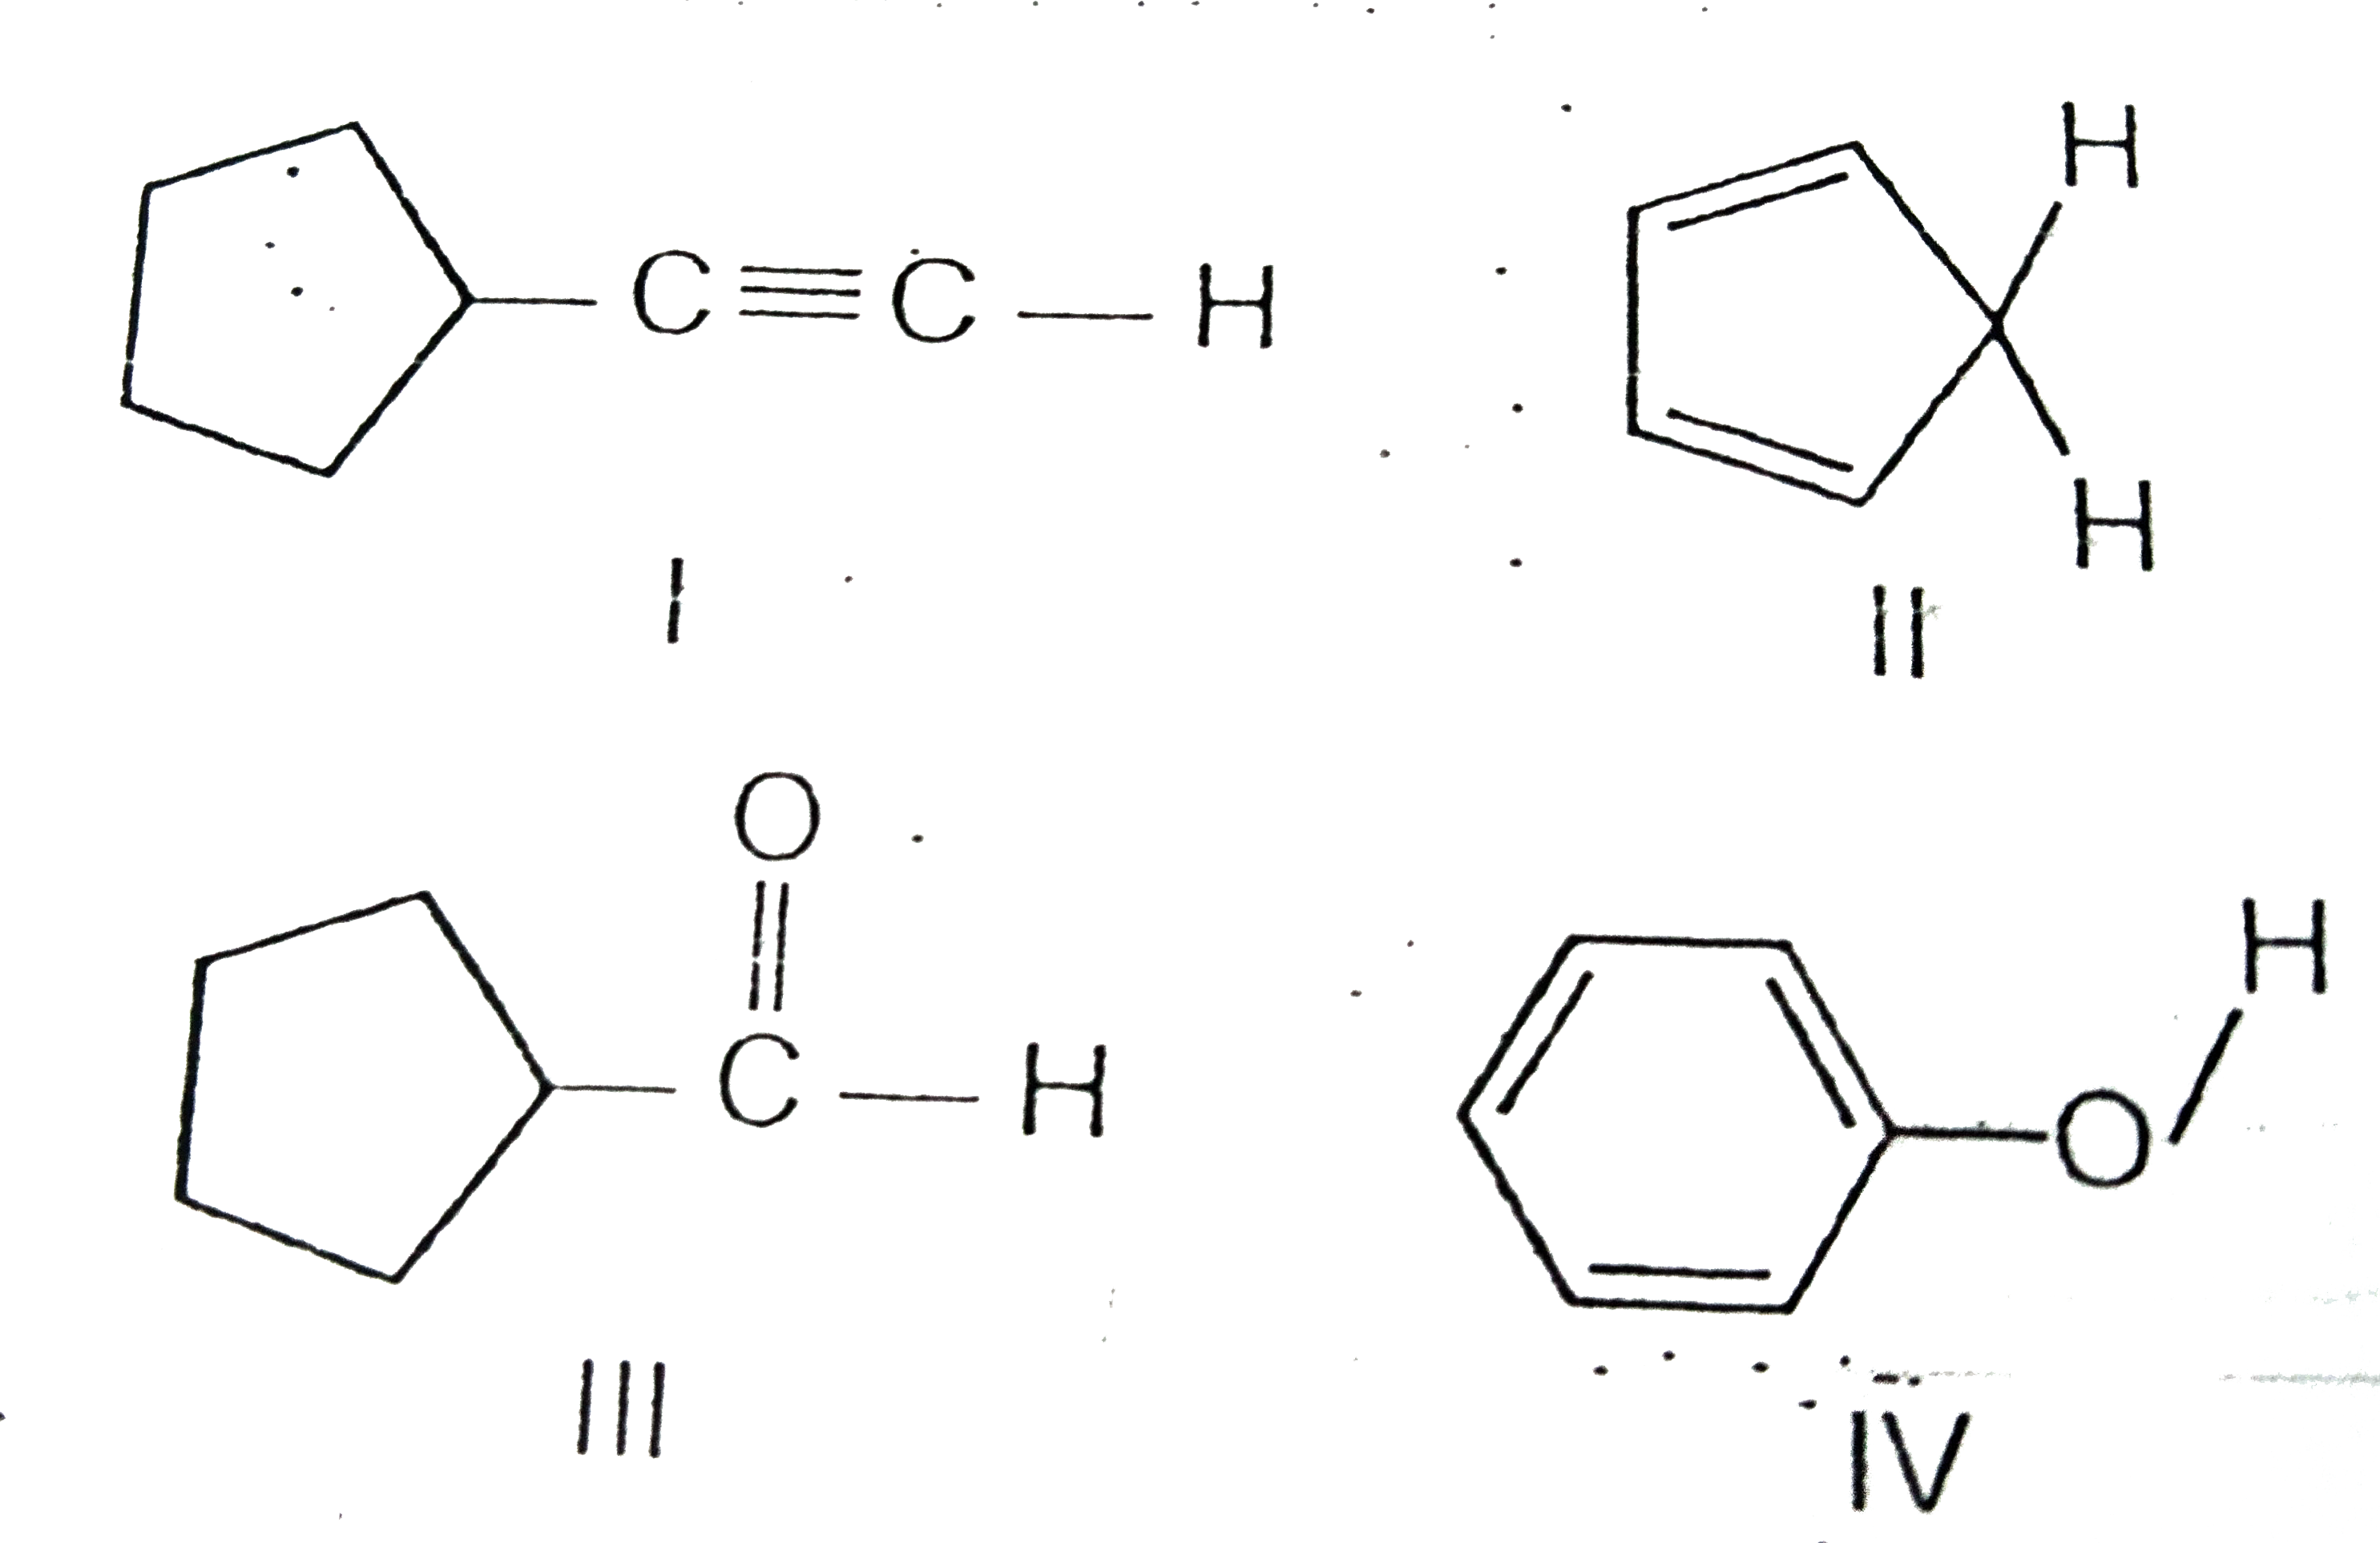
View SolutionArrange the following in the increasing order of their acidity.

View SolutionA sample of ideal gas is taken through the cyclic process shown in the figure. The temerauture of the gas in state A is TA =200 K. In states B and C the temperature of the gas is the same.
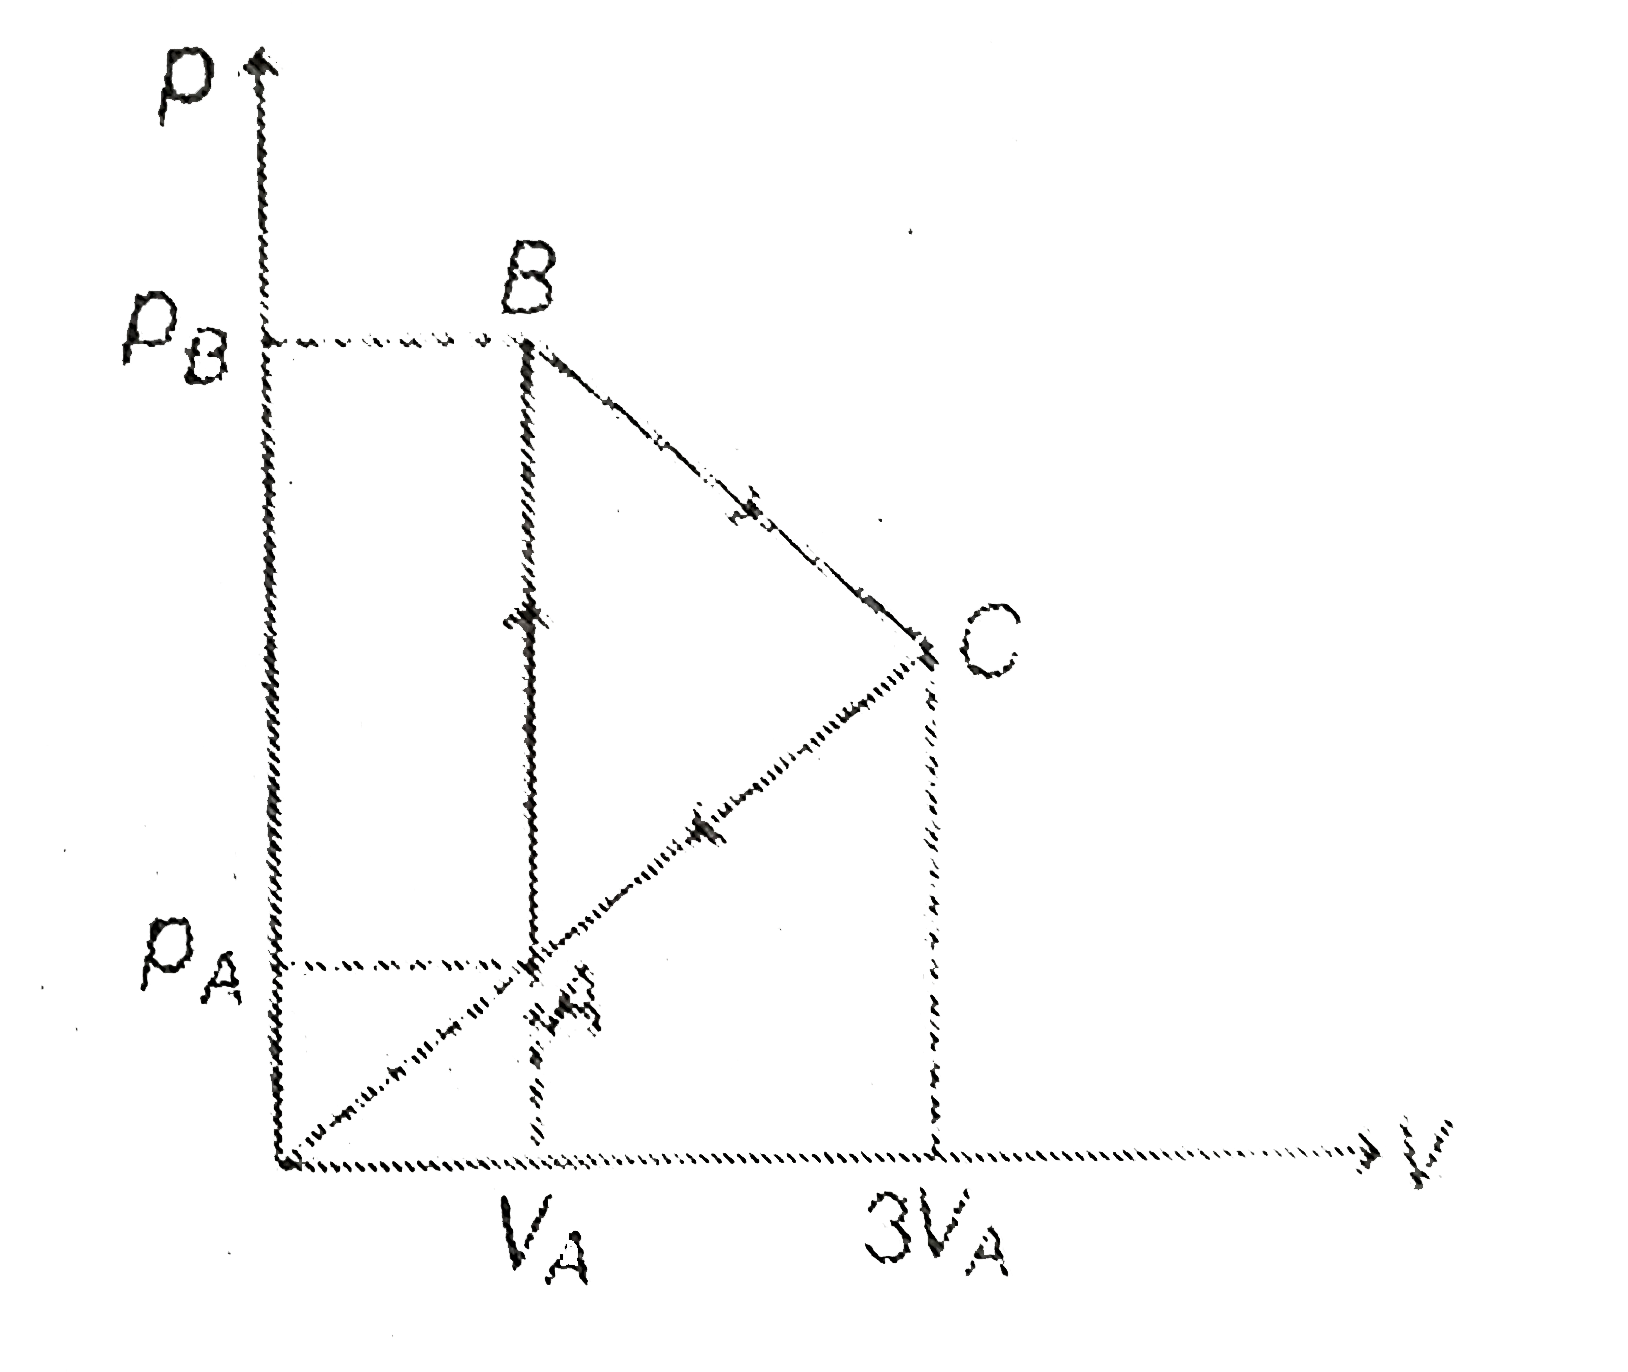
Net work done by the gas in the process is
View SolutionA sample of ideal gas is taken through the cyclic process shown in the figure. The temerauture of the gas in state A is TA =200 K. In states B and C the temperature of the gas is the same.
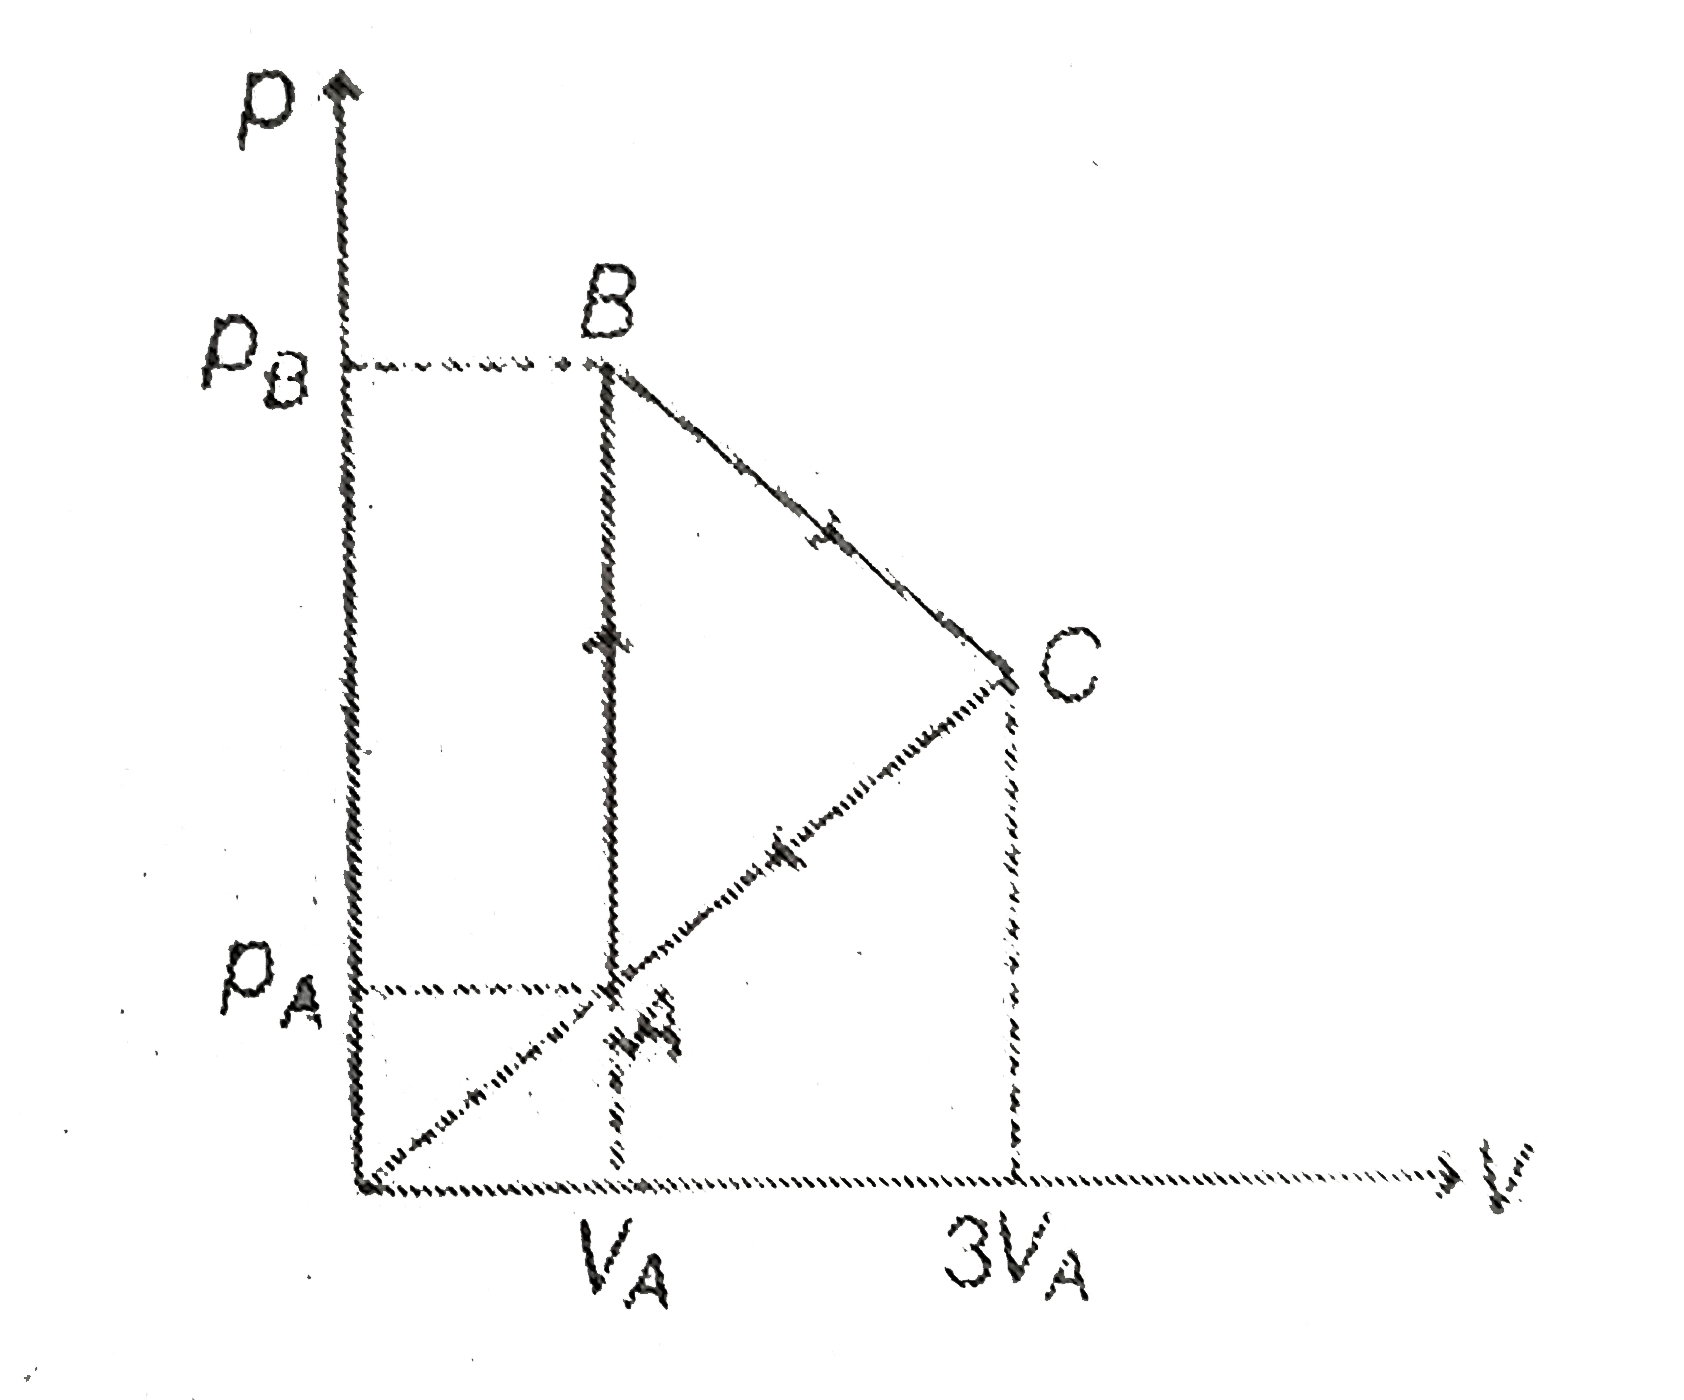
Which of the following graphs best reprsent the cyclic process in T-V diagram
View SolutionArrange the following compounds in increasing order of their boiling points
View Solution