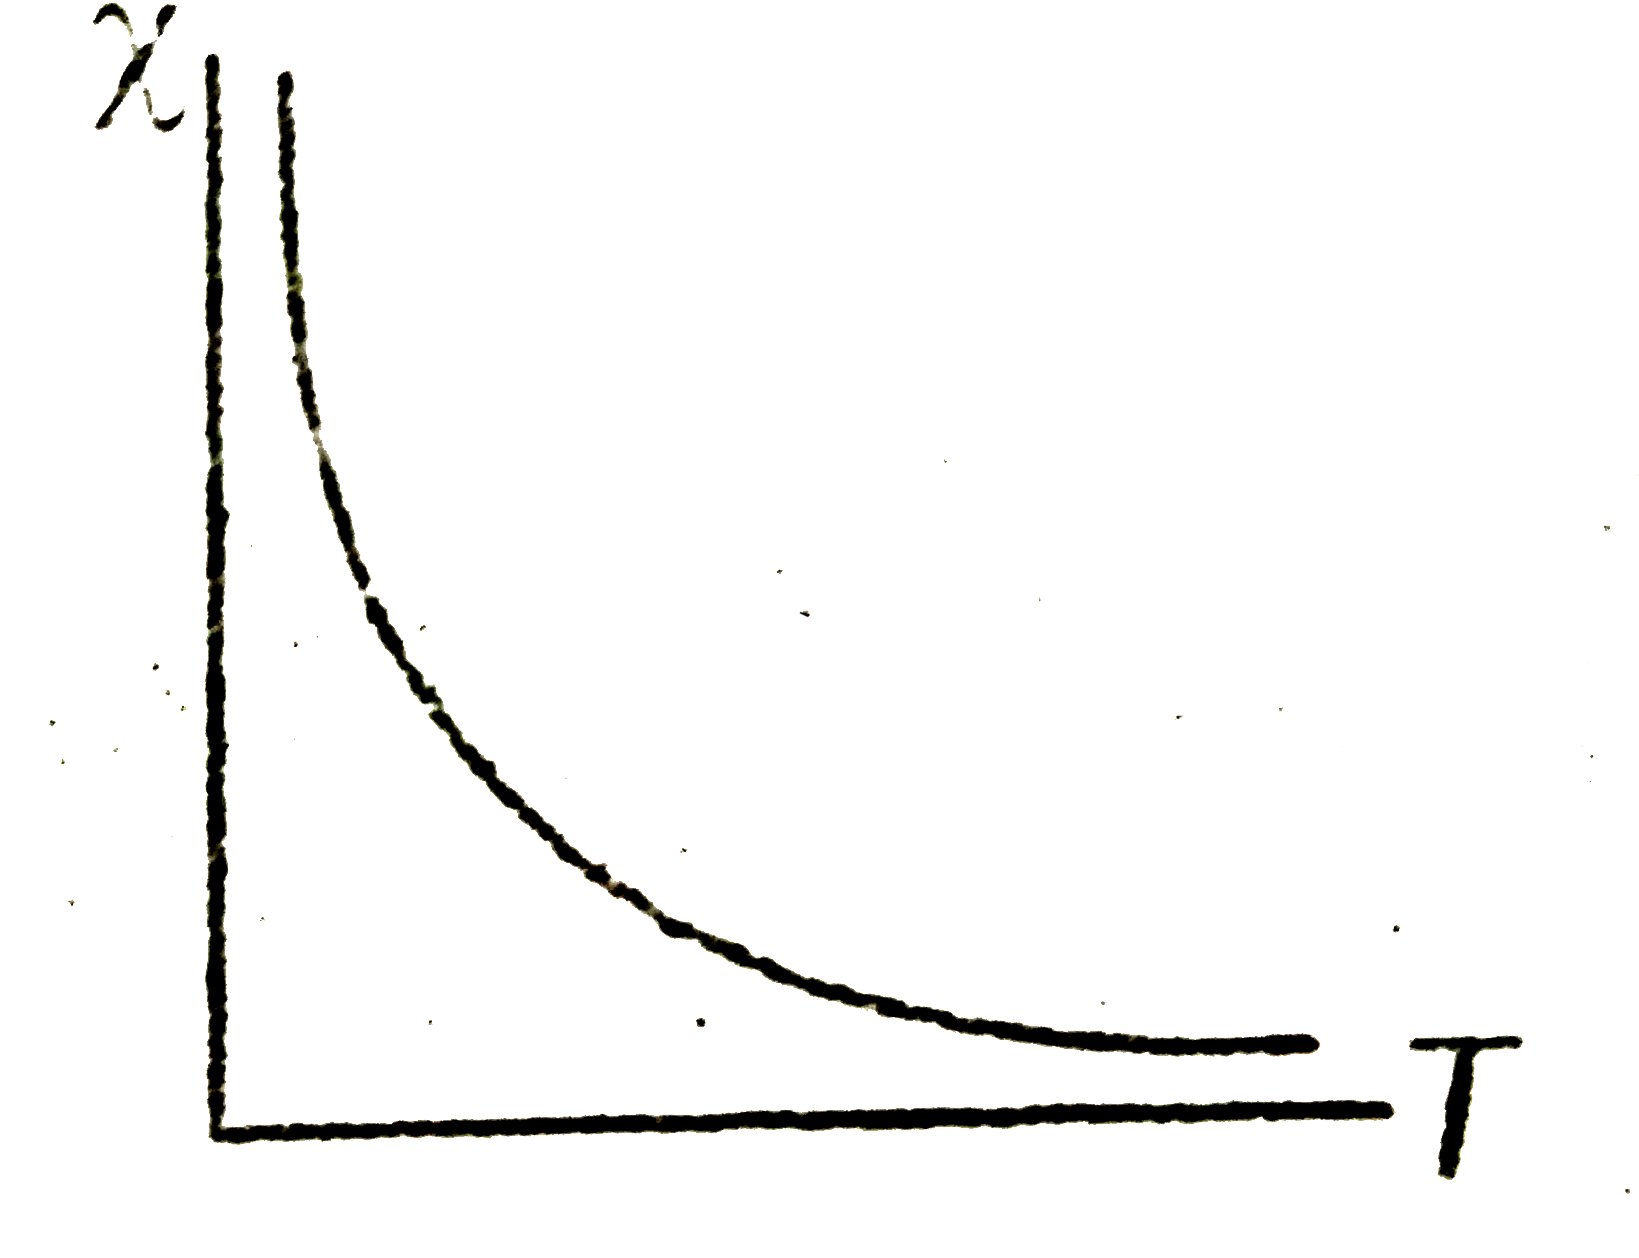
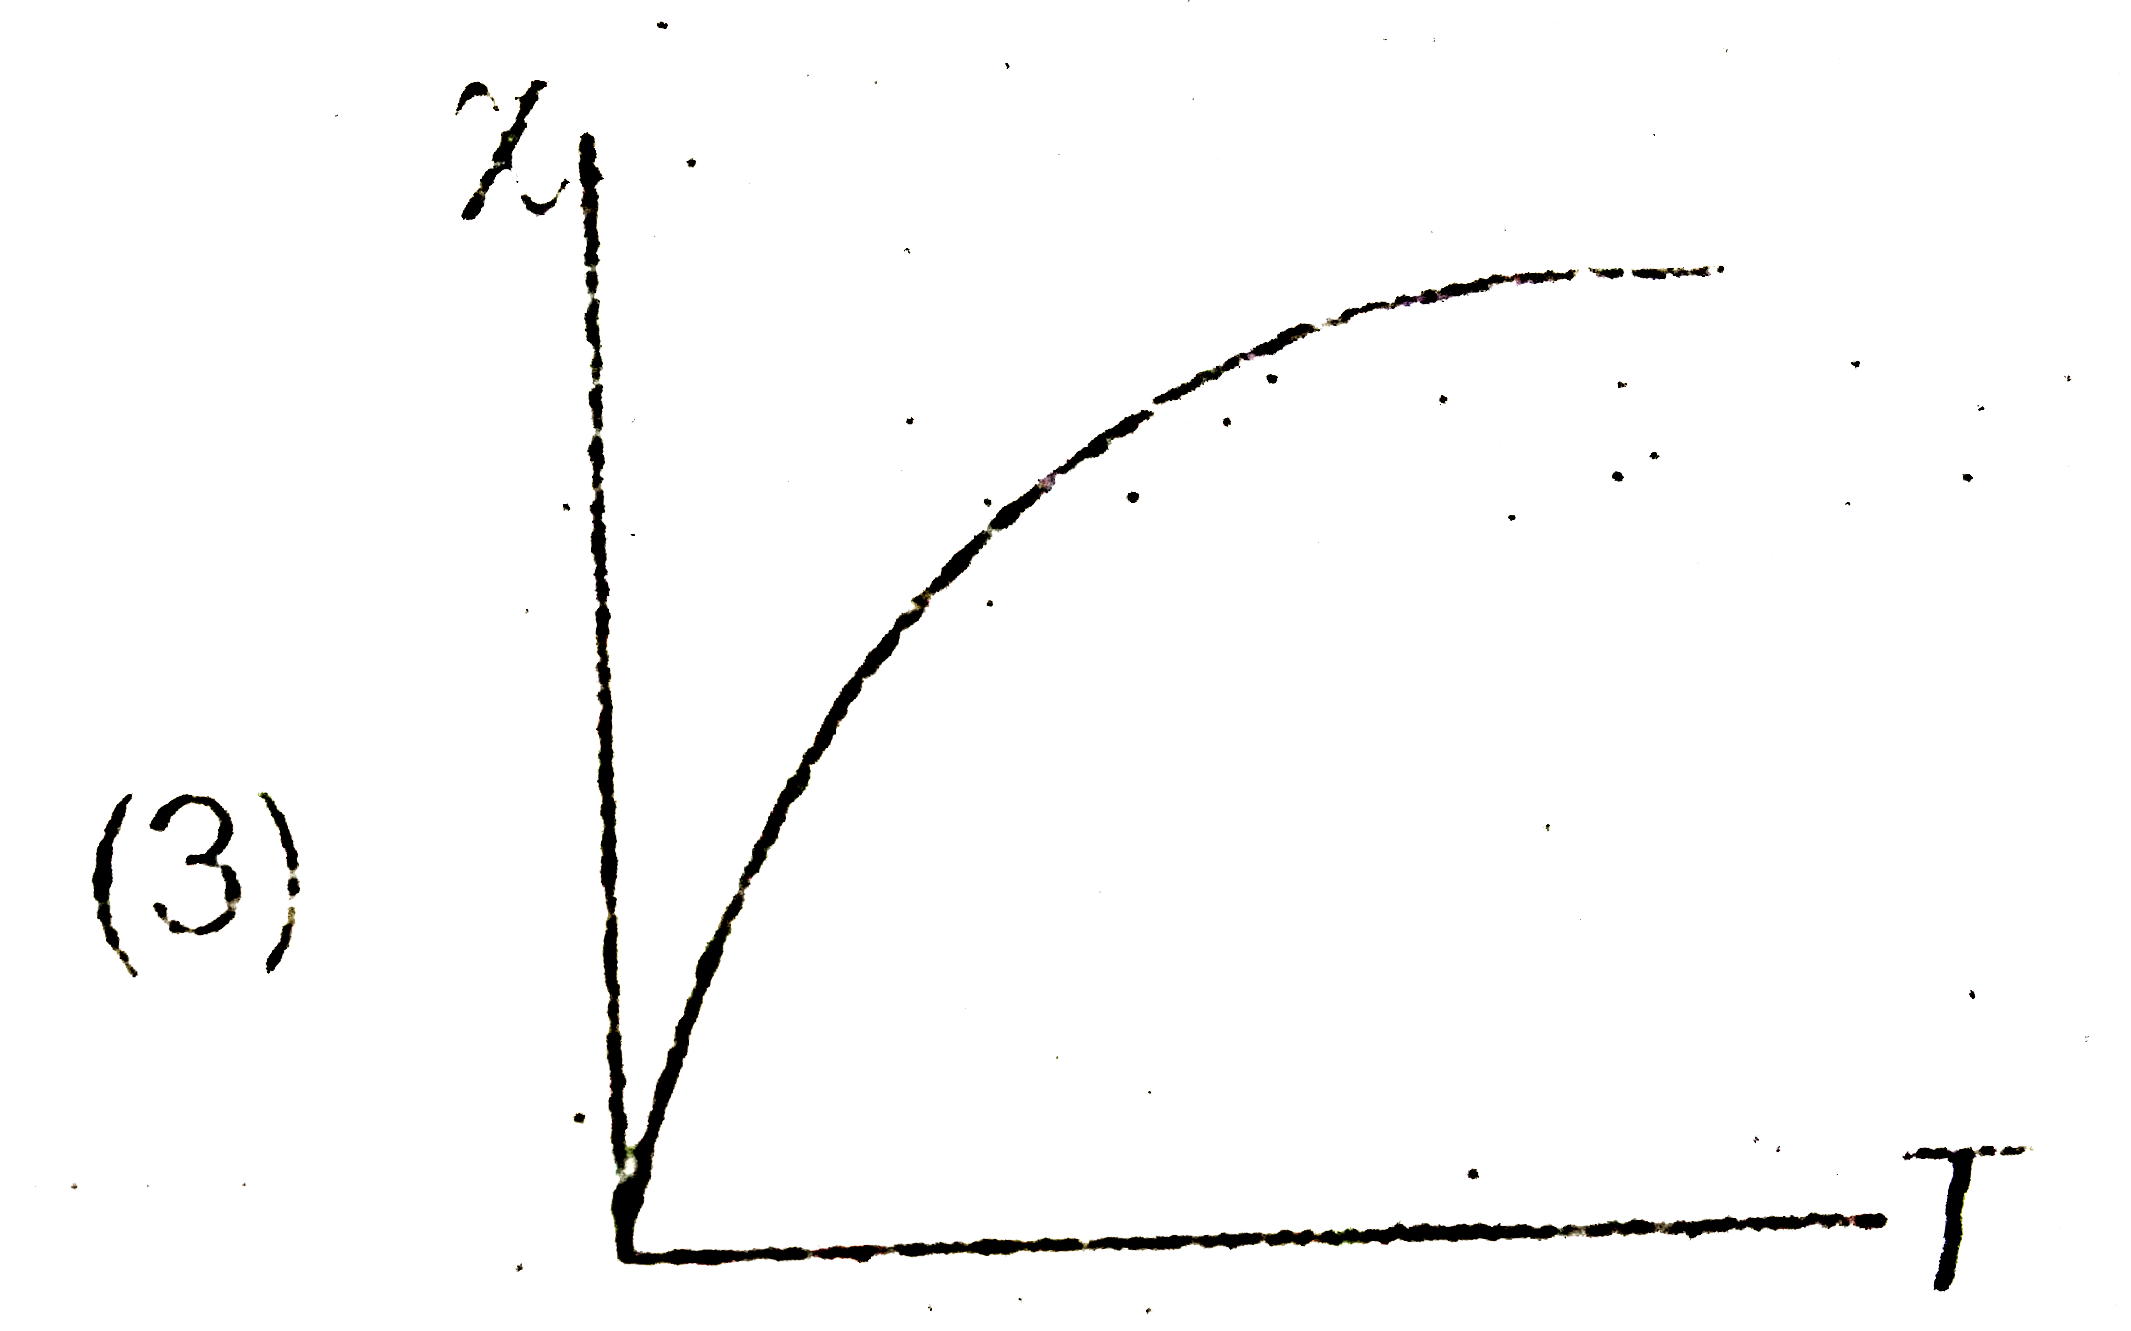
The graph between χ and T for paramagnetic material will be represented by


The correct Answer is:B
To solve the question regarding the graph between susceptibility (χ) and temperature (T) for paramagnetic materials, we can follow these steps:
Step 1: Understand the relationship between susceptibility and temperature
For paramagnetic materials, the susceptibility (χ) is inversely proportional to the temperature (T). This relationship can be mathematically expressed as:
χ∝1T
This means that as the temperature increases, the susceptibility decreases.
Step 2: Analyze the implications of the relationship
Since χ is inversely proportional to T, we can infer that:
- At low temperatures, χ will be high.
- As the temperature rises, χ will drop, approaching zero as T approaches infinity.
Step 3: Determine the nature of the graph
Given that χ decreases as T increases, the graph will have:
- A downward slope, indicating that as you move along the x-axis (increasing T), the value of χ on the y-axis decreases.
Step 4: Identify the correct option
Based on the analysis, the graph will be a hyperbolic curve that slopes downwards. Therefore, the correct representation of the graph between χ and T for paramagnetic materials corresponds to the option that shows this inverse relationship.
Conclusion
The correct answer is the option that depicts a downward slope, indicating that as temperature increases, susceptibility decreases.
---
For paramagnetic materials, the susceptibility (χ) is inversely proportional to the temperature (T). This relationship can be mathematically expressed as:
χ∝1T
This means that as the temperature increases, the susceptibility decreases.
Since χ is inversely proportional to T, we can infer that:
- At low temperatures, χ will be high.
- As the temperature rises, χ will drop, approaching zero as T approaches infinity.
Given that χ decreases as T increases, the graph will have:
- A downward slope, indicating that as you move along the x-axis (increasing T), the value of χ on the y-axis decreases.
Based on the analysis, the graph will be a hyperbolic curve that slopes downwards. Therefore, the correct representation of the graph between χ and T for paramagnetic materials corresponds to the option that shows this inverse relationship.
The correct answer is the option that depicts a downward slope, indicating that as temperature increases, susceptibility decreases.
Topper's Solved these Questions
- MAGNETISM AND MATTER BOOK - AAKASH INSTITUTE ENGLISHCHAPTER - MAGNETISM AND MATTER EXERCISE - Assignment Section - B Objective Type Questions (One option is correct)
30 Videos
- MAGNETISM AND MATTER BOOK - AAKASH INSTITUTE ENGLISHCHAPTER - MAGNETISM AND MATTER EXERCISE - Assignment Section- C Linked Comprehension Type Questions
3 Videos
- MAGNETISM AND MATTER BOOK - AAKASH INSTITUTE ENGLISHCHAPTER - MAGNETISM AND MATTER EXERCISE - Try Yourself
53 Videos
- LAWS OF MOTIONBOOK - AAKASH INSTITUTE ENGLISHCHAPTER - LAWS OF MOTIONEXERCISE - Assignment (SECTION-D) (Assertion-Reason Type Questions)
15 Videos
- MECHANICAL PROPERTIES OF FLUIDSBOOK - AAKASH INSTITUTE ENGLISHCHAPTER - MECHANICAL PROPERTIES OF FLUIDSEXERCISE - SECTION - J
9 Videos
Similar Questions
Knowledge Check
The correct M-H curve for a paramagnetic material at a constant temperature (T) is represented by
A B
B C
C D
D
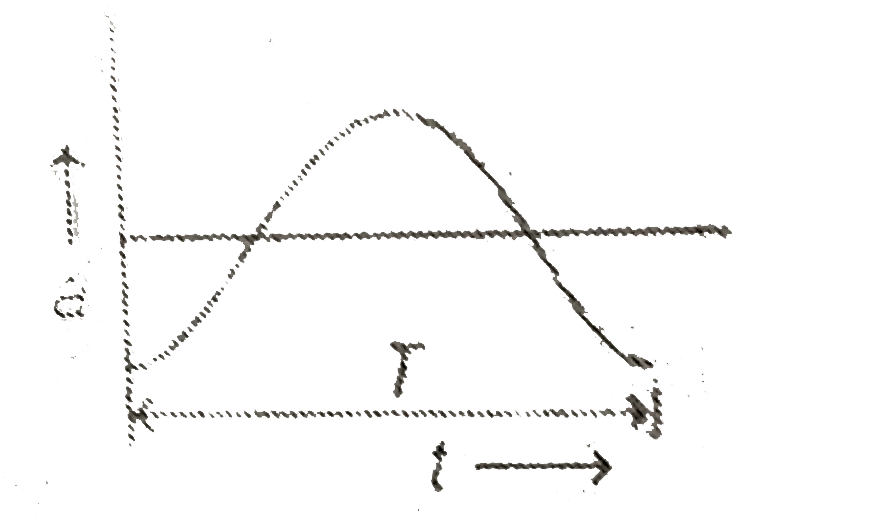
Acceleration versus time graph of a body in SHM is given by a curve shown below. T is the time period. Then corresponding graph between kinetic energy KE and time t is correctly represented by

View SolutionAn endothermic reaction is represented by the graph :
View SolutionAssertion (A): χ−T graph for a diamagnetic material is a straight line parallel to T−axis
Reason (R ): This is because susceptibility of a diamagnetic material is not affected by temperature
View SolutionIn what way is the behaviour of a diamagnetic material different from that of a paramagnetic material, when kept in an external magnetic field?
View SolutionIf the magnetic dipole of moment of an atom of diamagnetic material, paramagnetic material and ferromagnetic material are donated by μd,μp and μf respectively, then:
View SolutionIf the magnetic dipole of moment of an atom of diamagnetic material, paramagnetic material and ferromagnetic material are donated by μd,μp and μf respectively, then:
View SolutionThe variation of magnetic susceptibility (χ) with temperature for dimagnetic substance is represented by
View Solution
