A graph is plotted between PVm along y-axis and P along x-axis, where Vm is the molar volume of a real gas. Find the intercept .
RT - Pb
RT + Pb
RT
(RT)1/2
To find the intercept of the graph plotted between PVm (molar volume of a real gas) on the y-axis and pressure P on the x-axis, we can follow these steps:
1. Understand the Van der Waals Equation:
The Van der Waals equation for real gases is given by:
(P+aV2m)(Vm−b)=RT
where P is the pressure, Vm is the molar volume, a and b are constants specific to the gas, and R is the universal gas constant.
2. Rearranging the Equation:
We can rearrange the Van der Waals equation to express PVm:
PVm=RT+Pb−aVm
3. Finding the Intercept:
To find the intercept on the y-axis (when P=0), we set P=0:
PVm=RT+Pb−aVm
When P=0, the equation simplifies to:
PVm=RT+0−aVm
As Vm approaches infinity, the term −aVm approaches 0. Therefore, the equation simplifies to:
PVm=RT
4. Final Expression for the Intercept:
Thus, the intercept on the y-axis when P=0 is:
PVm=RT+Pb
Therefore, the intercept is RT+Pb.
5. Conclusion:
The intercept of the graph plotted between PVm and P is RT+Pb.
The Van der Waals equation for real gases is given by:
(P+aV2m)(Vm−b)=RT
where P is the pressure, Vm is the molar volume, a and b are constants specific to the gas, and R is the universal gas constant.
We can rearrange the Van der Waals equation to express PVm:
PVm=RT+Pb−aVm
To find the intercept on the y-axis (when P=0), we set P=0:
PVm=RT+Pb−aVm
When P=0, the equation simplifies to:
PVm=RT+0−aVm
As Vm approaches infinity, the term −aVm approaches 0. Therefore, the equation simplifies to:
PVm=RT
Thus, the intercept on the y-axis when P=0 is:
PVm=RT+Pb
Therefore, the intercept is RT+Pb.
The intercept of the graph plotted between PVm and P is RT+Pb.
Similar Questions
A graph is plotted between PVm along Y-axis and P along X-axis whre Vm is the molar volume of a real gas Find the intercept along Y-axis .
View SolutionA graph is plotted by taking pressure along y-axis and centigrade temperature along X-axis for an ideal gas at constant volume. x intercept of the graph is
View SolutionA graph is plotted with PV/T on y-axis and mass of the gas along x-axis for different gases. The graph is
View SolutionBy plotting log x/m on y-axis and log P on x-axis we s hould get
View SolutionIf a graph is plotted by taking spectral emissive power along y-axis and wavelength along X-axis then the area below the graph above wavelength axis is
View Solutiona graph between prssure P (along y-axis) and absolute temperature, T(along x-axis) for equal moles of two gases has been drawn . Given that volume of second gas is more than volume of first gas. Which of the following statement is correct?
View SolutionWhen a graph is plotted between log x/m and log p, it is straight line with an angle 45∘ and intercept 0.6020 on y-axis.if initial pressure is 0.3 atm, what will be the amount of gas adsorbed per gram of adsorbent :
View SolutionA graph is drawn with 1u along x-axis and 1v along the y-axis. If the intercept on the x-axis is 0.5m−1, the focal length of the mirror is (in meter).
View SolutionA graph is plotted for a vanderwaal's gas between PVm vs P leading to an intercept of 22.16 litre-atm. The temperature of gas at which these observations of P and Vm were made is ___________ ∘C
(R=0.08 litre atmK−1mol−1)
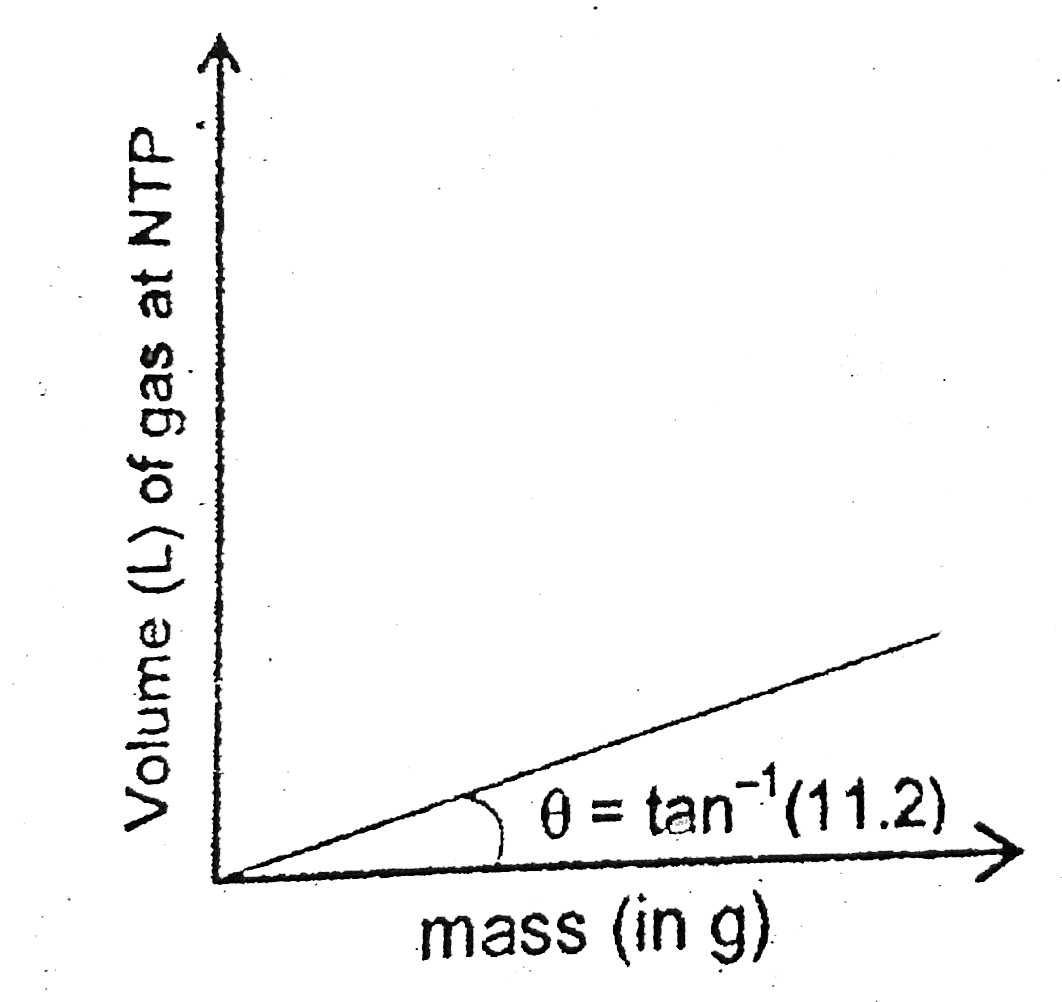
View SolutionA graph is plotted for gas 'C' , by putting its weight (in gm) on X-axis and the Volume (L) of gas at NTP on Y-axis. Select the correct statement :

View Solution
