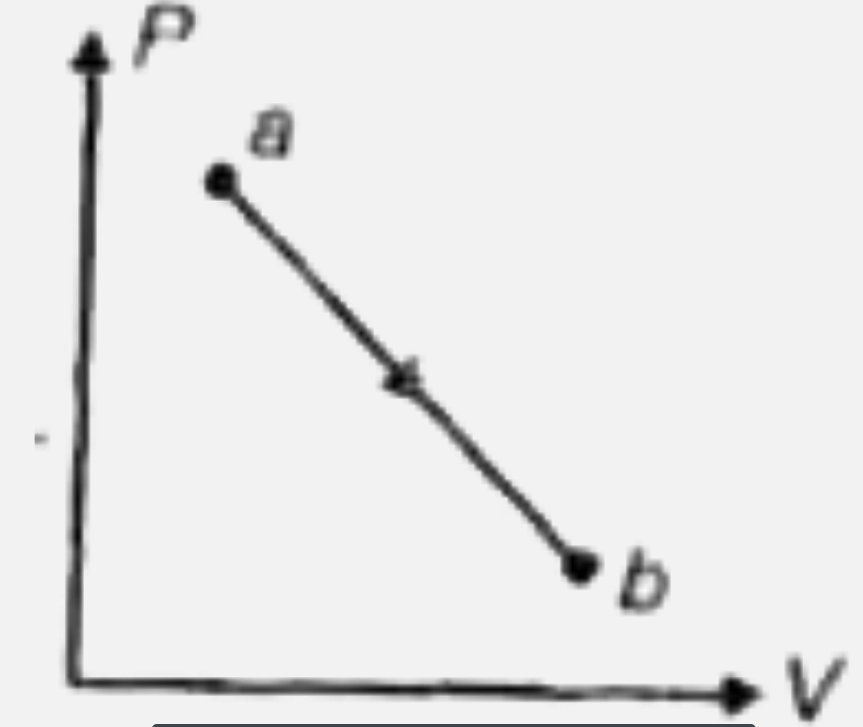
A gas undergoes expansion in such a mannerthat its p-V diagram plot is a downward sloping straight line as shown in the figure below. What happens to the temperature during the process ?
It increases first then decreases
It decreases first then increases
It continuously decreases
Data insuffcient
Plot the process a to b in the background of various dotted isothermal lines.

Not here T3>T2>T1. If you start from a towards b. you are at T1 then T1 then T3 and then to T2 an back to T1. So, the temperature first increases then it decreases. Hence, the correct response is (1).
Similar Questions
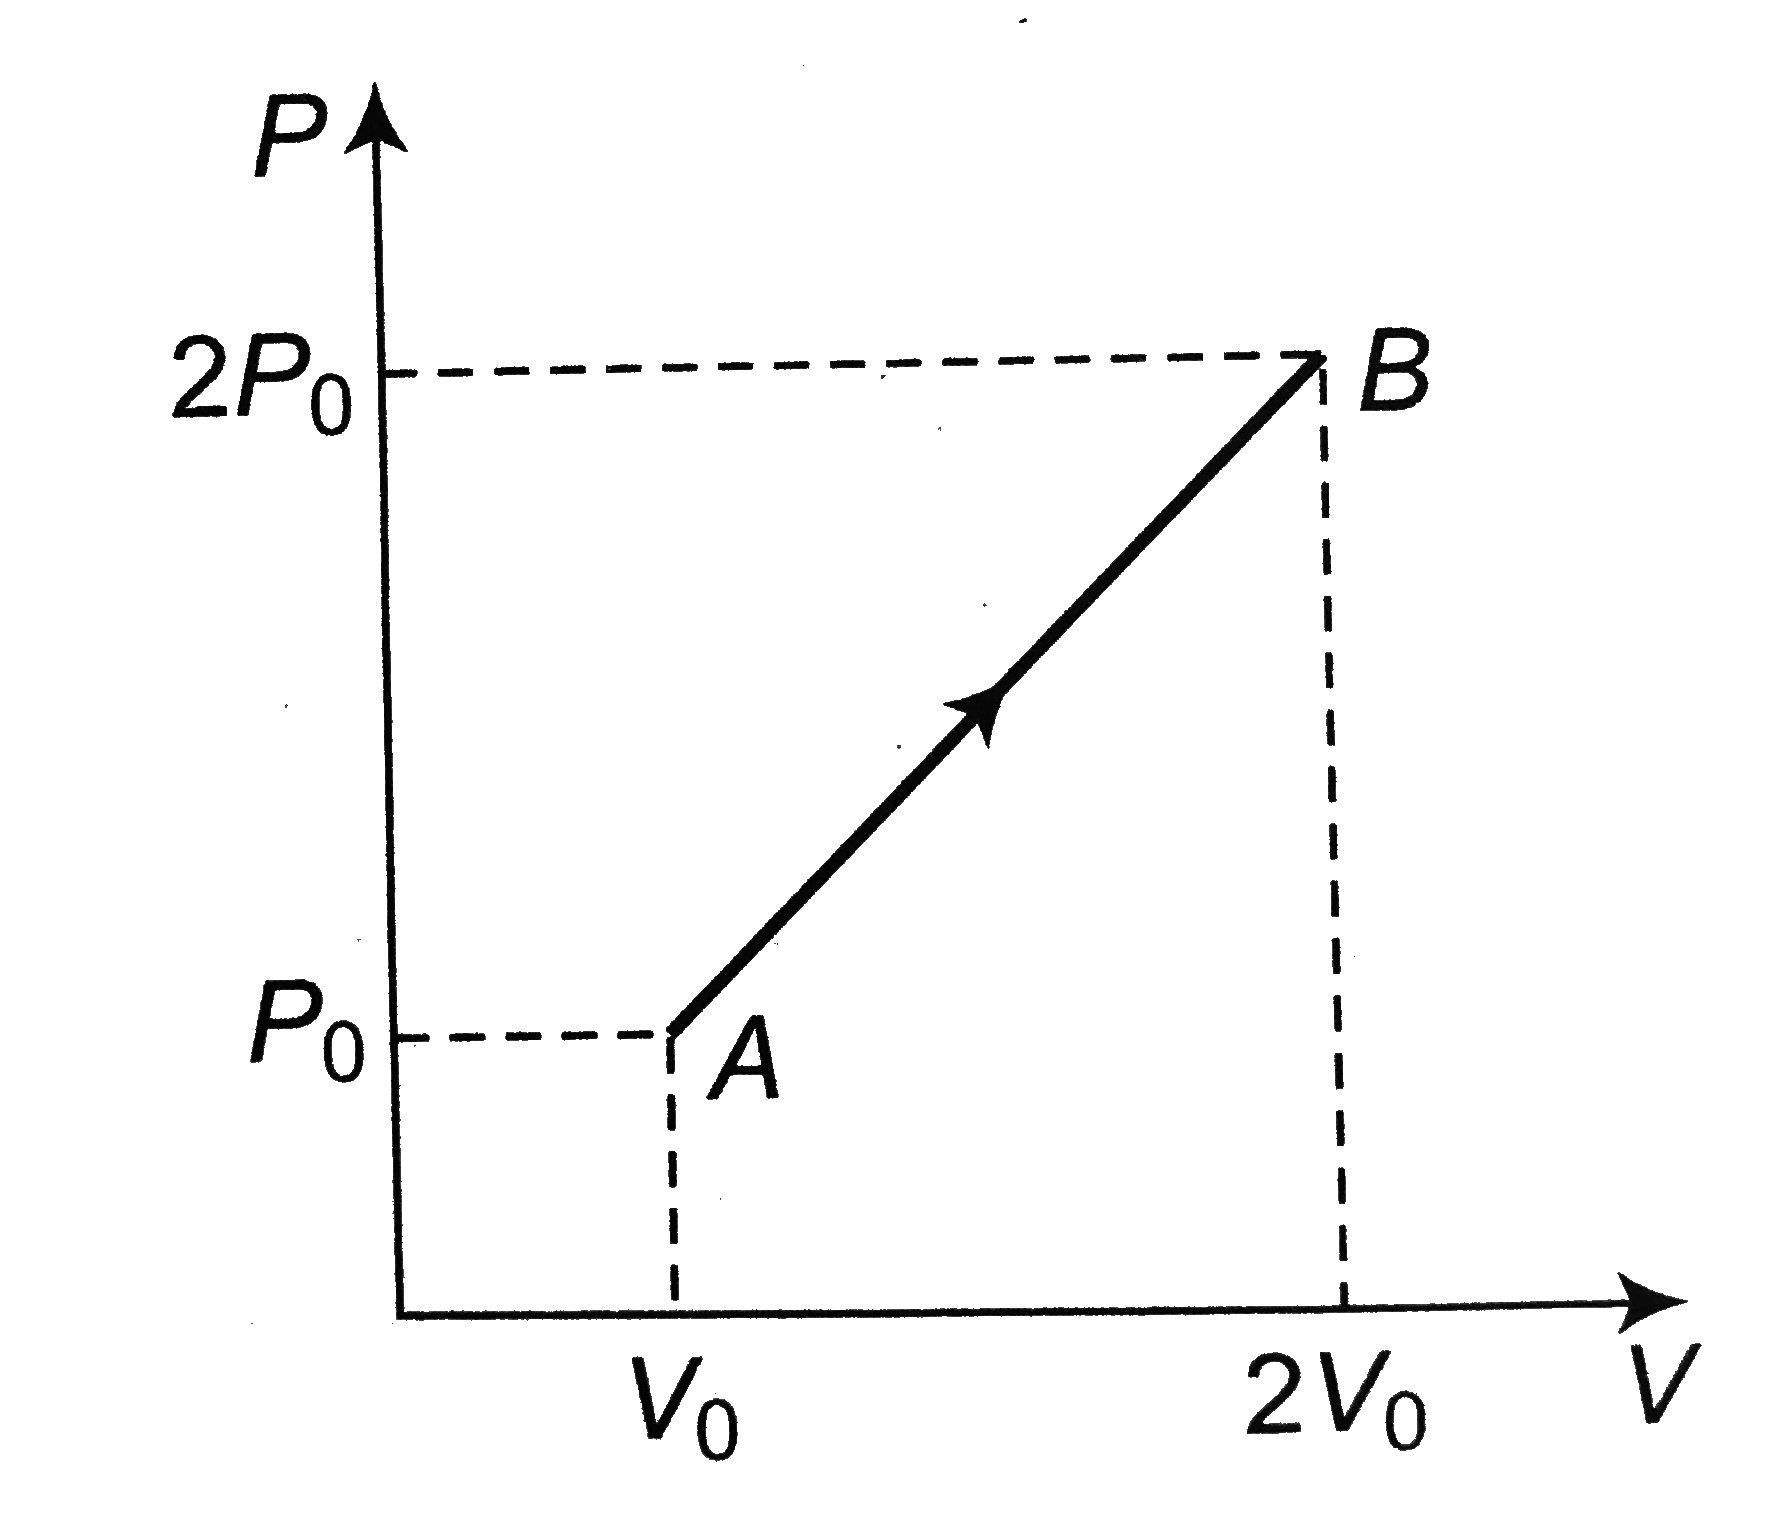
The P−V diagram of 2 gm of helium gas for a certain process A→B is shown in the figure. What is the heat given to the gas during the process A→B?
 View Solution
P-V diagram of a diatomic gas is a straight line passing through origin. The molar heat capacity of the gas in the process will be
View SolutionP-V diagram of a diatomic gas is a straight line passing through origin. The molar heat capacity of the gas in the process will be
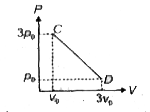
View SolutionThe process CD is shown in the diagram . As system is taken from C to D , what happens to the temperature of the system ?
 View Solution
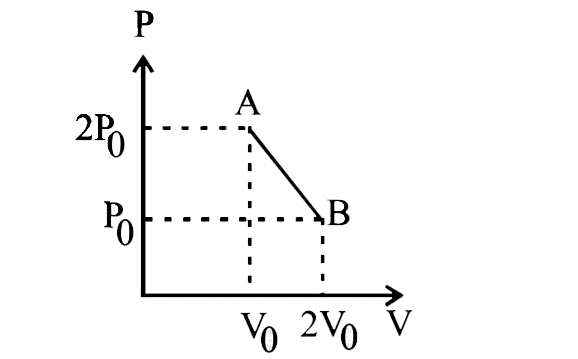
n' moles of an ideal gas undergoes a process A→B as shown in the figure. The maximum temperature of the gas during the process will be:
 View Solution
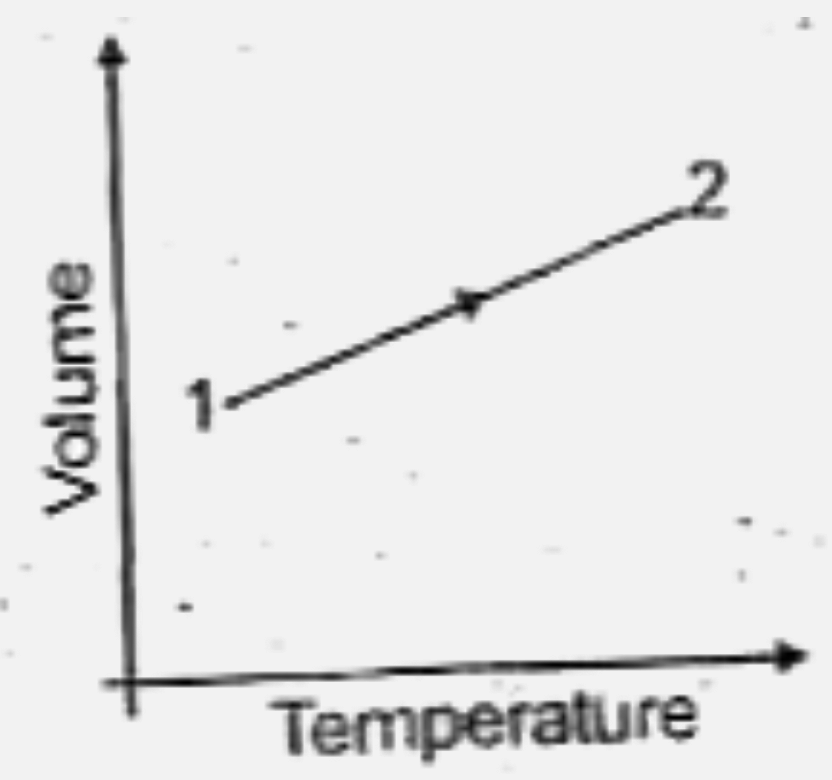
On a volume-temperature diagram a process 1-2 is an upward sloping straight line having the tendency to ct the volume axis as shown in the figure ehead. During this process the preseure
 View Solution
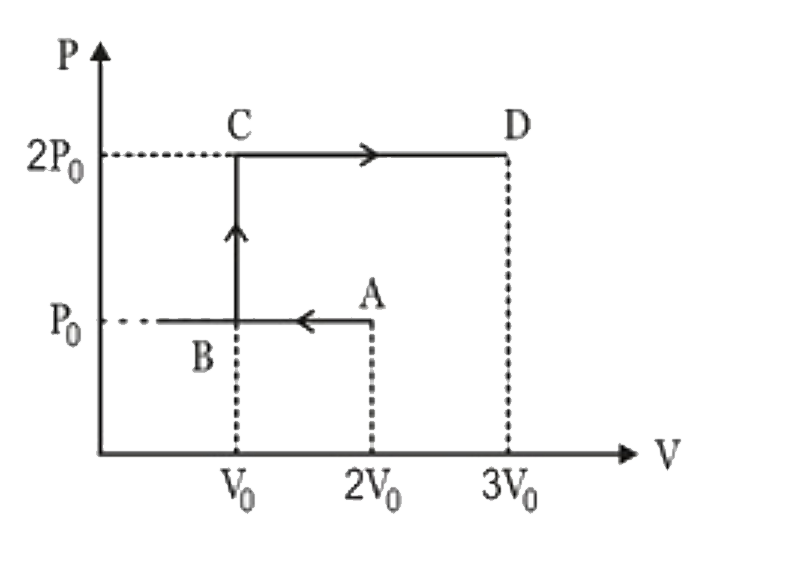
P – V graph of an ideal gas is as shown in the diagram . Work done by the gas in the process ABCD is
 View Solution
P-V diagram of an ideal gas is as shown in figure. Work done by the gas in the process ABCD is
 View Solution
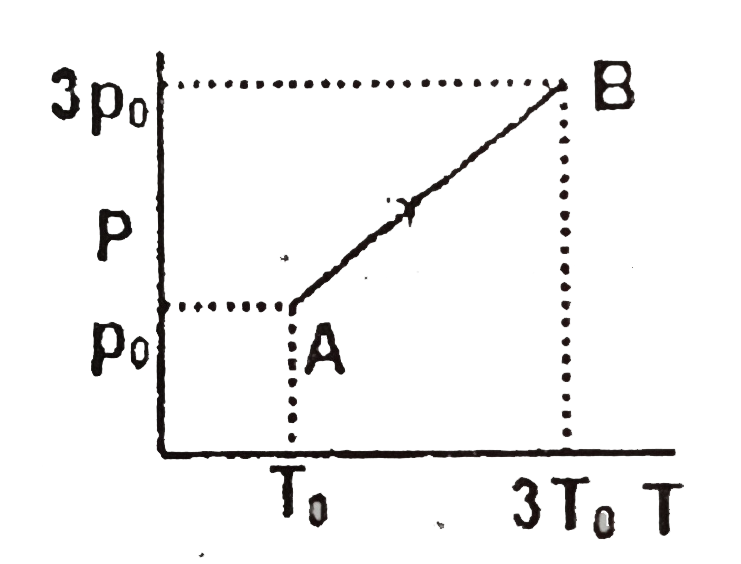
Two moles of a monoatomic ideal gas undergoes a process AB as shown in the figure. Then, find the work done during the process in Joule.
 View Solution
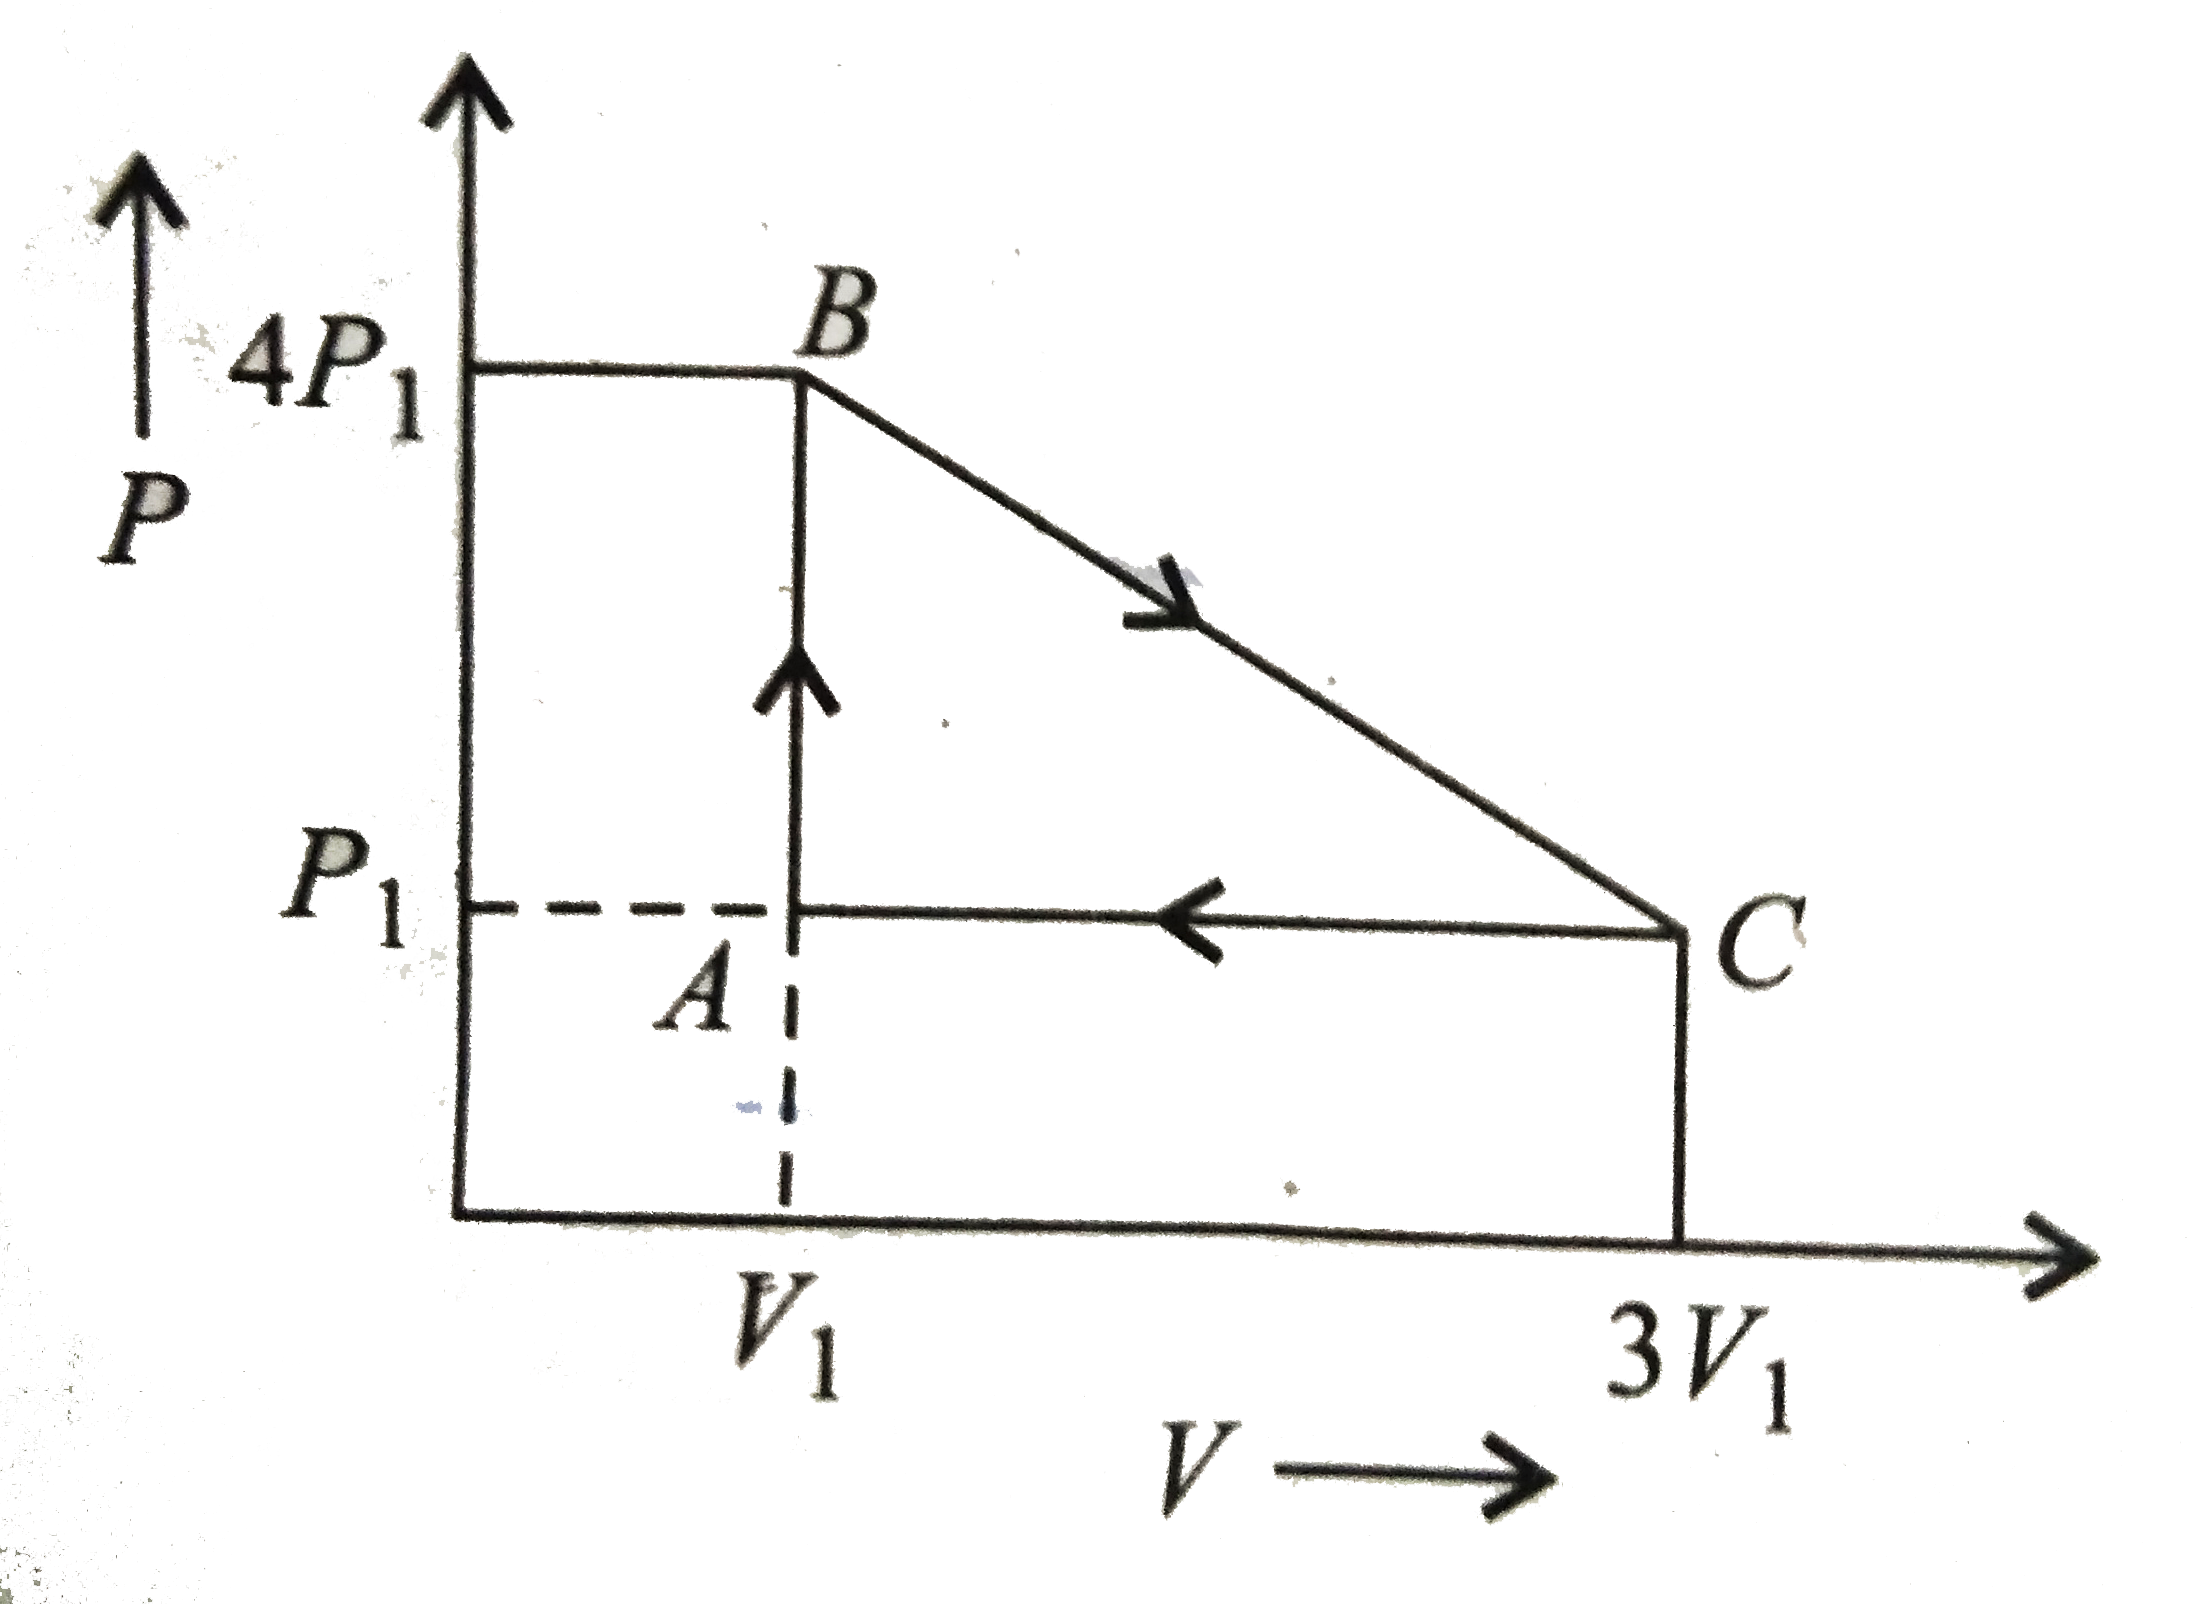
An ideal gas is taken around the cycle ABCD shown in the PV diagram below. The net work done by the gas during the cycle is equal to
 View Solution

