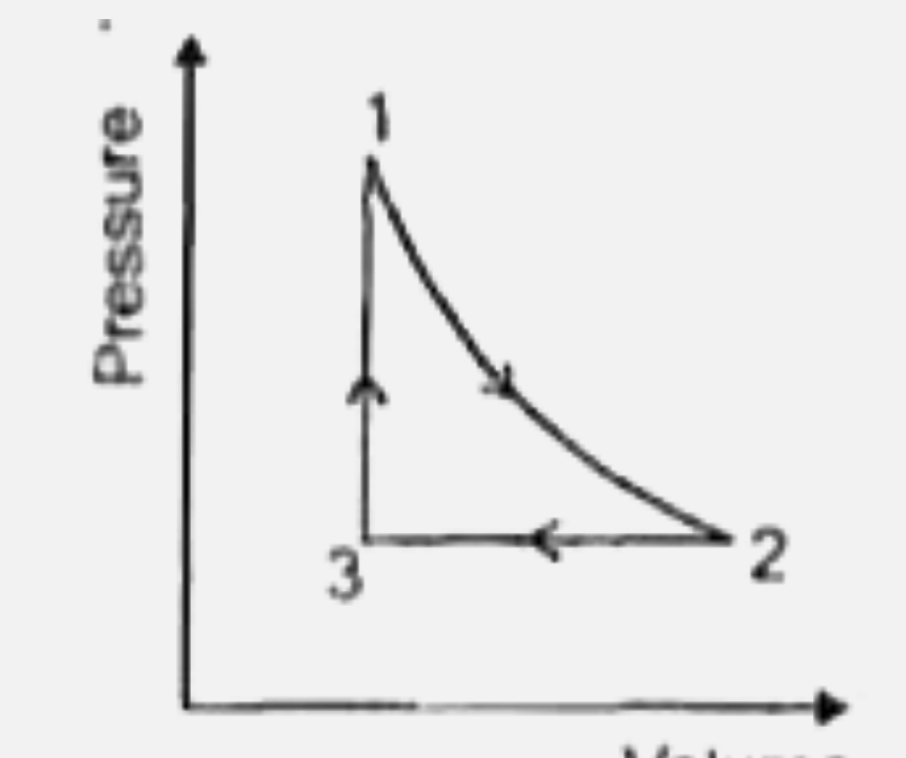
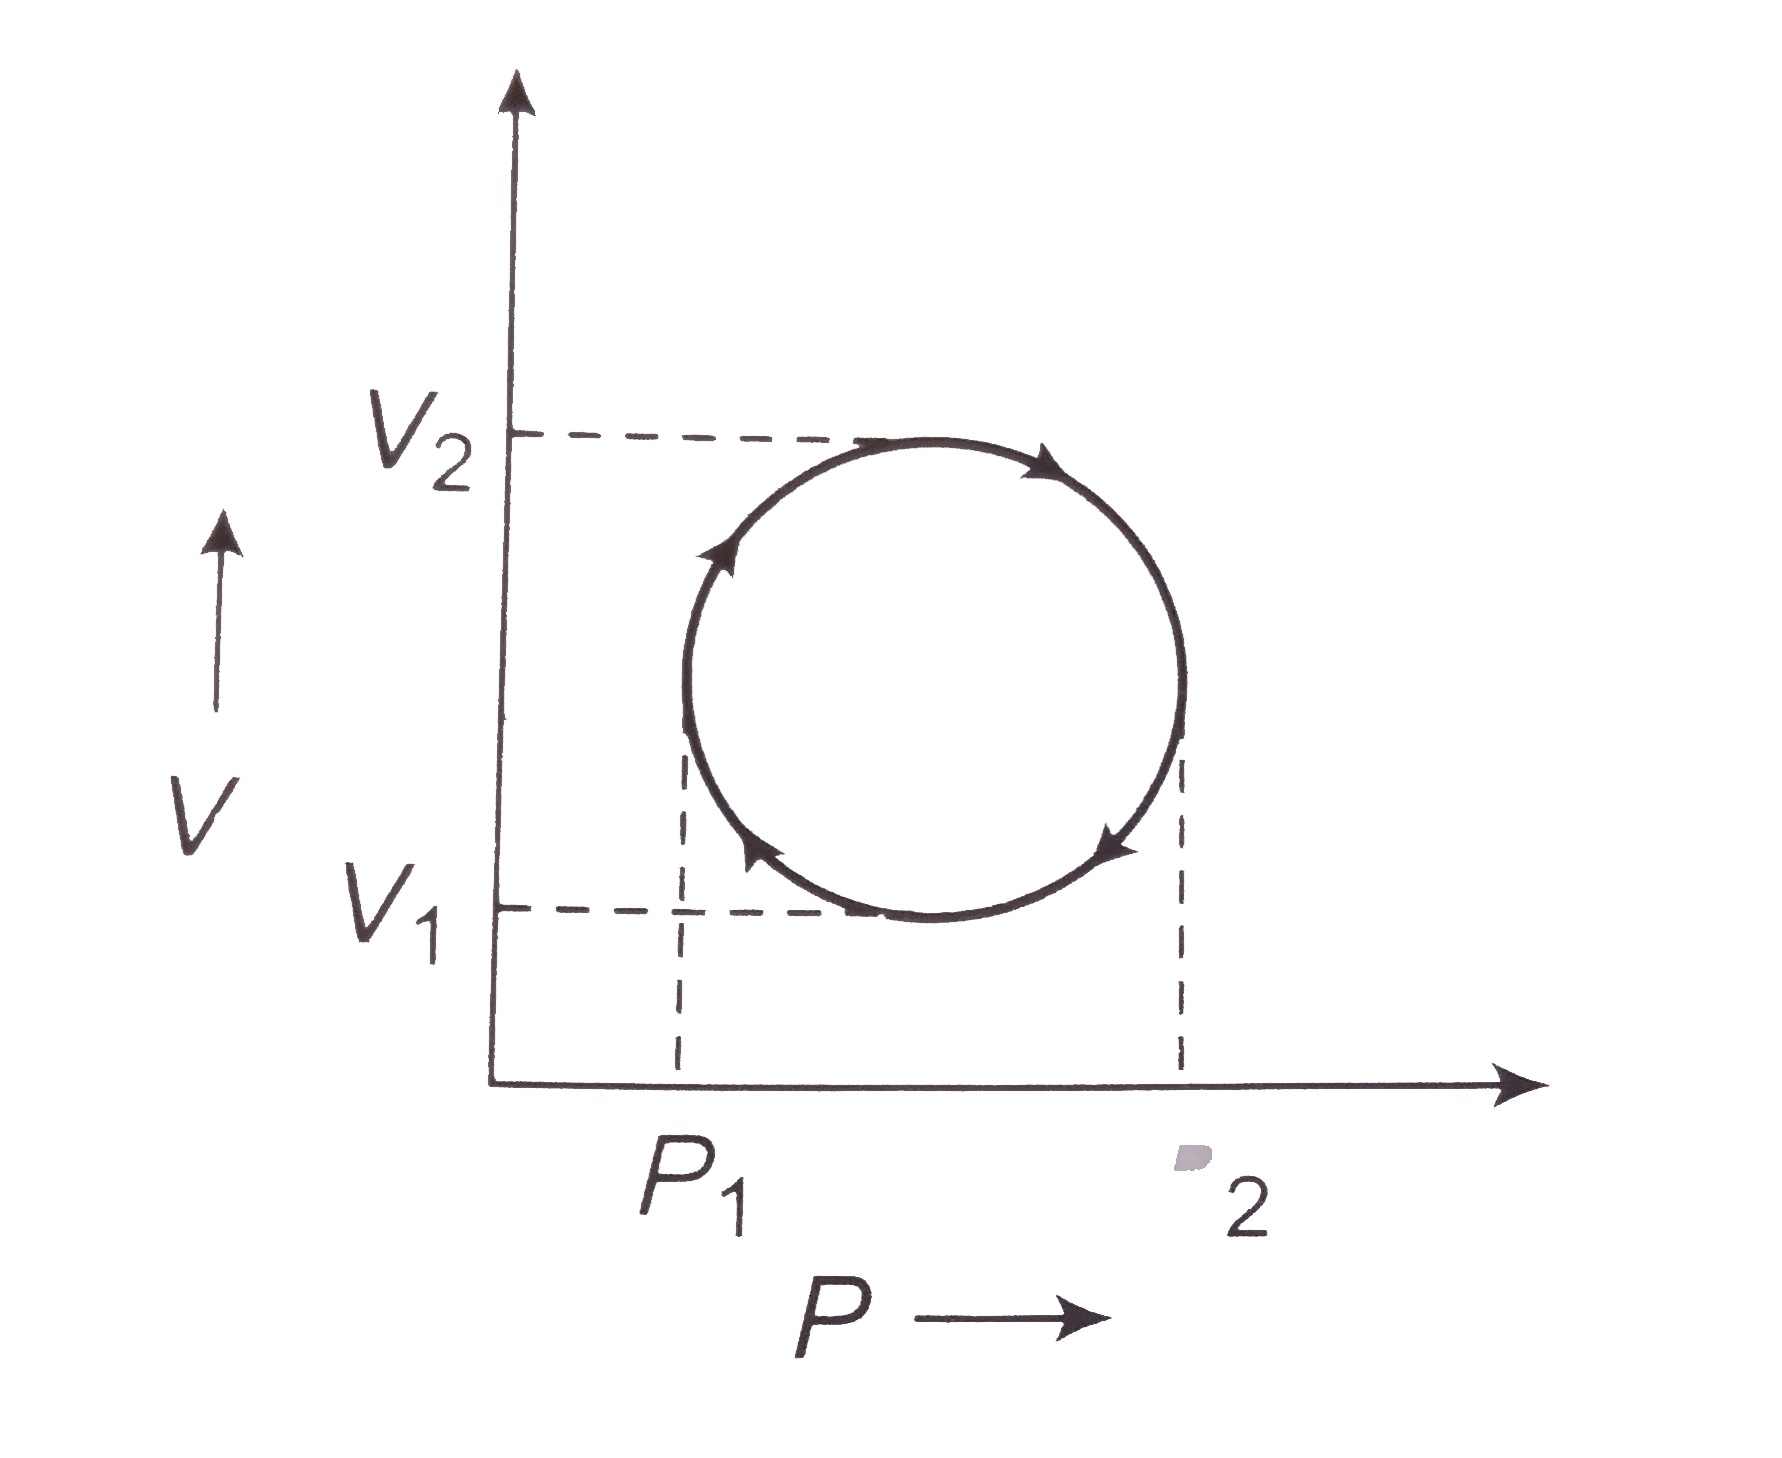
Given here is a cyclic process on P -V diagram. Process 1-2 is isothermal, 2-3 is isobaric and 3-1 is an isochoric process. Plot this T - P diagram.
Video Solution
Text Solution
For shifting of plots take care of following two steps.
Step I : Locate a process on the original diagram and find out which quantity-pressure, volume or temperature is constant in it! Then plot this process on the new diagram as a line or curve.
Step II : Look at the other variable in the new diagram and with the help of original diagram find out whethner the other variable is increasing or decreasing. Now accordingly put the arrow on the processes in the new plot.
Let us first plot this cycle on V - T diagram. You can start off any point. Remember on the p -V diagram,you should draw various isothermal lines as the construction lines. Since, we have to plot it on V - T diagram, all the time on a process you have to think in terms of volume temperature increase or decrease.
Suppose you are moving from 1-2, then in this process the volume is increasing so the plot on V - T diagram will be a vertical line and the arrown pointing up, as shown below.

Now, in the process 2-3 on P-V diagram the pressure is constant and the volume is decreasing. On V -T diagram the constant pressure line passes through origin. So, we have to draw a stright line form point 2. Which has the tendency to pass through the origin. This can be done in two ways either 2-a or 2-b.

But remember that in 2 -a or 2 -b the volume should decrease as shown in the p-V diagram. So, don.t go to 2- b because here the volume is increasing. Hence the next plot is as follows :

Now, 3-1 is an isochoric process which will be a horizontal stright line on V -T diagram. So, complete your answer with the diagram shown below.

Thinking on the similar line plot the T-P diagram as follows :

Some guiding clues are as follws. On P-V diagram in 1-2 the temperature is constant but the pressure is decreasing hence on T - P diagram its a horizontal line, arrow pointing to the left. In the process 2-3 on te P-V diagram the pressure is constant but the temperature is decreasing.
So, on T-P diagram this process will come down. Finally in the process 3-1 the volume is constant and the temperature is rising. So, on the T-P diagram the 3-1 process line will be stright and will have the tendency to pass through the origin.
|
Updated on:21/07/2023
Similar Questions
Knowledge Check
- Question 1 - Select One
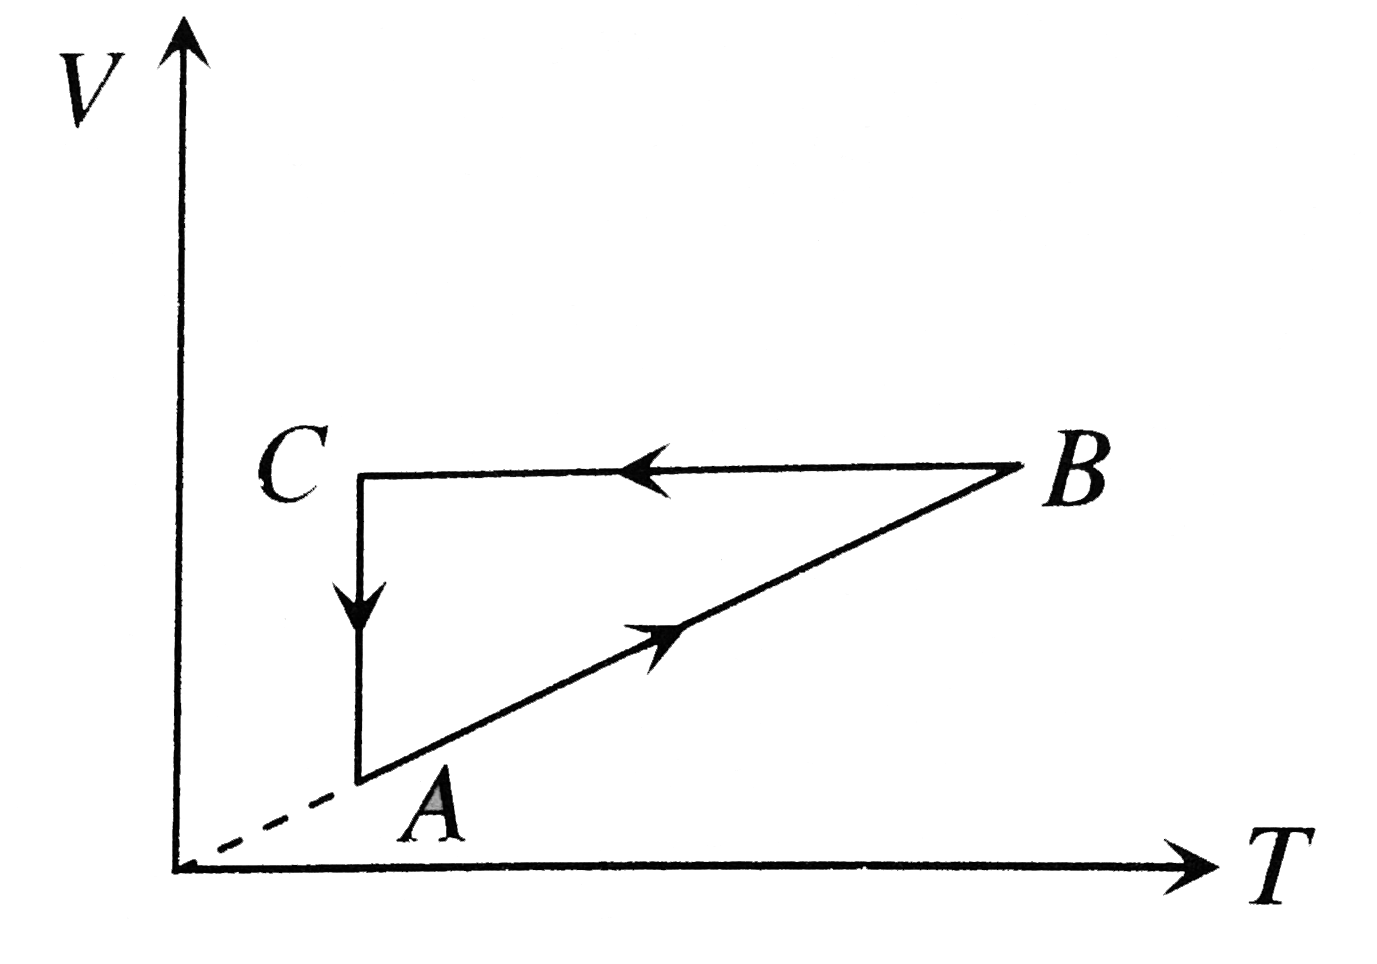
A cyclic process ABCA is shown in the V−T diagram process on the P−V
 A
A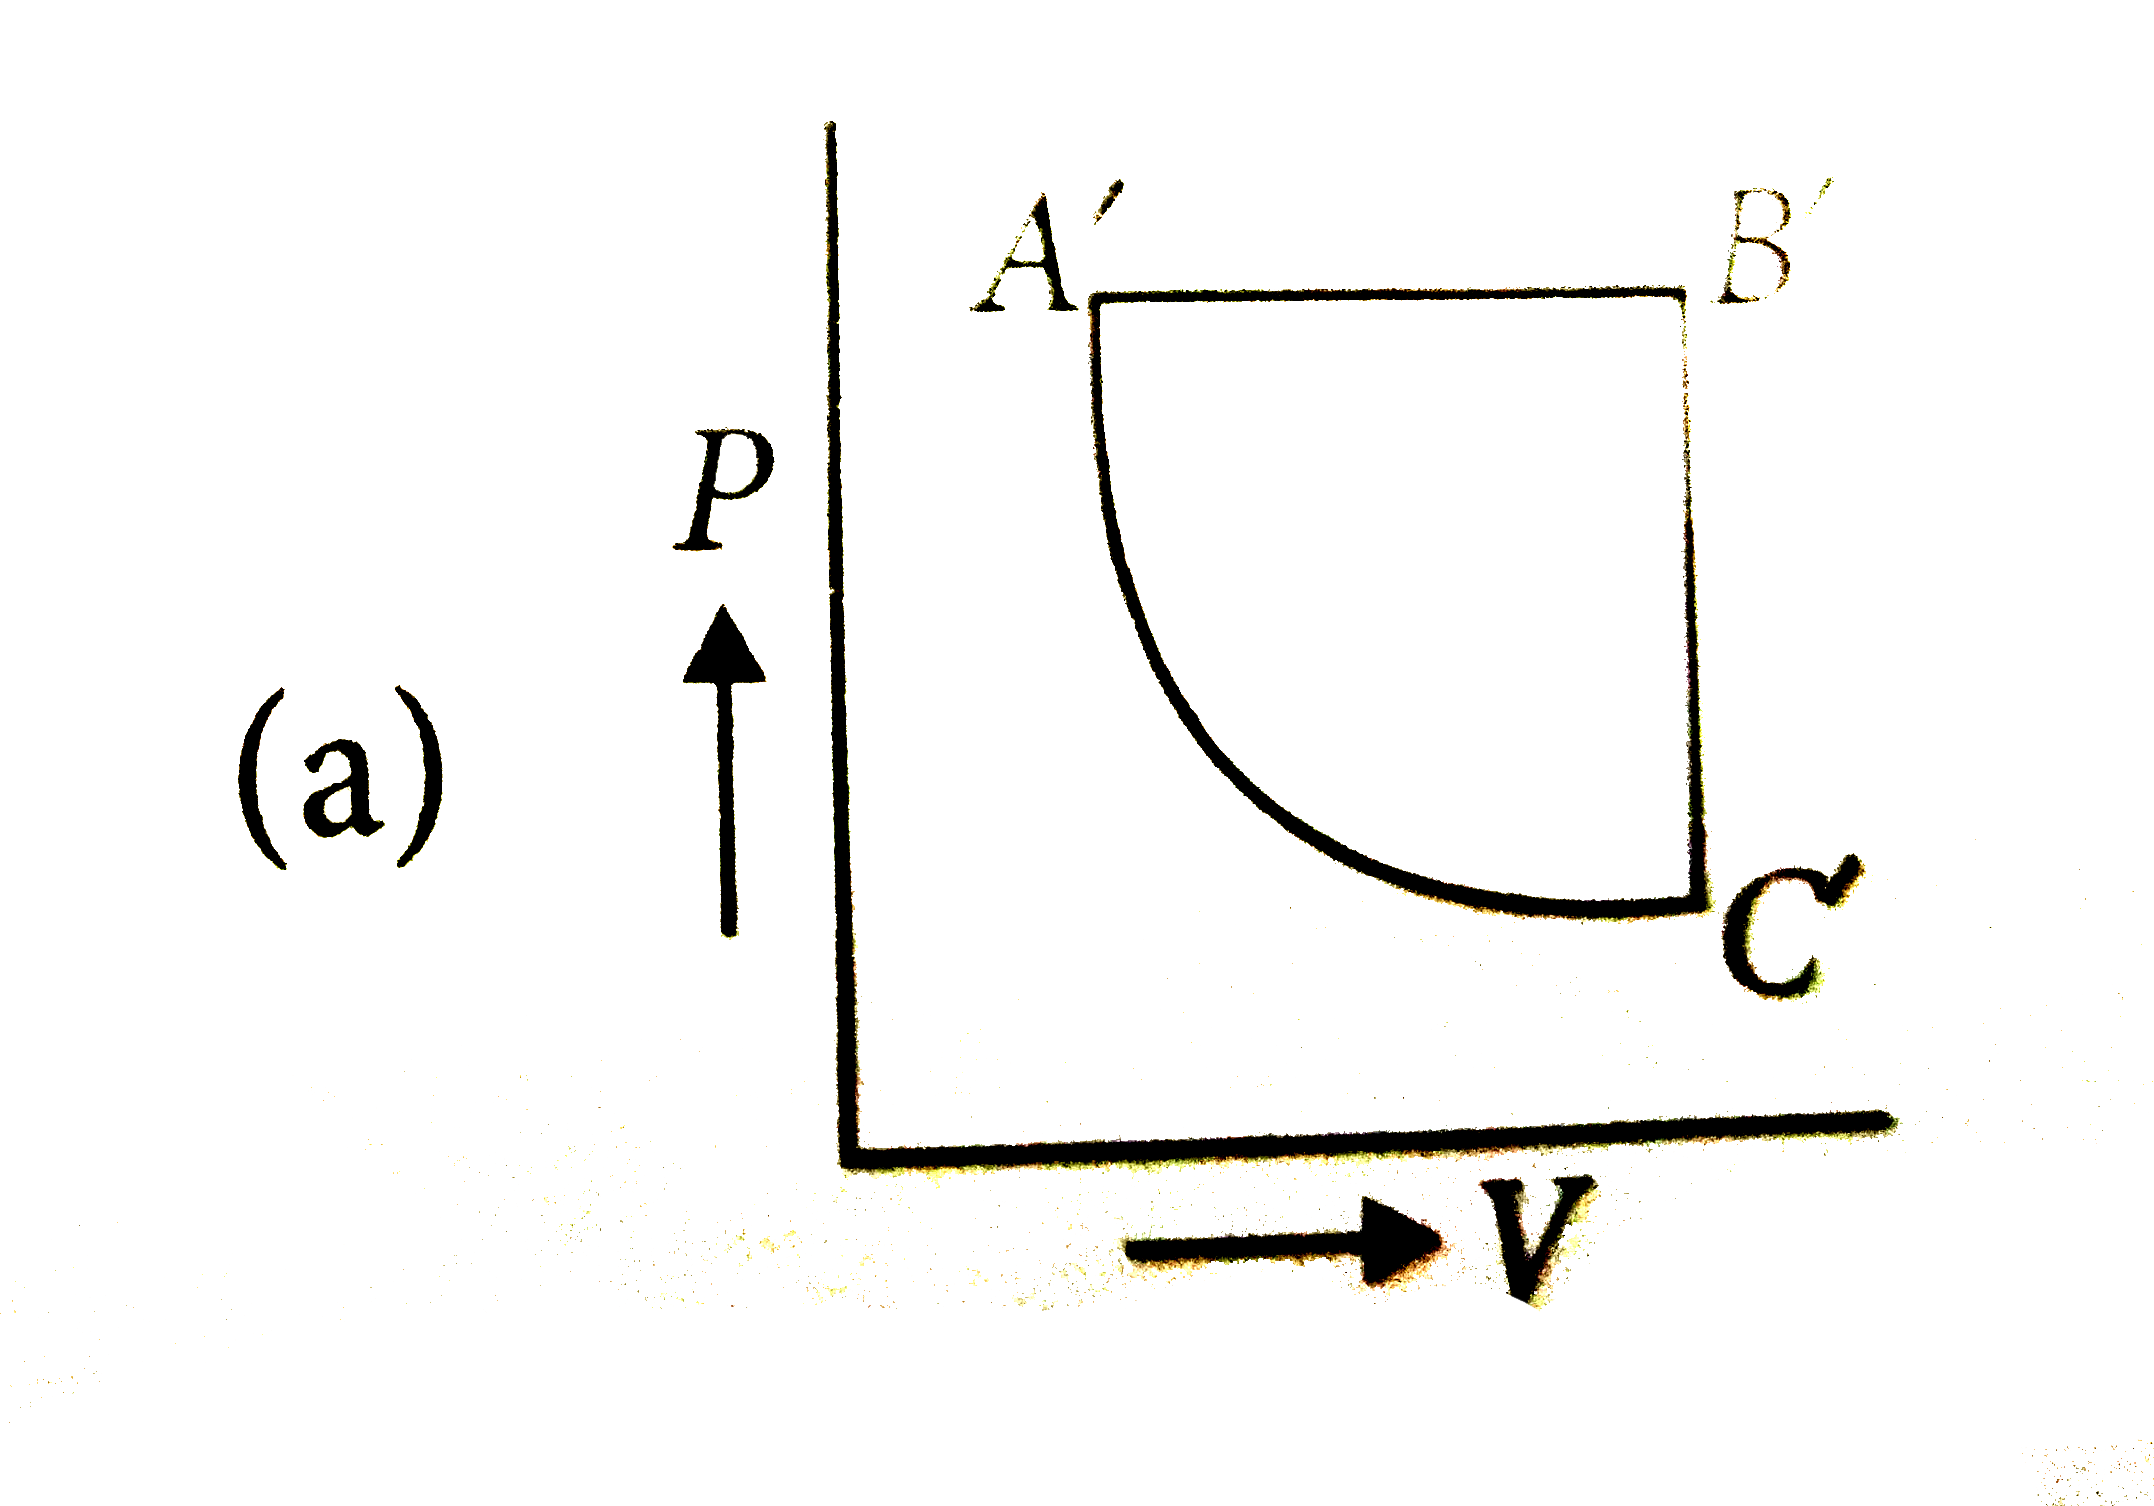 B
B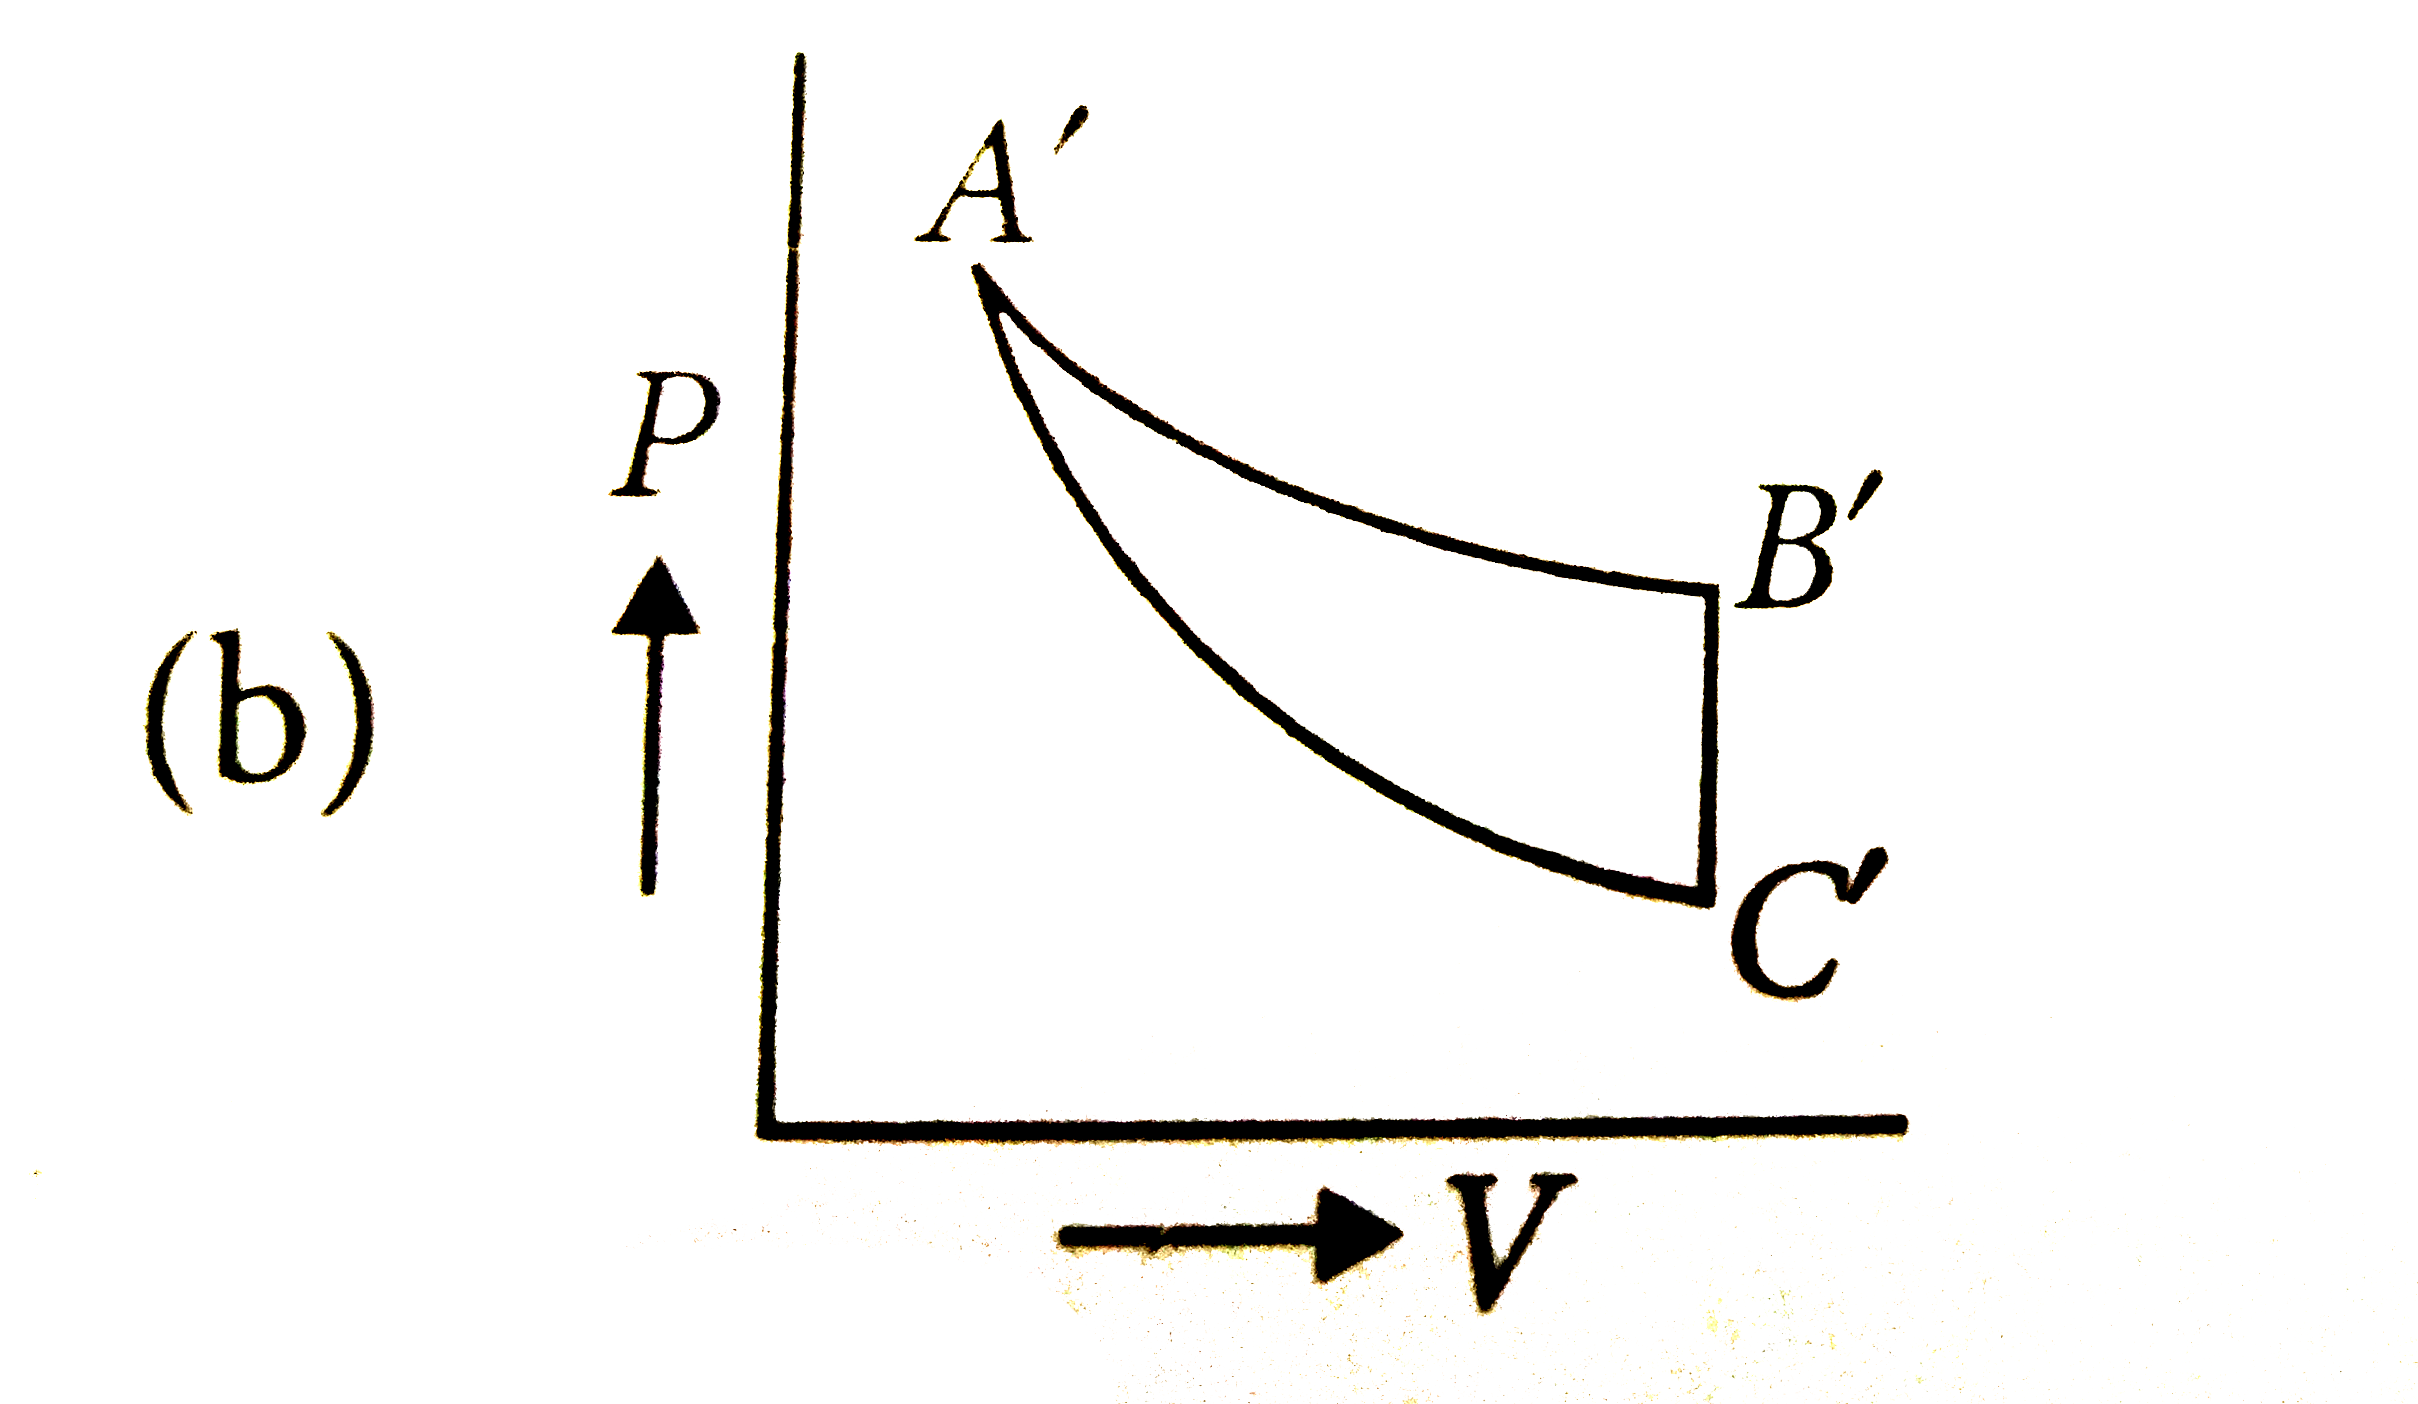 C
C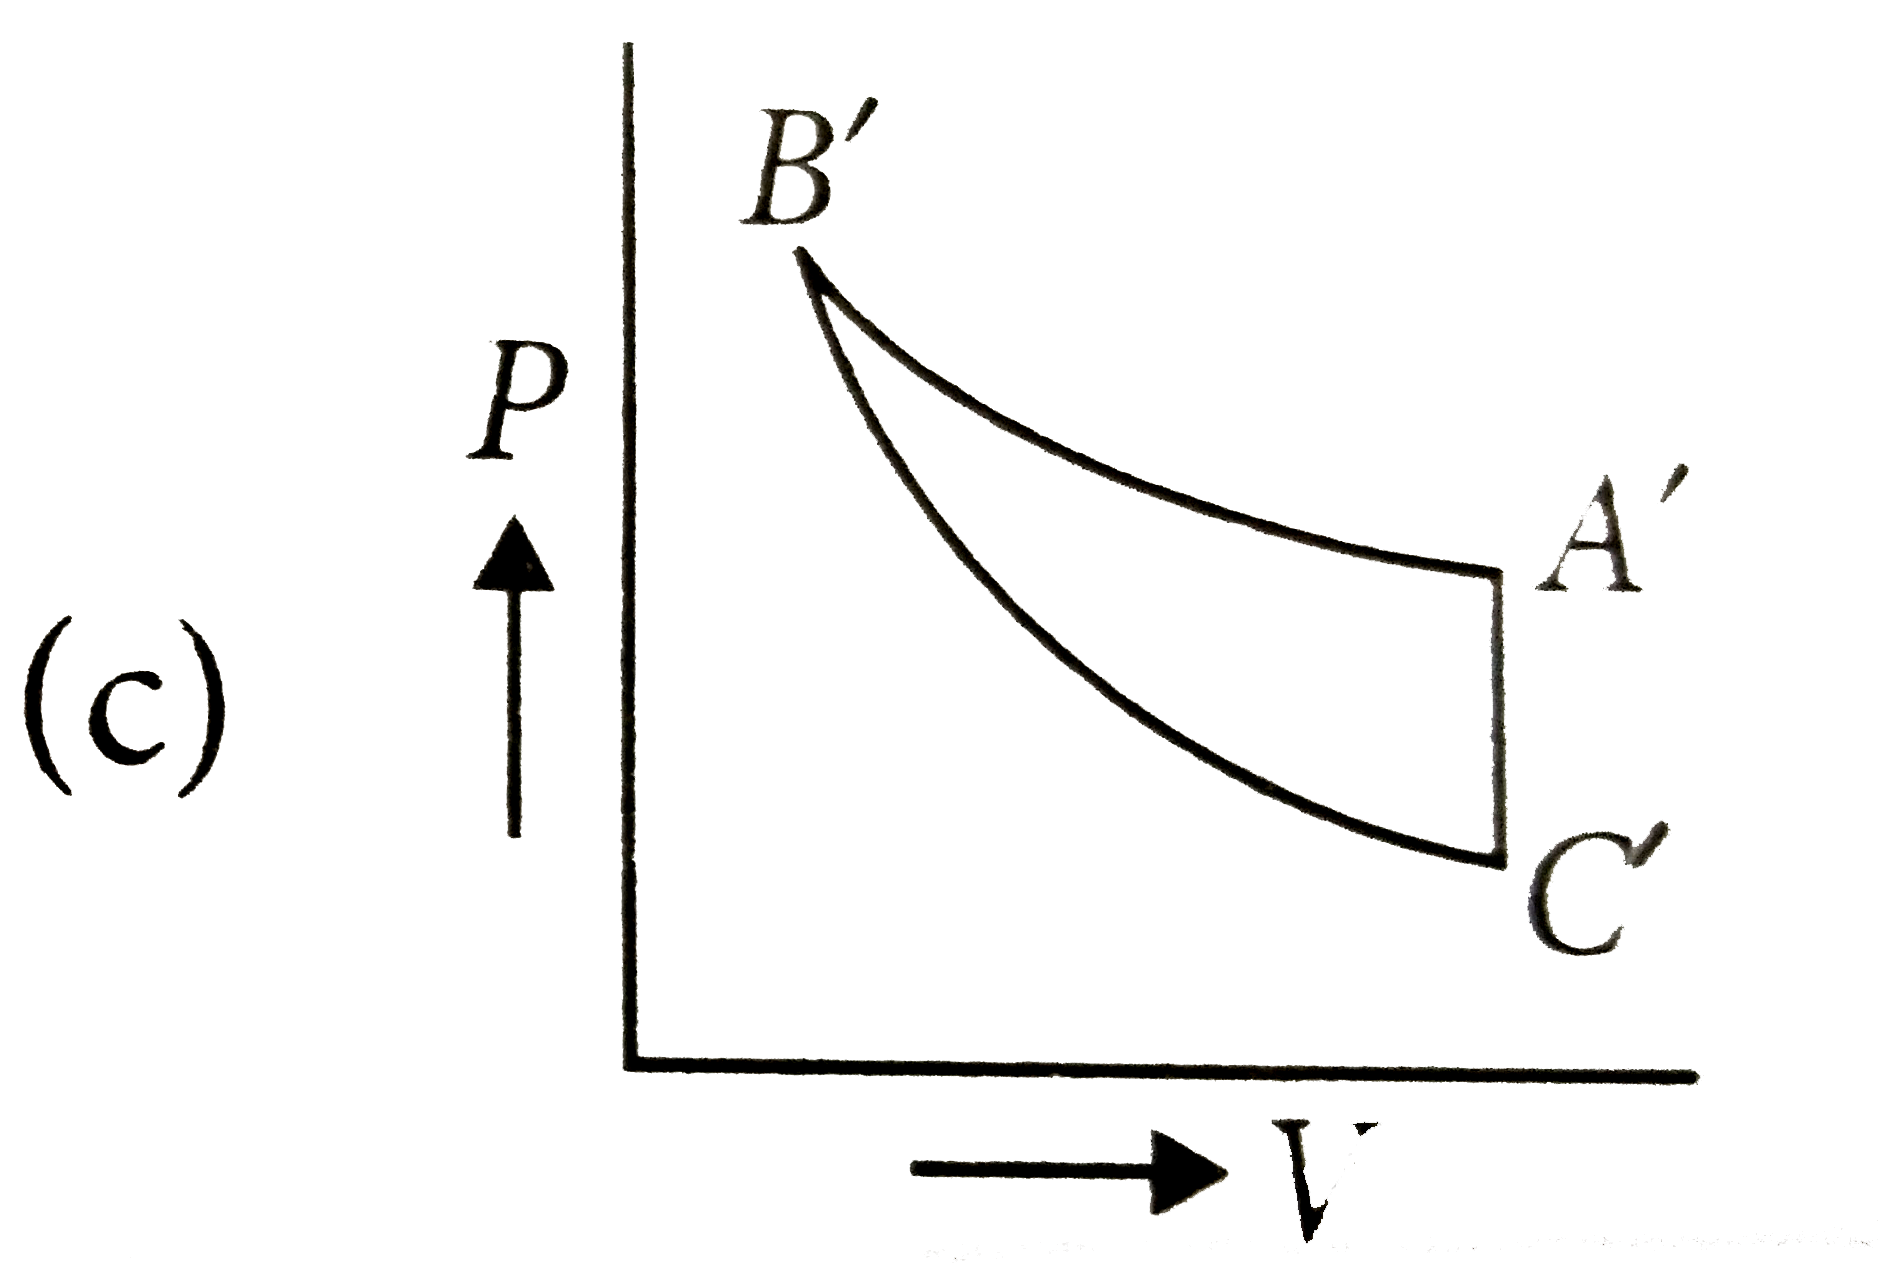 D
D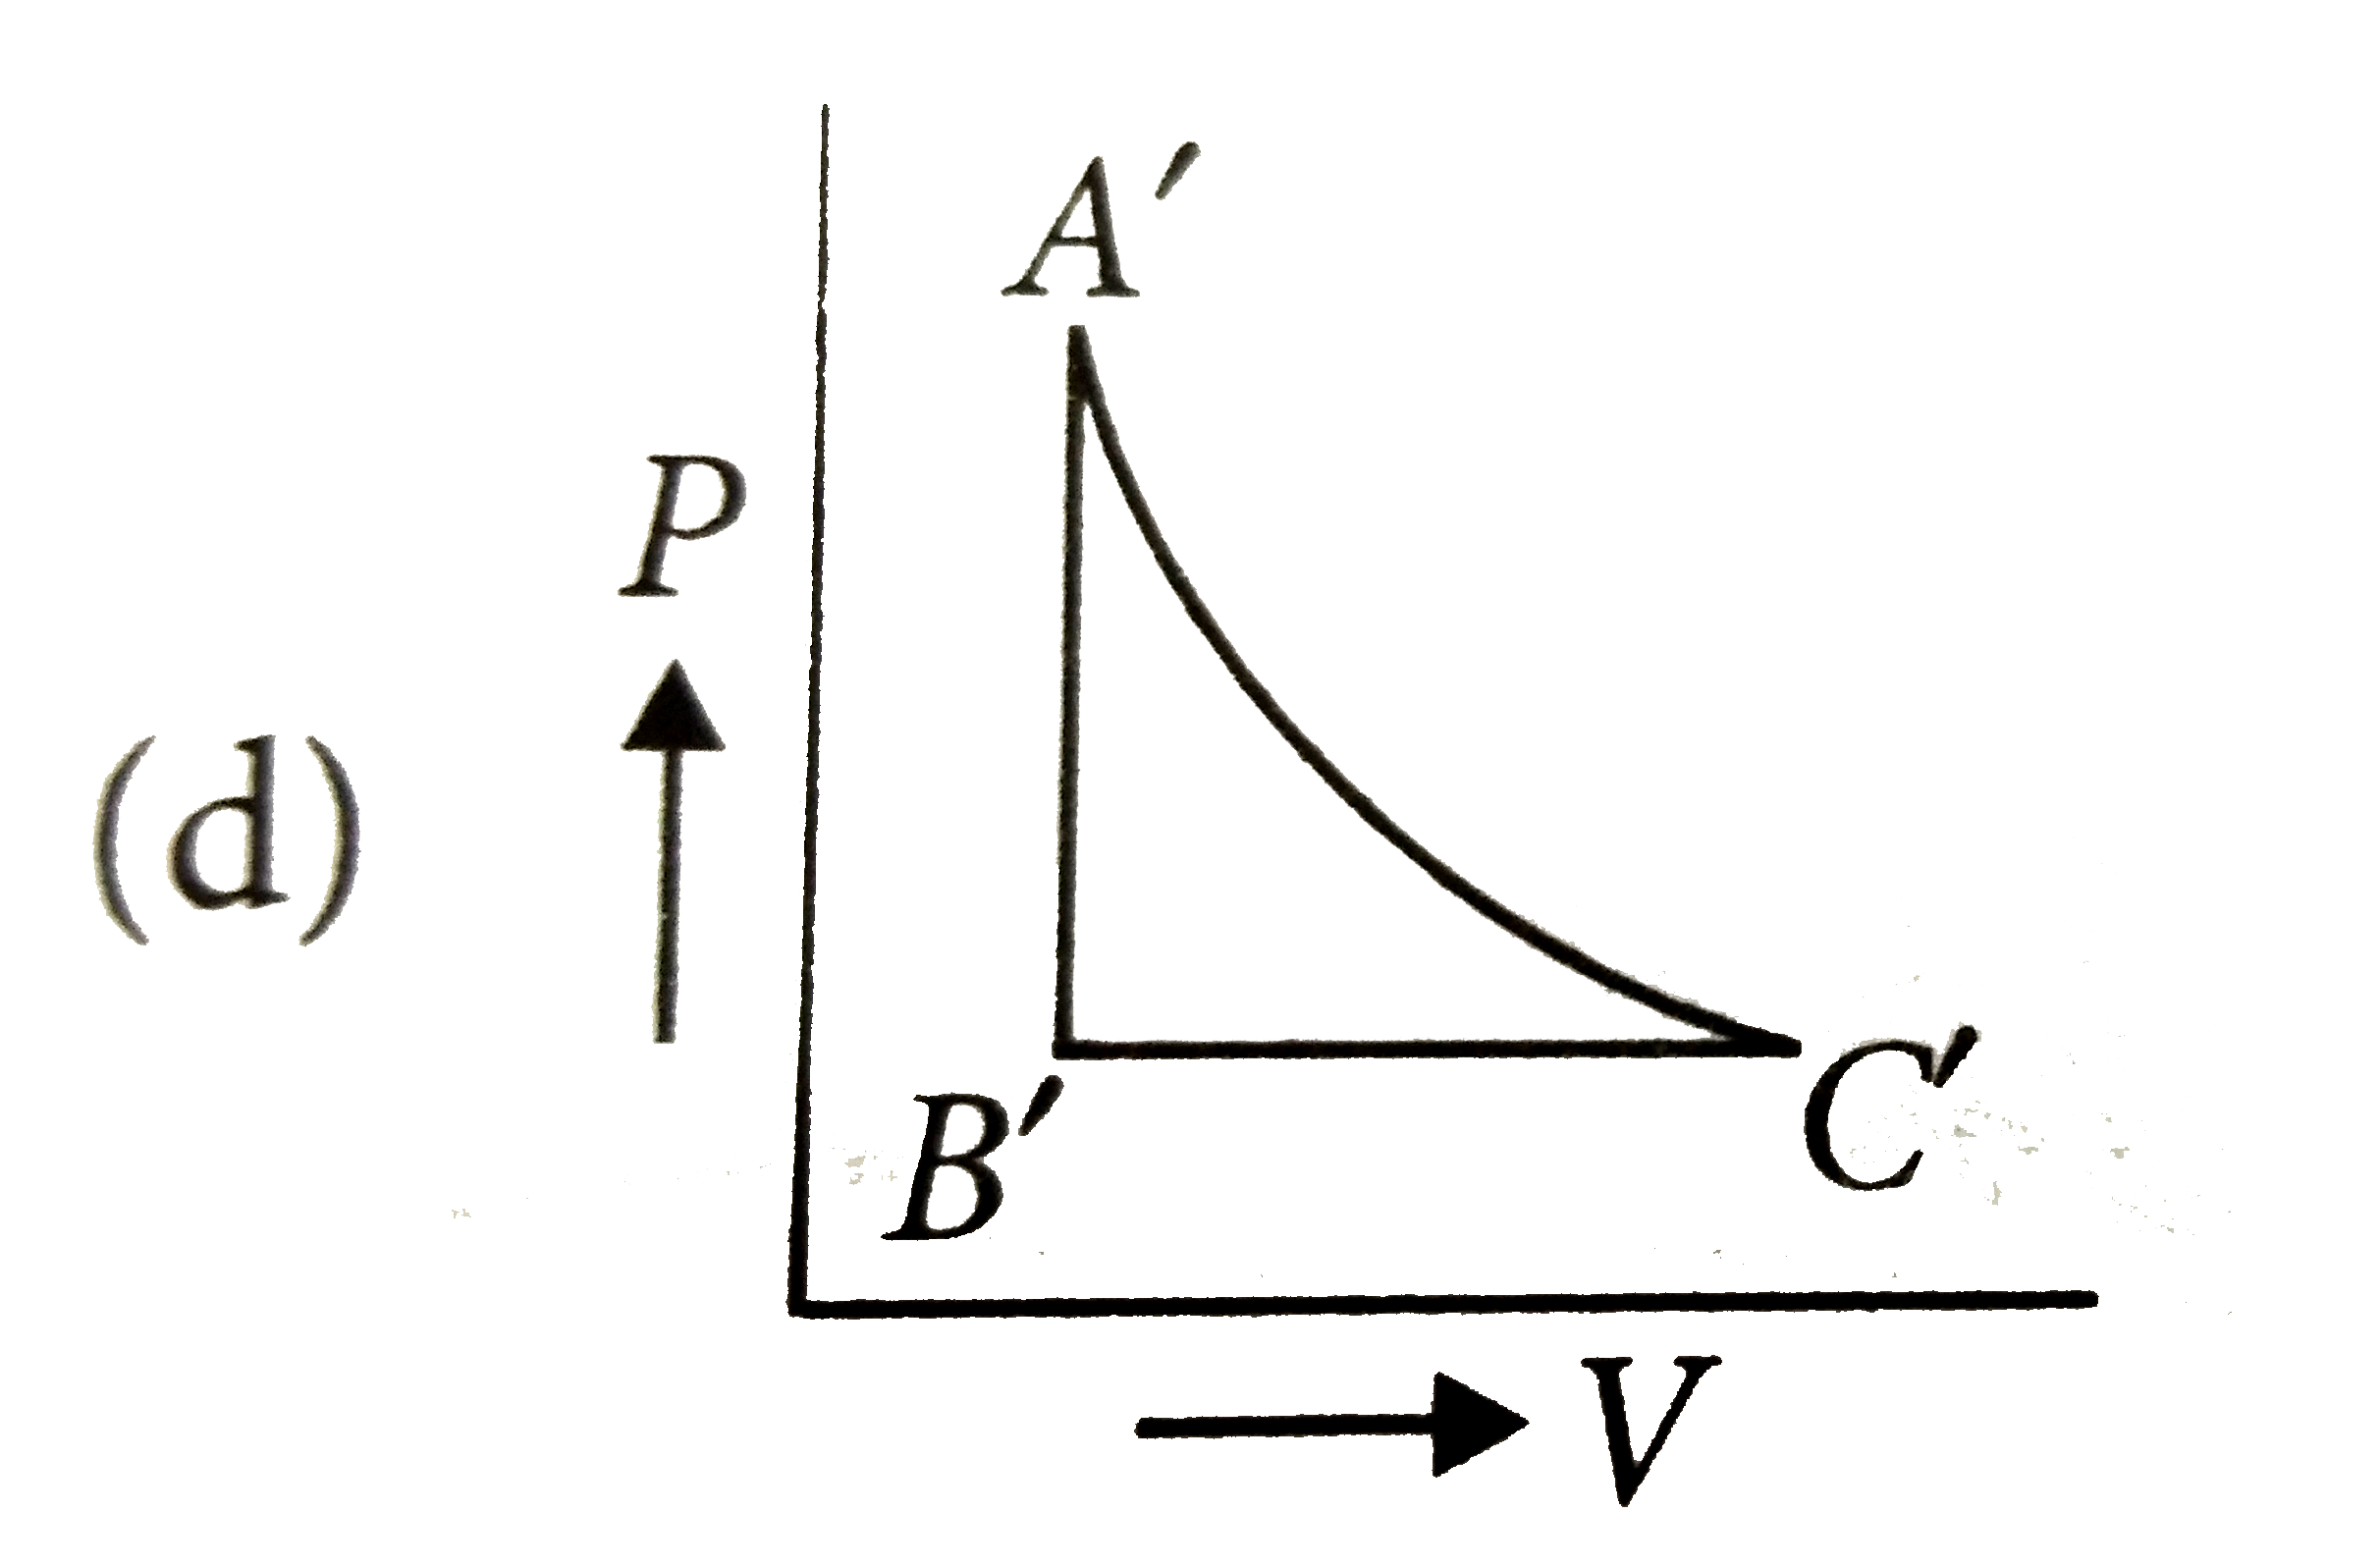
Draw P-V diagrams to show (i) isobaric process and (ii) isochoric process.
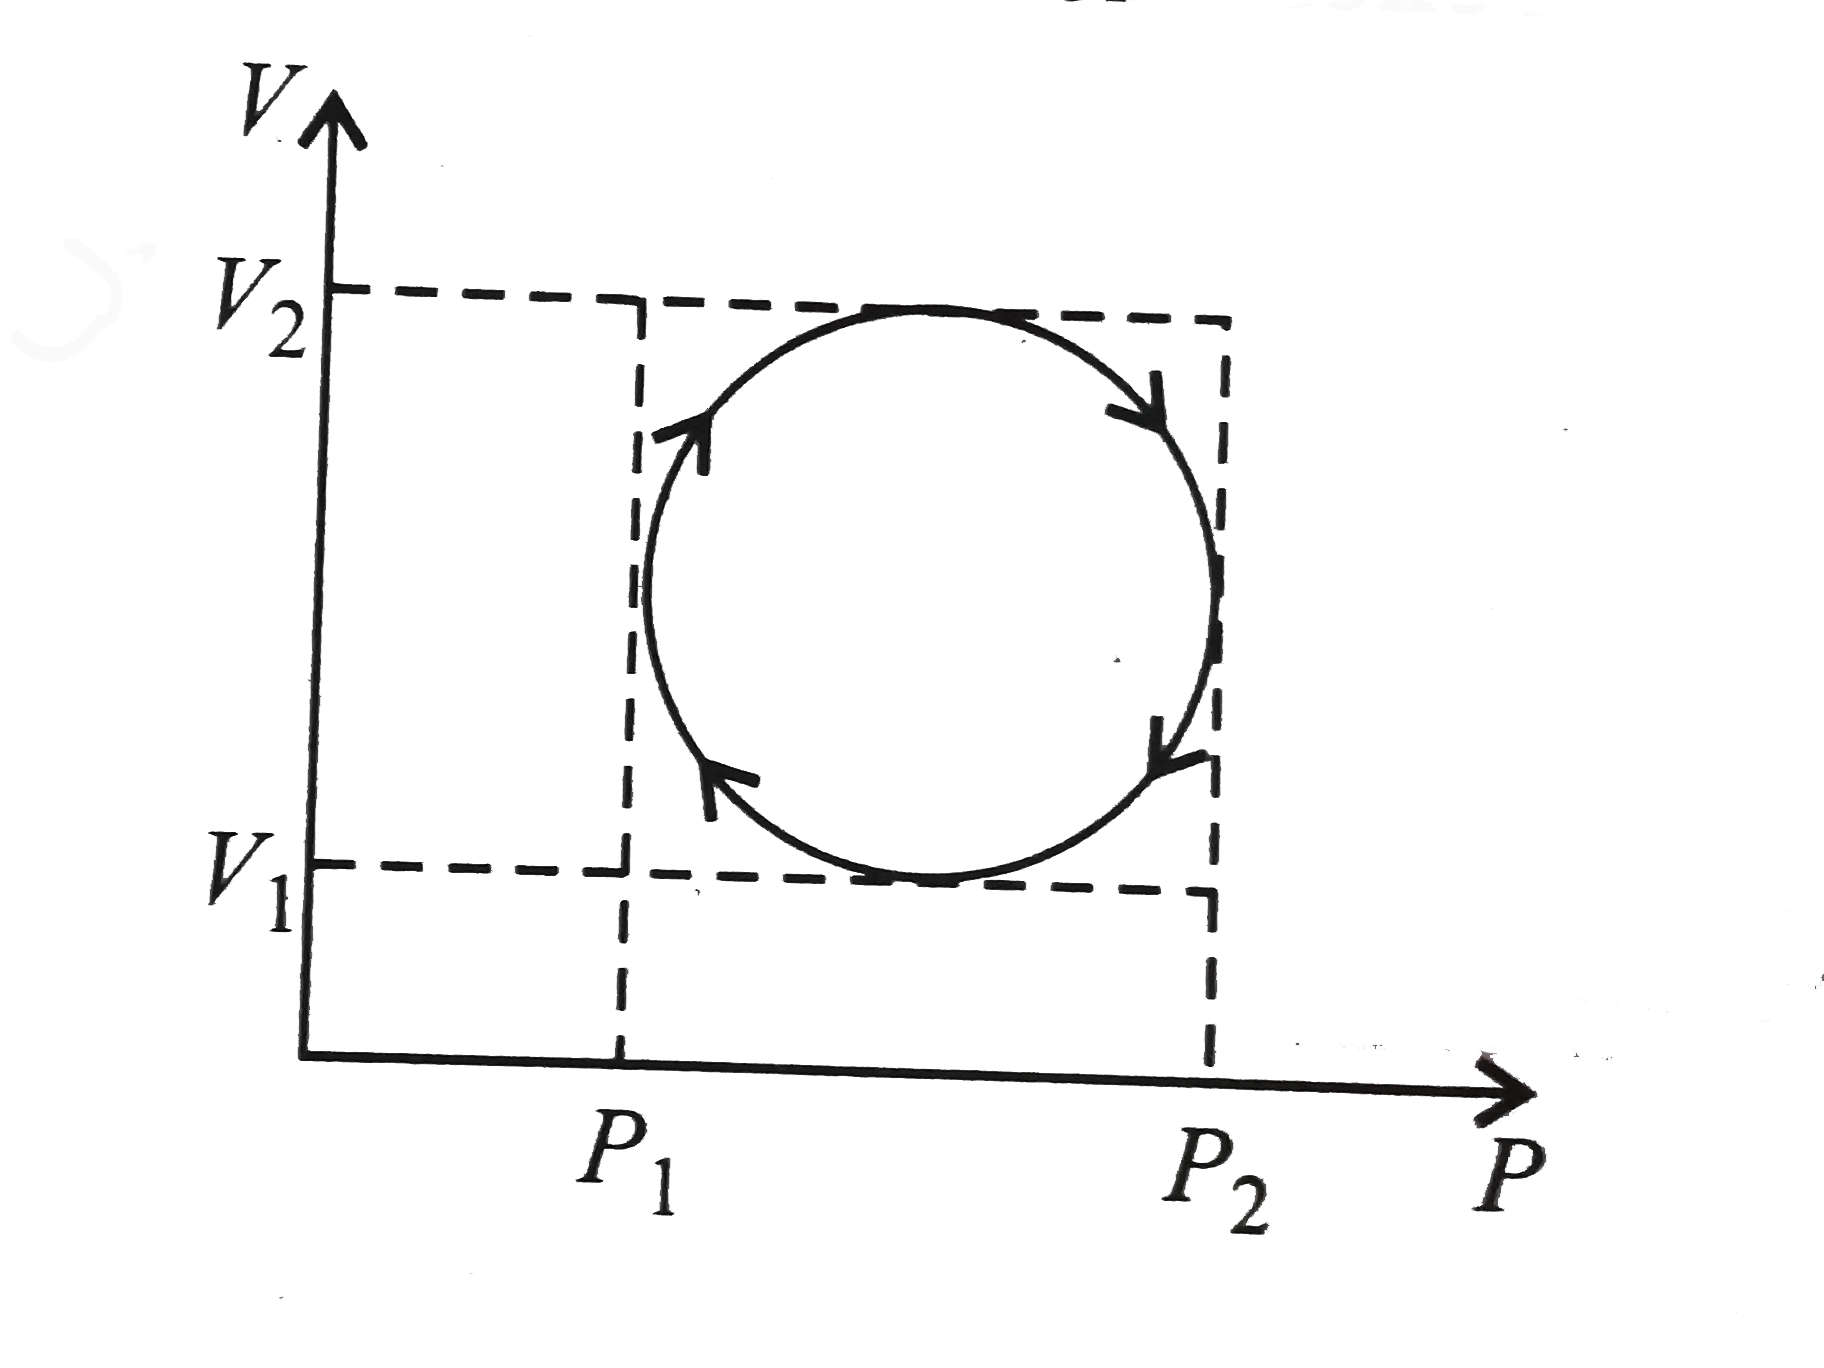
View SolutionIn the cyclic process shown on V−P diagram, the magnitude of the work done is
 View Solution
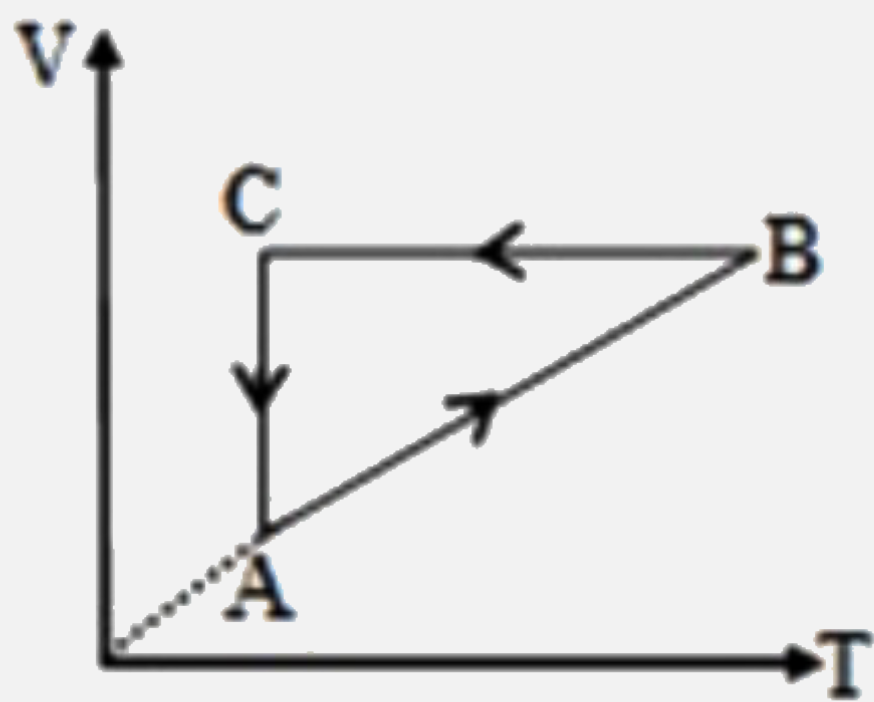
A cyclic process ABCA is shown in the V - T diagram . Process on the P – V diagram is
 View Solution
In the cyclic process shown in the V−P diagram the magnitude of the work is done isView SolutionDraw at P-T curve for isobaric process.
View SolutionDraw at P-T curve for isobaric process.
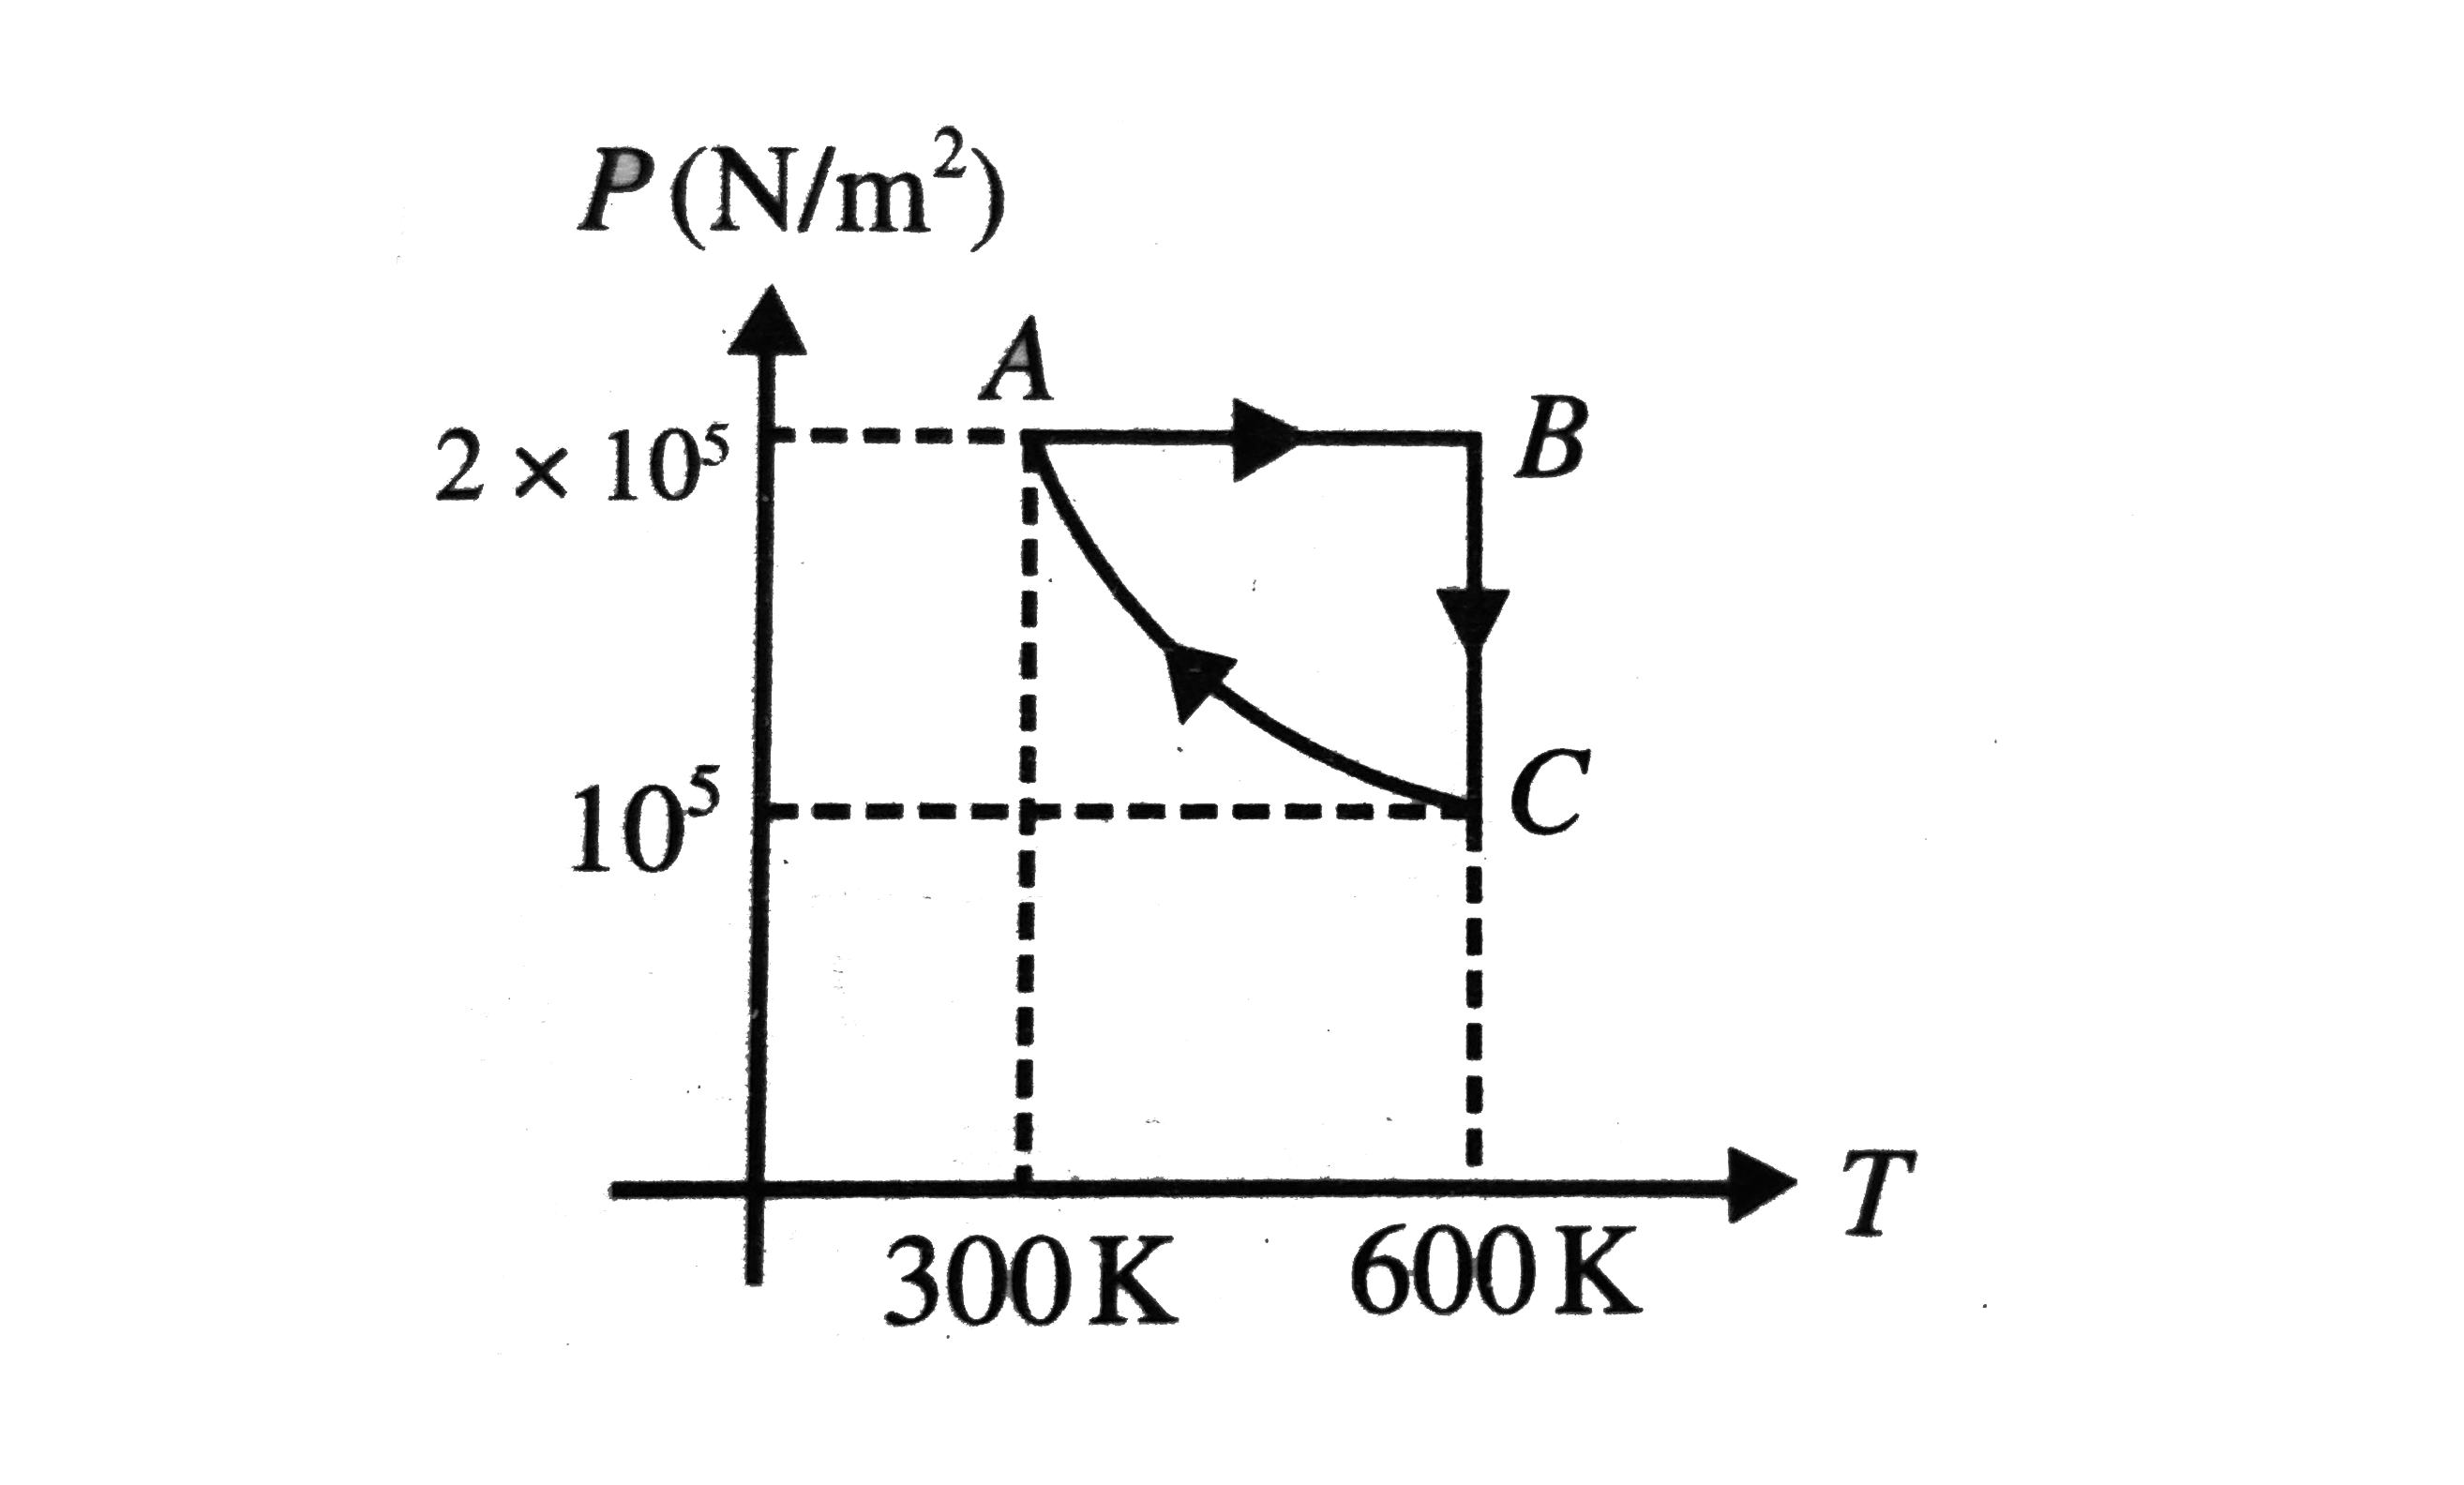
View SolutionTwo moles of monatomic ideal gas is taken through a cyclic process shown on P−T diagram in Fig. Process CA is represented as PT = constant. If efficiency of given cyclic process is
1−x121n2+15
then find x,
 View Solution

