select the correct representation of density of population (N) which can be expressed after a period of time .
The correct Answer is:A
To solve the question regarding the correct representation of the density of population (N) after a period of time t+1, we can follow these steps:
Step 1: Understand the Components
We need to identify the components that affect population density:
- Natality (b): The birth rate, which increases the population.
- Immigration (I): The arrival of new individuals into the population, which also increases the population.
- Mortality (D): The death rate, which decreases the population.
- Emigration (E): The departure of individuals from the population, which decreases the population.
Step 2: Set Up the Equation
The change in population density over time can be expressed as:
Nt+1=Nt+(increase in population)−(decrease in population)
Where:
- Nt is the population density at time t.
- The increase in population is due to natality and immigration.
- The decrease in population is due to mortality and emigration.
Step 3: Write the Formula
From the components identified, we can write the formula for population density at time t+1:
Nt+1=Nt+b+I−D−E
Where:
- b is natality,
- I is immigration,
- D is mortality,
- E is emigration.
Step 4: Simplify the Equation
Combining the terms, we can express the equation as:
Nt+1=Nt⋅b+I−D+E
This reflects the changes in population density after the time period t+1.
Final Representation
Thus, the correct representation of the density of population N after a period of time t+1 is:
Nt+1=Nt⋅b+I−D+E
We need to identify the components that affect population density:
- Natality (b): The birth rate, which increases the population.
- Immigration (I): The arrival of new individuals into the population, which also increases the population.
- Mortality (D): The death rate, which decreases the population.
- Emigration (E): The departure of individuals from the population, which decreases the population.
The change in population density over time can be expressed as:
Nt+1=Nt+(increase in population)−(decrease in population)
Where:
- Nt is the population density at time t.
- The increase in population is due to natality and immigration.
- The decrease in population is due to mortality and emigration.
From the components identified, we can write the formula for population density at time t+1:
Nt+1=Nt+b+I−D−E
Where:
- b is natality,
- I is immigration,
- D is mortality,
- E is emigration.
Combining the terms, we can express the equation as:
Nt+1=Nt⋅b+I−D+E
This reflects the changes in population density after the time period t+1.
Thus, the correct representation of the density of population N after a period of time t+1 is:
Nt+1=Nt⋅b+I−D+E
Topper's Solved these Questions
Similar Questions
Knowledge Check
Which of the following representations of I (van't Hoff factor) is not correct ?
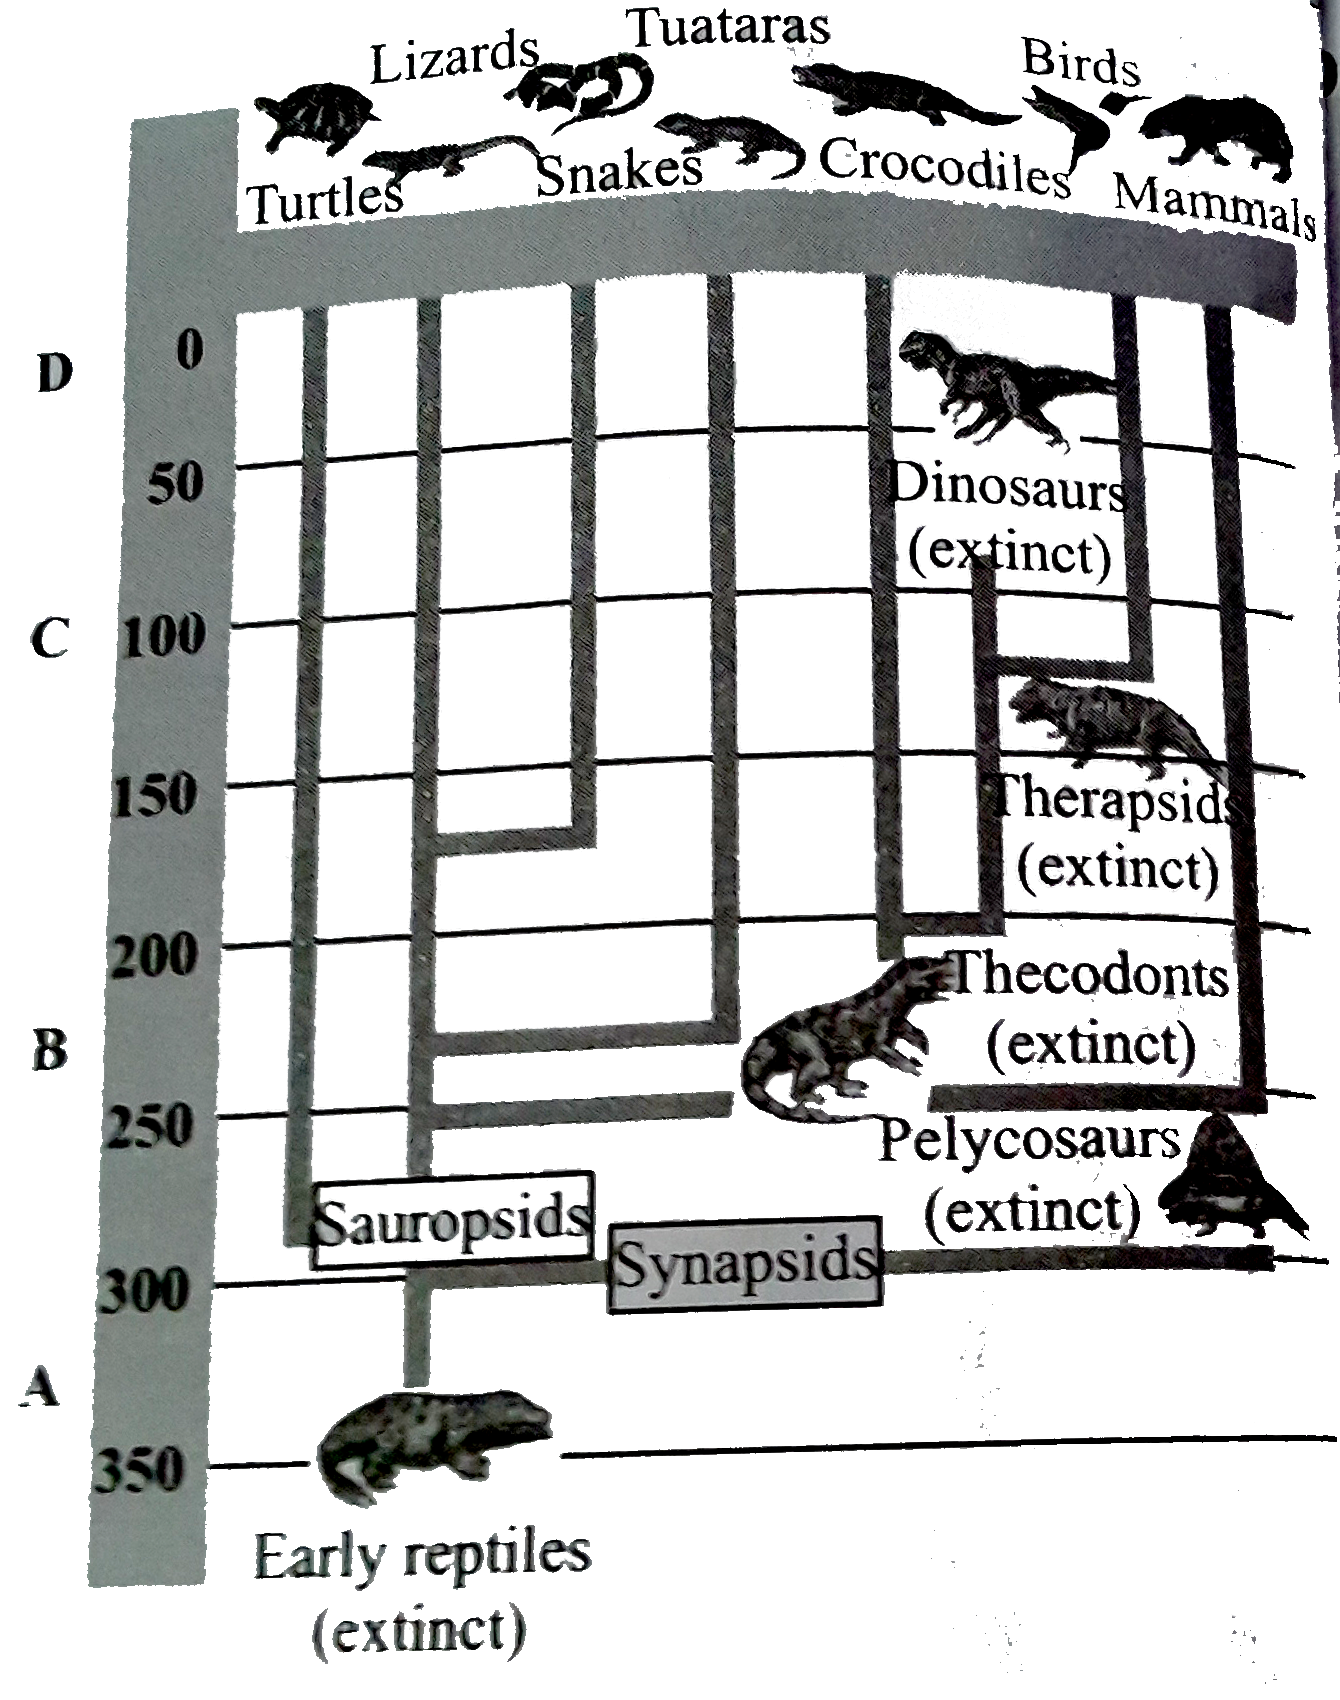
Ai=Observed colligative propertyExpected colligative propertyBi=Normal molecular mass Observed molecular massCi=Number of molecules actually present Number of molecules expected to be presentDi=Total number of particles taken before association/dissociationNumber of particles after association/dissociationFollowing is given the diagrammatic representation of evolutionary history of vertebrates through geological periods. Identify the geological periods (A,B,C and D) and select the correct option.
 AABCDCarboniferusTriassicCretaceousQuaternaryBABCDJurassicPermianTertiaryCretaceousCABCDPermianJurassicQuatermaryTertiaryDABCDCretaceousQuaternaryCarboniferousJurassic
In a population of an area, natality was equal to mortality for a given time equal to mortality for a given time period. However, the population density of the population increased, which of the following may be the reason for the increases ?
View SolutionRead the following statements and select the correct option w.r.t. population attributes
(a) Population density is necessarily measured in numbers
(b) Tiger census is often based on pug marks and fecal pellets
(c) Biomass is not a meaningful measure to know population size.
(d) Size of a population for any species is not a static parameter
View SolutionChoose correct option out of following with increase in n
where T is time period and v is velocity of an electron.
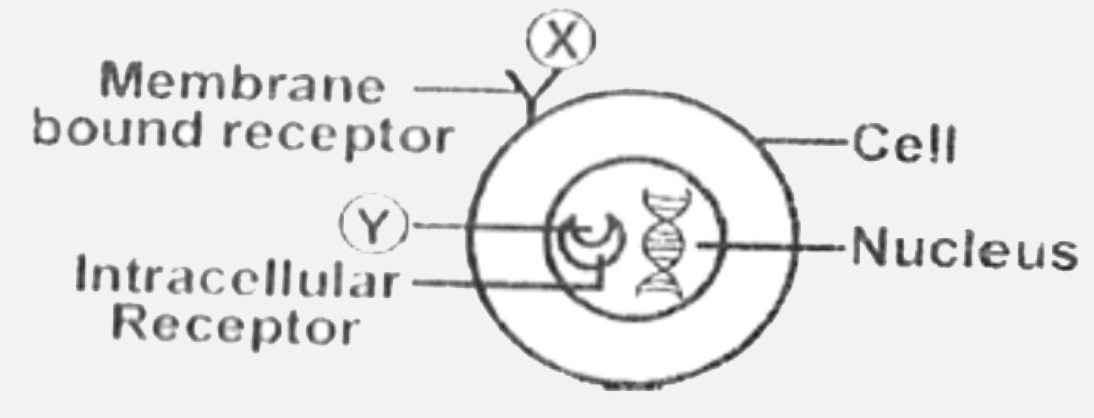
View SolutionGiven below is a schematic representation of the mechanism of hormone action. Select the set of hormones which can bind with Y.

View SolutionWhich of the following graph corresponds to a population of 2000 individuals, with 800 births and 1200 deaths over a given period of time?
View SolutionThe accuracy of measurement also lies in the way the results is expressed. The number of digits to which a value is to be expressed is one digit more than number of digits after after an operation is carried out on the given values. The error can be minimised by many trials and using the correct methods are instruments.
The number of significant figures can reduce in
View Solution