Which of the following graphs best depicts the changes in one cycle of PCR ?


The correct Answer is:B
Step by step video solution for Which of the following graphs best depicts the changes in one cycle of PCR ? by Biology experts to help you in doubts & scoring excellent marks in Class 12 exams.
Updated on:21/07/2023Topper's Solved these Questions
Similar Questions
Knowledge Check
Which of the following graphs best describes the velocity of the woman on her walk ?
A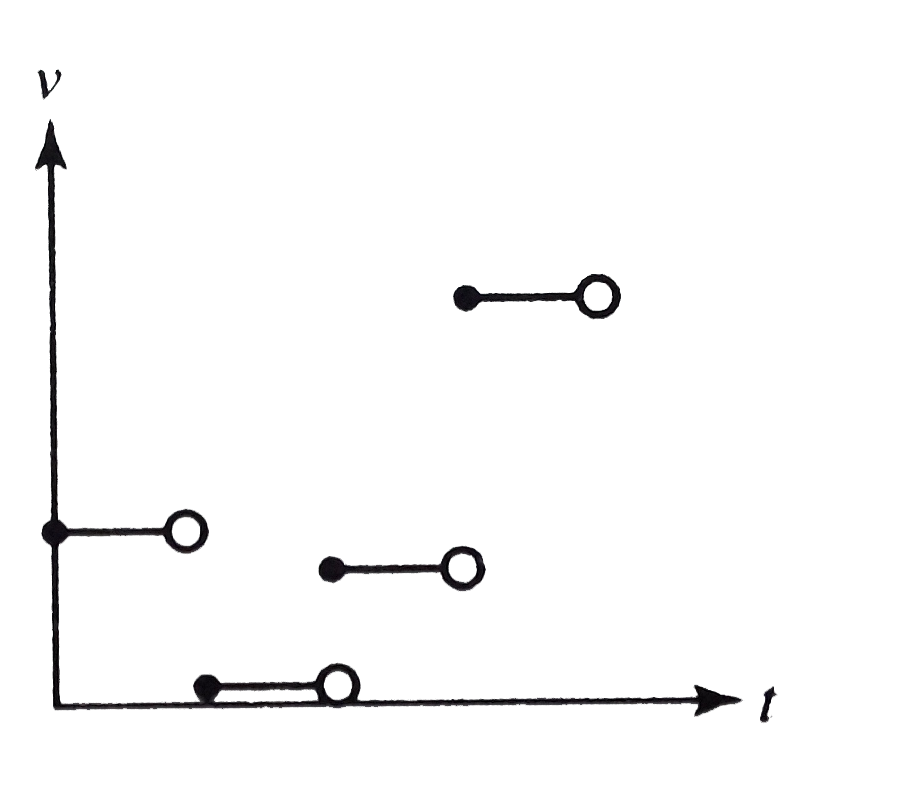 B
B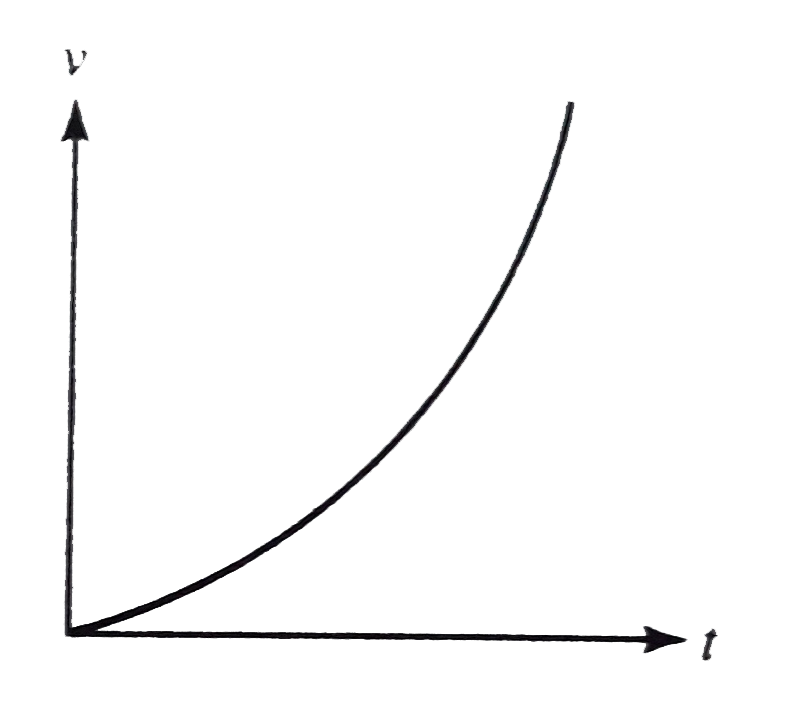 C
C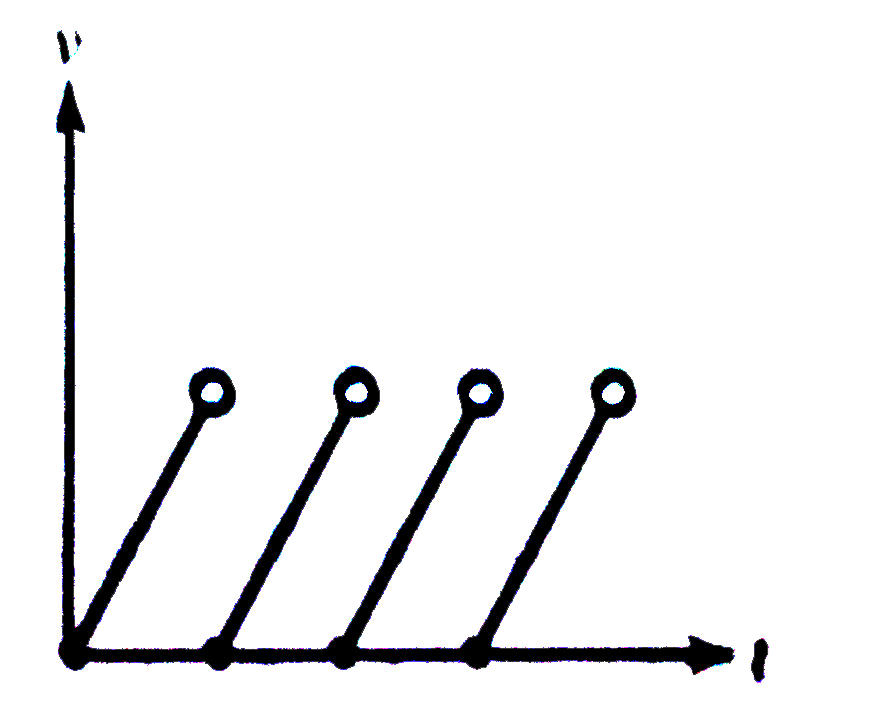 D
D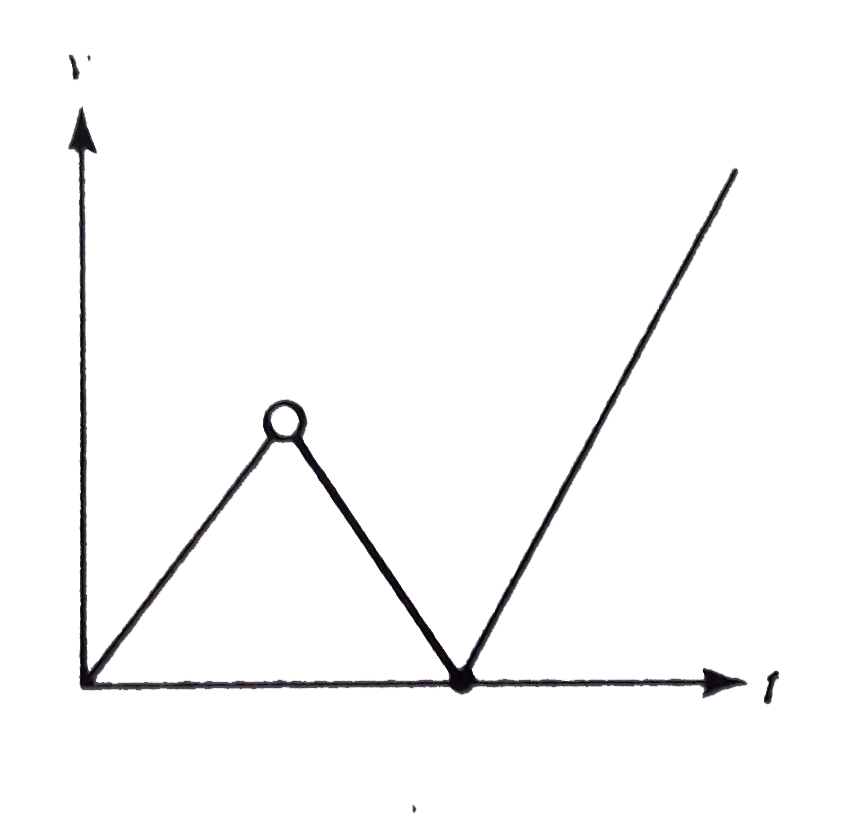
Which of the following graphs correctly depicts the rate of photosynthesis of sun plant (P) and shade plant (Q)?
A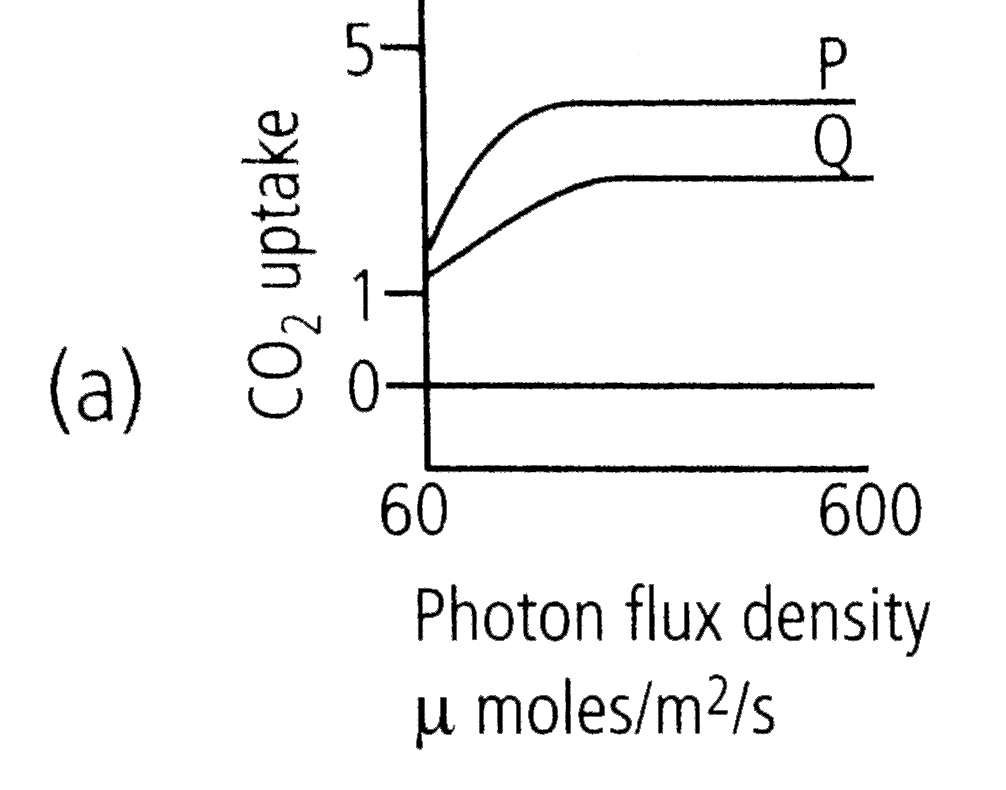 B
B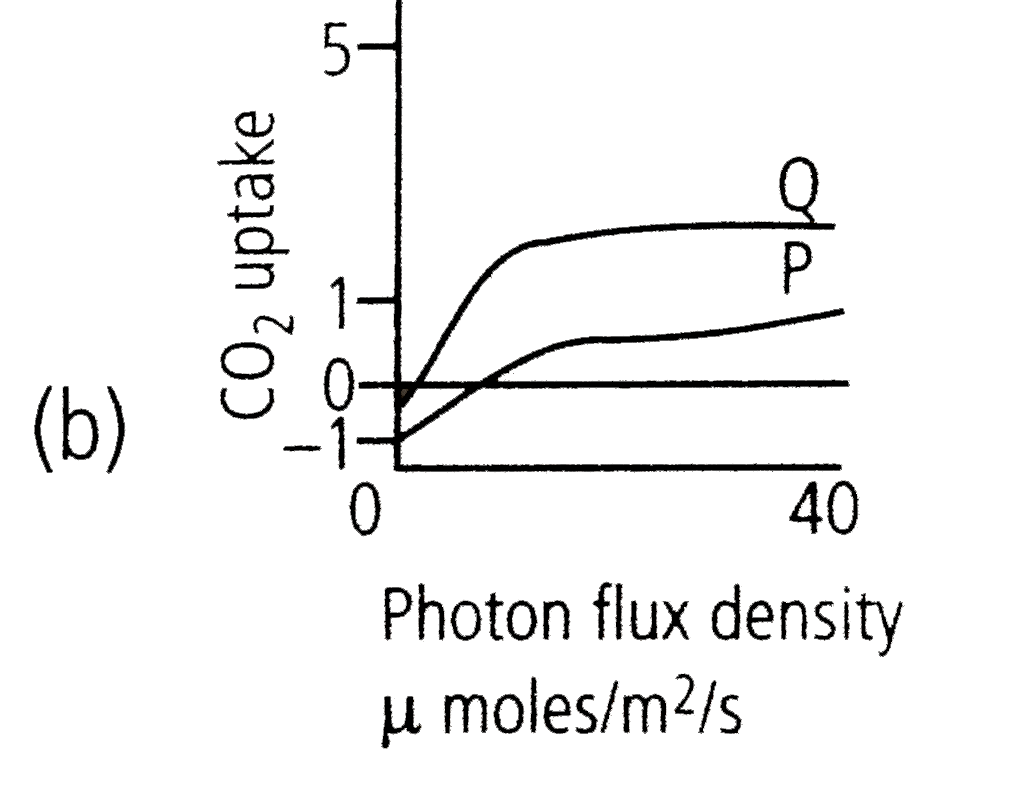 C
C D
D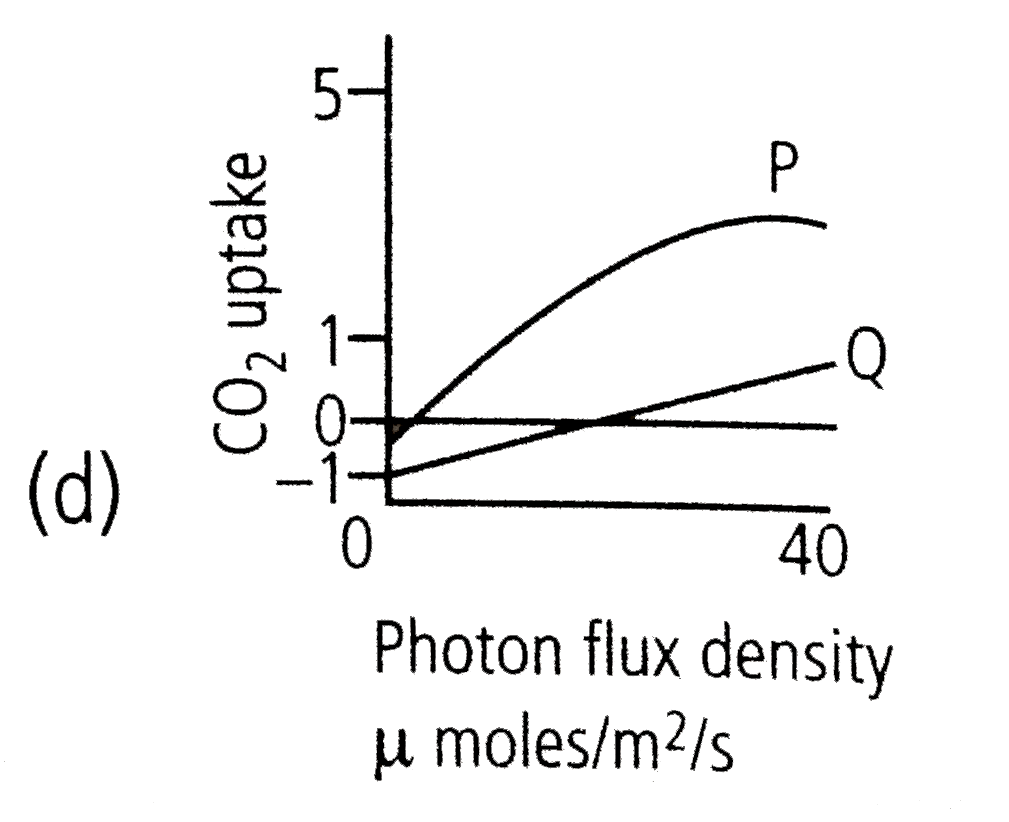
Which of the following correctly depicts the dental formula of a child?
A21122112B21022102C21232123D21112111
100 mL of 0.1 HCl is taken in a beaker and to it 100 mL of 0.1 M NaOH is added in steps of 2ml and the pH is continuously measured . Which of the following graphs correctly depicts the change in pH
View SolutionThe graph shown the variation with times t of the velocity v of an object . Which one of the following graphs best represents the variation of acceleration a of the object with time t?

View SolutionA constant voltage at different frequencies is applied across a capacitance. C as shown in the figure. Which of the following graphs correctly depicts the varitaion of current with frequency?
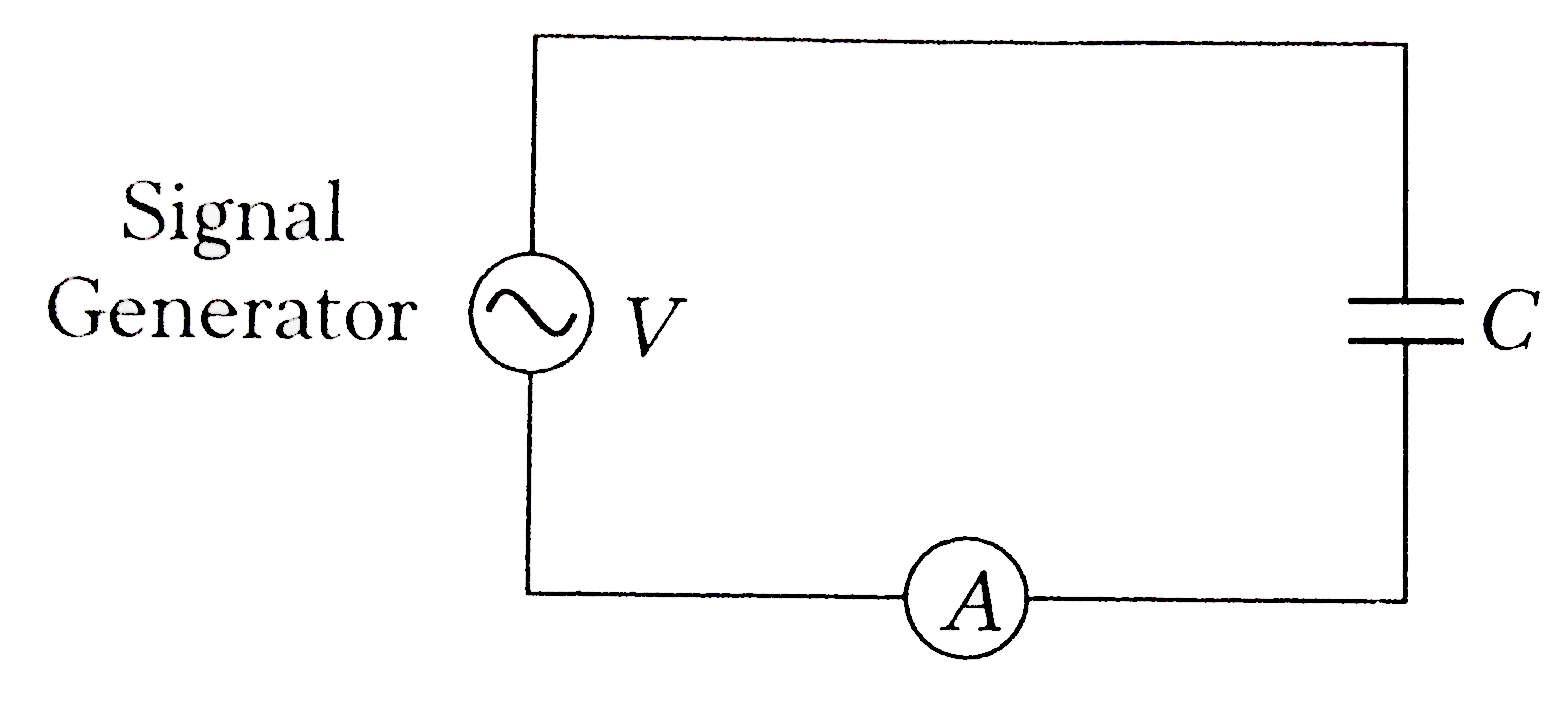
View SolutionWhich of the following depict the same ?

View SolutionIn which of the following graphs, the total change in momentum is zero ?
View Solution
