एका टोपलीतील 10 टोमॅटोंचे वजन ग्रॅममध्ये प्रत्येकी 60, 70, 90, 95, 50, 65, 70, 80, 85, 95 अशी आहेत. यावरून टोमॅटोंच्या वजनांचा मध्यक काढा.
Step by step video & image solution for एका टोपलीतील 10 टोमॅटोंचे वजन ग्रॅममध्ये प्रत्येकी 60, 70, 90, 95, 50, 65, 70, 80, 85, 95 अशी आहेत. यावरून टोमॅटोंच्या वजनांचा मध्यक काढा. by Maths experts to help you in doubts & scoring excellent marks in Class 9 exams.
Updated on:21/07/2023Topper's Solved these Questions
Similar Questions
एका शाळेतील इयत्ता विच्या विघाथ्र्यानि प्रथम घटक चाचणीत गणितात पैकी मिळवलेले गुण खालीलप्रमाणे आहेत.20, 6, 14, 10, 13, 15,12,14,17, 17, 18,11,19,9,16,18,14, 7,17,20,8,15,16,10,15,12,18,17,12,11,11,10,16,14,16,18,10,7,17,14,20,17,13,15,18,20,12,12,15,10
येथे संकलित केलेल्या संख्यात्मक माहितीस काय म्हणतात ?....कच्ची सामग्री.
यातील प्रत्येक संख्याले काय म्हणतात ?...प्राप्तक.
वरील माहितीवरून खालील प्रश्नाची उत्तरे मिळवा.
(i) 15 गुण मिळवणारे एकूण विध्यार्थी किती ?
View Solutionखालीलपैकी योग्य पर्याय निवडा.
खालीलपैकी कोणती सामग्री प्राथमिक सामग्री नाही ?
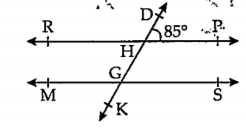
View Solutionआकृतीमध्ये रेषा RP || रेषा MS व रेषा DK ही त्यांची छेदिका आहे. ∠ DHP = 85∘ तर खालील कोनांची मापे काढा.

∠RHD
View SolutionThe following is the distribution of weights (in kg) of 50 persons: Marks:, 50-55, 55-60, 60-65, 65-70, 70-75, 75-80, 80-85, 85-90 No. of Person, 12, 8, 5, 4, 5, 7, 6, 3 Draw a histogram for the above data.
View SolutionCan the angles 110∘,80∘,70∘and95∘ be the angles of a quadrilateral ? Why or why not?
View SolutionCalculate average deviation from the data of marks obtained by 10 students .
90 , 64 , 79 , 33 , 85 , 59 , 60 , 70 , 40, 95
View SolutionCalculate standard deviation from the data on marks obtained by 10 students : 33 , 40 , 59 , 60 , 64 , 70 , 79 , 85 , 90 , 95
View Solutionकिसी कक्षा में विद्यार्थियों द्वारा प्राप्त निम्नलिखित अंको की बारबारता सारणी बनाएँ (वर्ग-अंतराल 11-20, 21-30 इत्यादि ले ) |
प्राप्तांक : 80, 85, 88, 70, 80, 45, 35, 70, 85, 95, 88, 20, 70, 65, 76, 87, 75, 88, 90, 65, 85, 65, 74, 95, 75, 80, 74, 92, 90, 20.
View SolutionFind the median of the given data : 50, 70, 90, 94, 40, 65, 70, 80, 85, 95.
View Solutionएक विद्यालय की नवीं कक्षा के 30 विद्यार्थियों द्वारा प्राप्त किए गए अंक निम्नलिखित है। विद्यर्थियों के प्राप्तांकों का माध्य ज्ञात कीजिए।
10 20 36 92 95 40 50 56 60 70
92 88 80 70 72 7036 40 36 40 92 40
50 5056 60 70 60 60 68
View SolutionFind the mean of the marks obtained by 30 students of Class IX of aschool, given in Example 2.10 20 36 92 95 40 50 56 60 7092 88 80 70 72 70 36 40 36 40 92 40 50 50 56 60 70 60 60 88
View SolutionCan the angles 110∘,80∘,70∘and95∘ be the angles of a quadrilateral ? Why or why not?
View SolutionThe following is the distribution of weights (in kg) of 50 persons: Weight (in kg) 50-55 55-60 60-65 65-70 70-75 75-80 80-85 85-90 No. of Person 12 8 5 4 5 7 6 3 Draw a histogram for the above data.
View Solution70, 80, 50, 60, 70, 40, 50, 90, 50, 30 का बहुलक होगा
View SolutionFind the median of the given data : 50, 70, 90, 94, 40, 65, 70, 80, 85, 95.
View Solution
