Plot a graph showing variation in the concentration of reactants against time for a zero order reaction.Solution in Malayalam
linear with +ve slope and zero intercept
linear with -ve slope and zero intercept
linear with -ve slope and non zero intercept
a curve asymptotic to concentration axis
The correct Answer is:C
Step by step video, text & image solution for Plot a graph showing variation in the concentration of reactants against time for a zero order reaction. by Chemistry experts to help you in doubts & scoring excellent marks in Class 12 exams.
Updated on:21/07/2023Topper's Solved these Questions
Similar Questions
Glucose or sucrose are soluble in water, but,cyclohexane or benzene (simple six membered ring compounds) are insoluble in water. Explain.
View SolutionSleeping pills are recommended by doctors' to the patients suffering from sleeplessness but it is not advisable to take its doses without consultation with the doctor. Why?
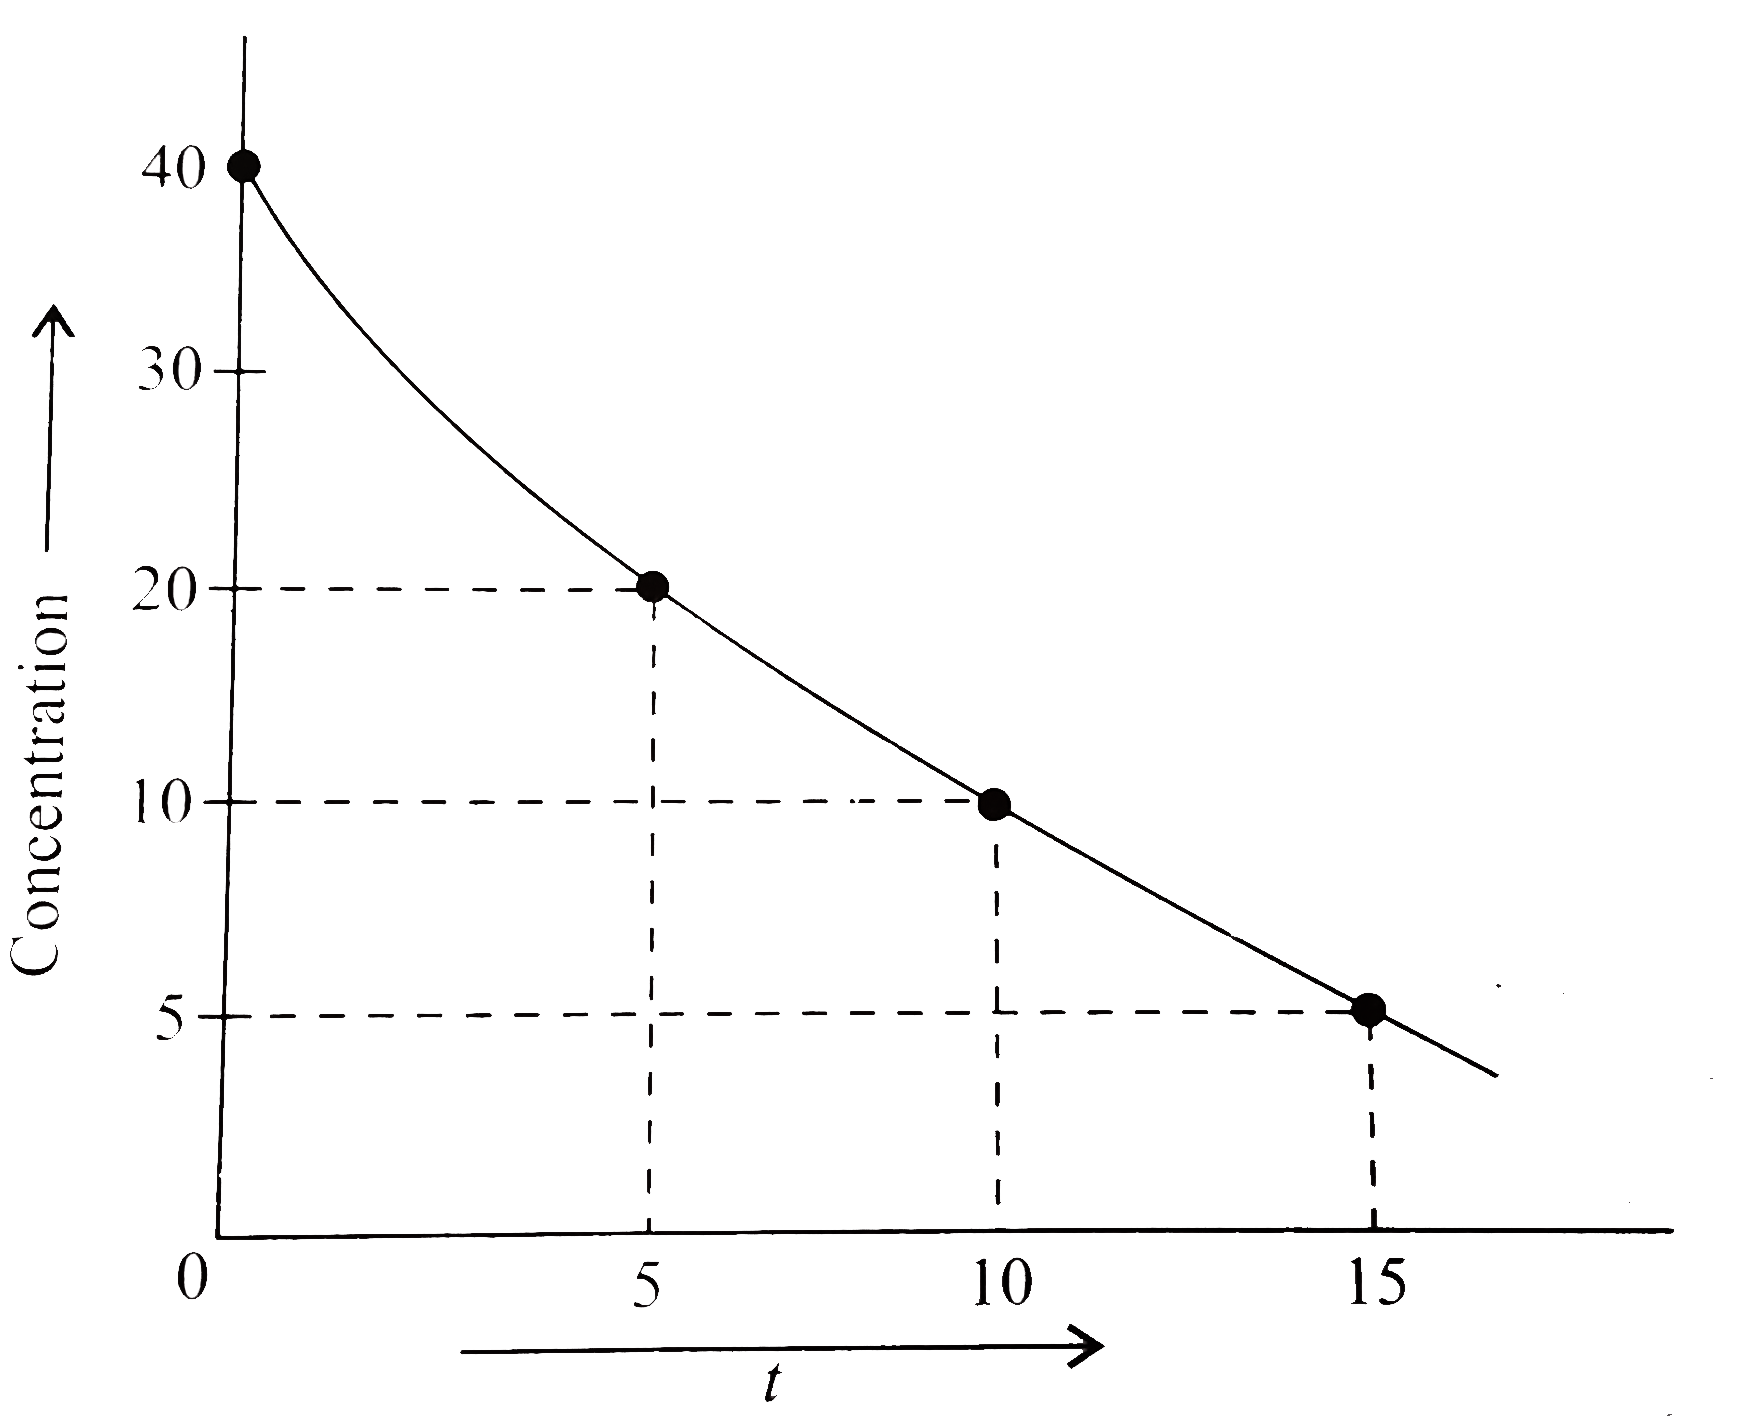
View SolutionFor a reaction , a graph was plotted between reactant concentration c and time as shown in the figure below.

Identify the order of the reaction with respect to the reactant. Can the concentration of the reactant be theoretically zero after infinite time?
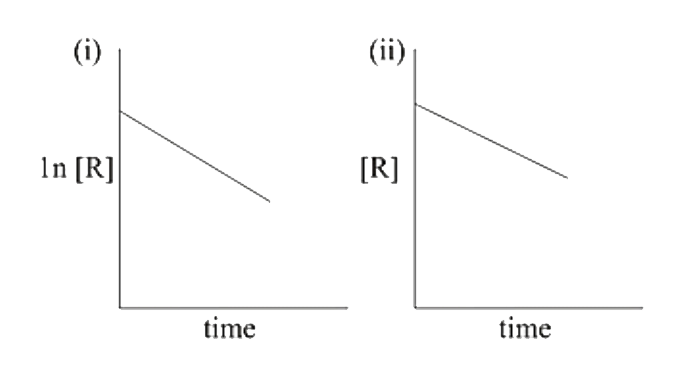
View SolutionThe given plots represent the variation of the concentration of a reactant R with time for different reactions (i) and (ii). The sum of orders of the reactions is ________ .
View SolutionWhat will be the nature of the graph showing the concentration of the reactant and time of a first order reaction ?
View SolutionPlot a graph of concentration of a reactant at time t, [ (a-x)] against time for a first order reaction .Here a = initial concentration of the reactant an x = change in concentration of the reactant at any time 1 during the reaction.
View Solutionplot a graph of reaction -rate vs concentration of the reactant for a fist order reaction.
View SolutionThe given plots represent the variation of the concentration of a reactant R with time for different reactions (i) and (ii). The respective orders of the reactions are:
View SolutionThe given plots represent the variation of the concentration of a reactant R with time for two different reaction (i) and (ii) The respective orders of the reactions are

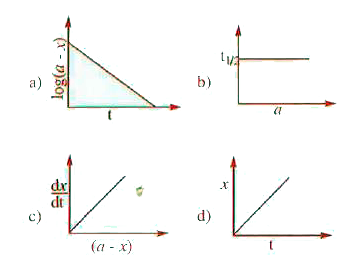
View SolutionWhich of the following graphs represent a first order reaction (a=initial concentration of reactant, x=concentration of reactant consumed, t=time)

View SolutionFor Zero Order Reaction, Plot of Concentration of Reactant v/s time is a straight line graph with
View SolutionThe given plots represent the variation of the concentration of a reactant R with time for two different reaction (i) and (ii) The respective orders of the reactions are

View SolutionPlot a graph showing variation in the concentration of reactants against time for a zero order reaction.
View SolutionFor a given reaction the logarithm of the concentration of the reactant plotted against time gave a straight line with negative slope . The order of the reaction is
View SolutionFor a reaction , a graph was plotted between reactant concentration c and time as shown in the figure below.

Identify the order of the reaction with respect to the reactant. Can the concentration of the reactant be theoretically zero after infinite time?
View SolutionThe given plots represent the variation of the concentration of a reactant R with time for different reactions (i) and (ii). The sum of orders of the reactions is ________ .
View Solution
