For the shown graph slope of graph from point A to point B :
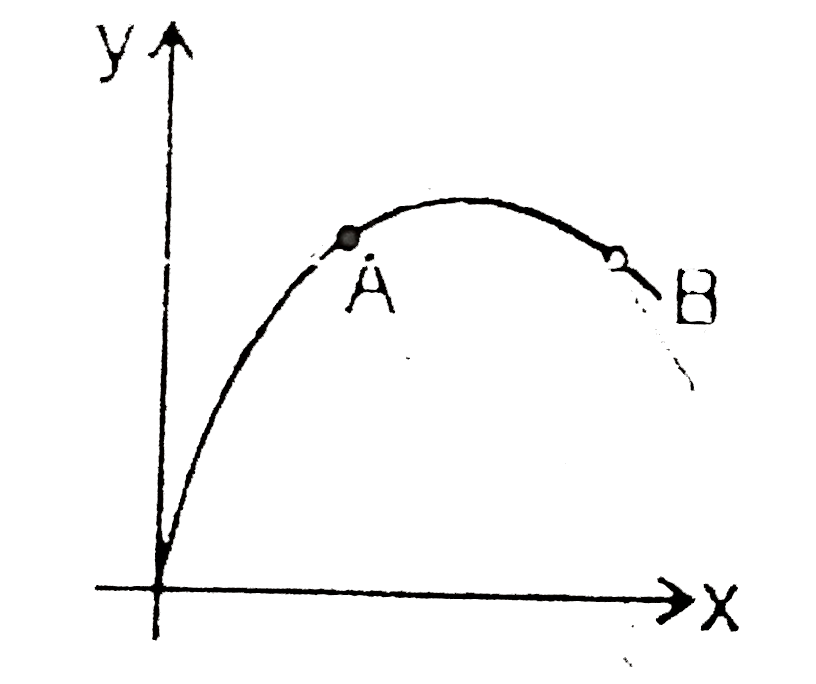
Continuously decreases
Continuously increases
First increases then decreases
First decreases then increases
The correct Answer is:A
Step by step video & image solution for For the shown graph slope of graph from point A to point B : by Physics experts to help you in doubts & scoring excellent marks in Class 12 exams.
Updated on:21/07/2023Topper's Solved these Questions
- TEST PAPERSBOOK - RESONANCE ENGLISHCHAPTER - TEST PAPERSEXERCISE - PART - II PHYSICS
106 Videos
- SIMPLE HARMONIC MOTION BOOK - RESONANCE ENGLISHCHAPTER - SIMPLE HARMONIC MOTION EXERCISE - Advanced Level Problems
13 Videos
- TEST SERIESBOOK - RESONANCE ENGLISHCHAPTER - TEST SERIESEXERCISE - PHYSICS
130 Videos
Similar Questions
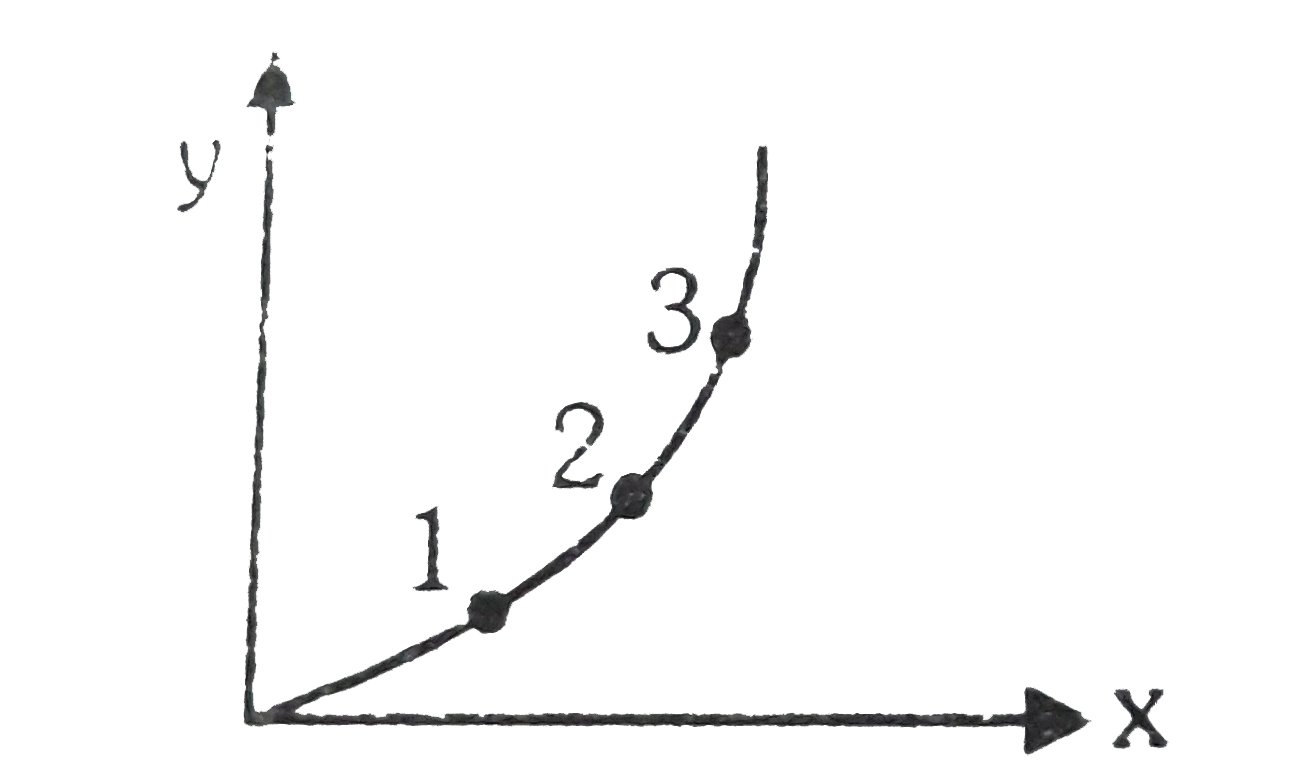
The slope of graph as shown in figure at points 1,2 and 3 is m1,m2 and m3 respectively then
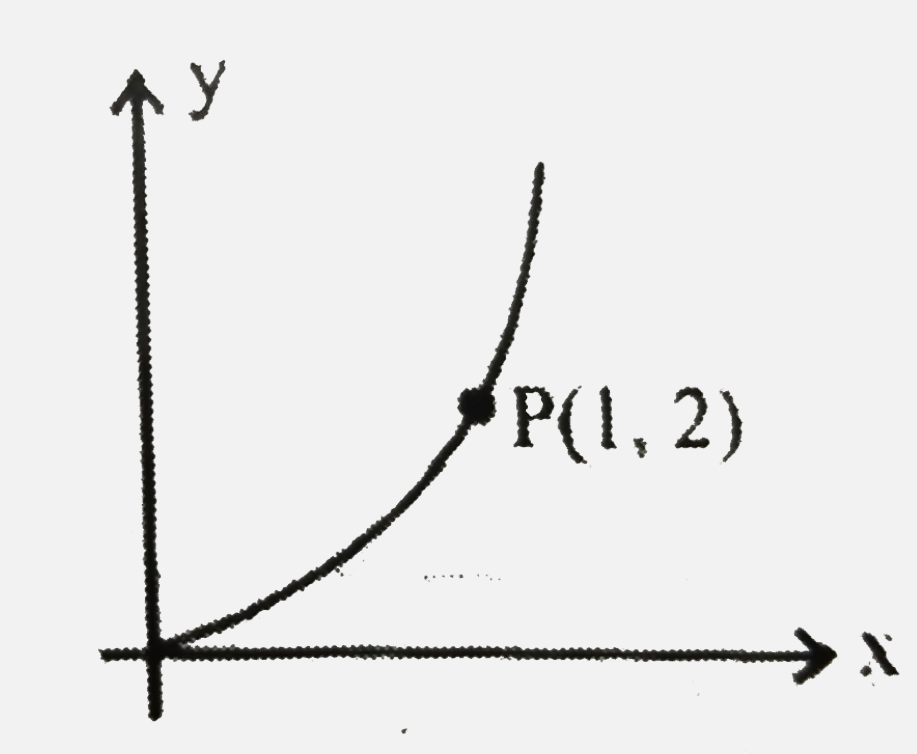
View SolutionThe equation of graph shown in figure is y=2x2. The slope of graph at point P is :
View SolutionDraw the graphs of y=x and y=−x in the same graph. Also, find the coordinates of the point where the two lines intersect.
View SolutionDraw the graphs of y=x and y=−x in the same graph. Also, find the coordinates of the point where the two lines intersect.
View SolutionThe slope of P-V graph for isochoric process is
View SolutionOn a graph paper, draw the lines x=3andy=−5. Now, on the same graph paper, draw the locus of the point which is equidistant from the given lines.
View SolutionWhat is the slope of x-t graph of a stationary object?
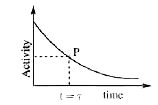
View SolutionThe activity of a certain radioactive sample is plotted against time in graph. If the initial slope of the curve is m, then find the slope of the curve at point P ?
View Solution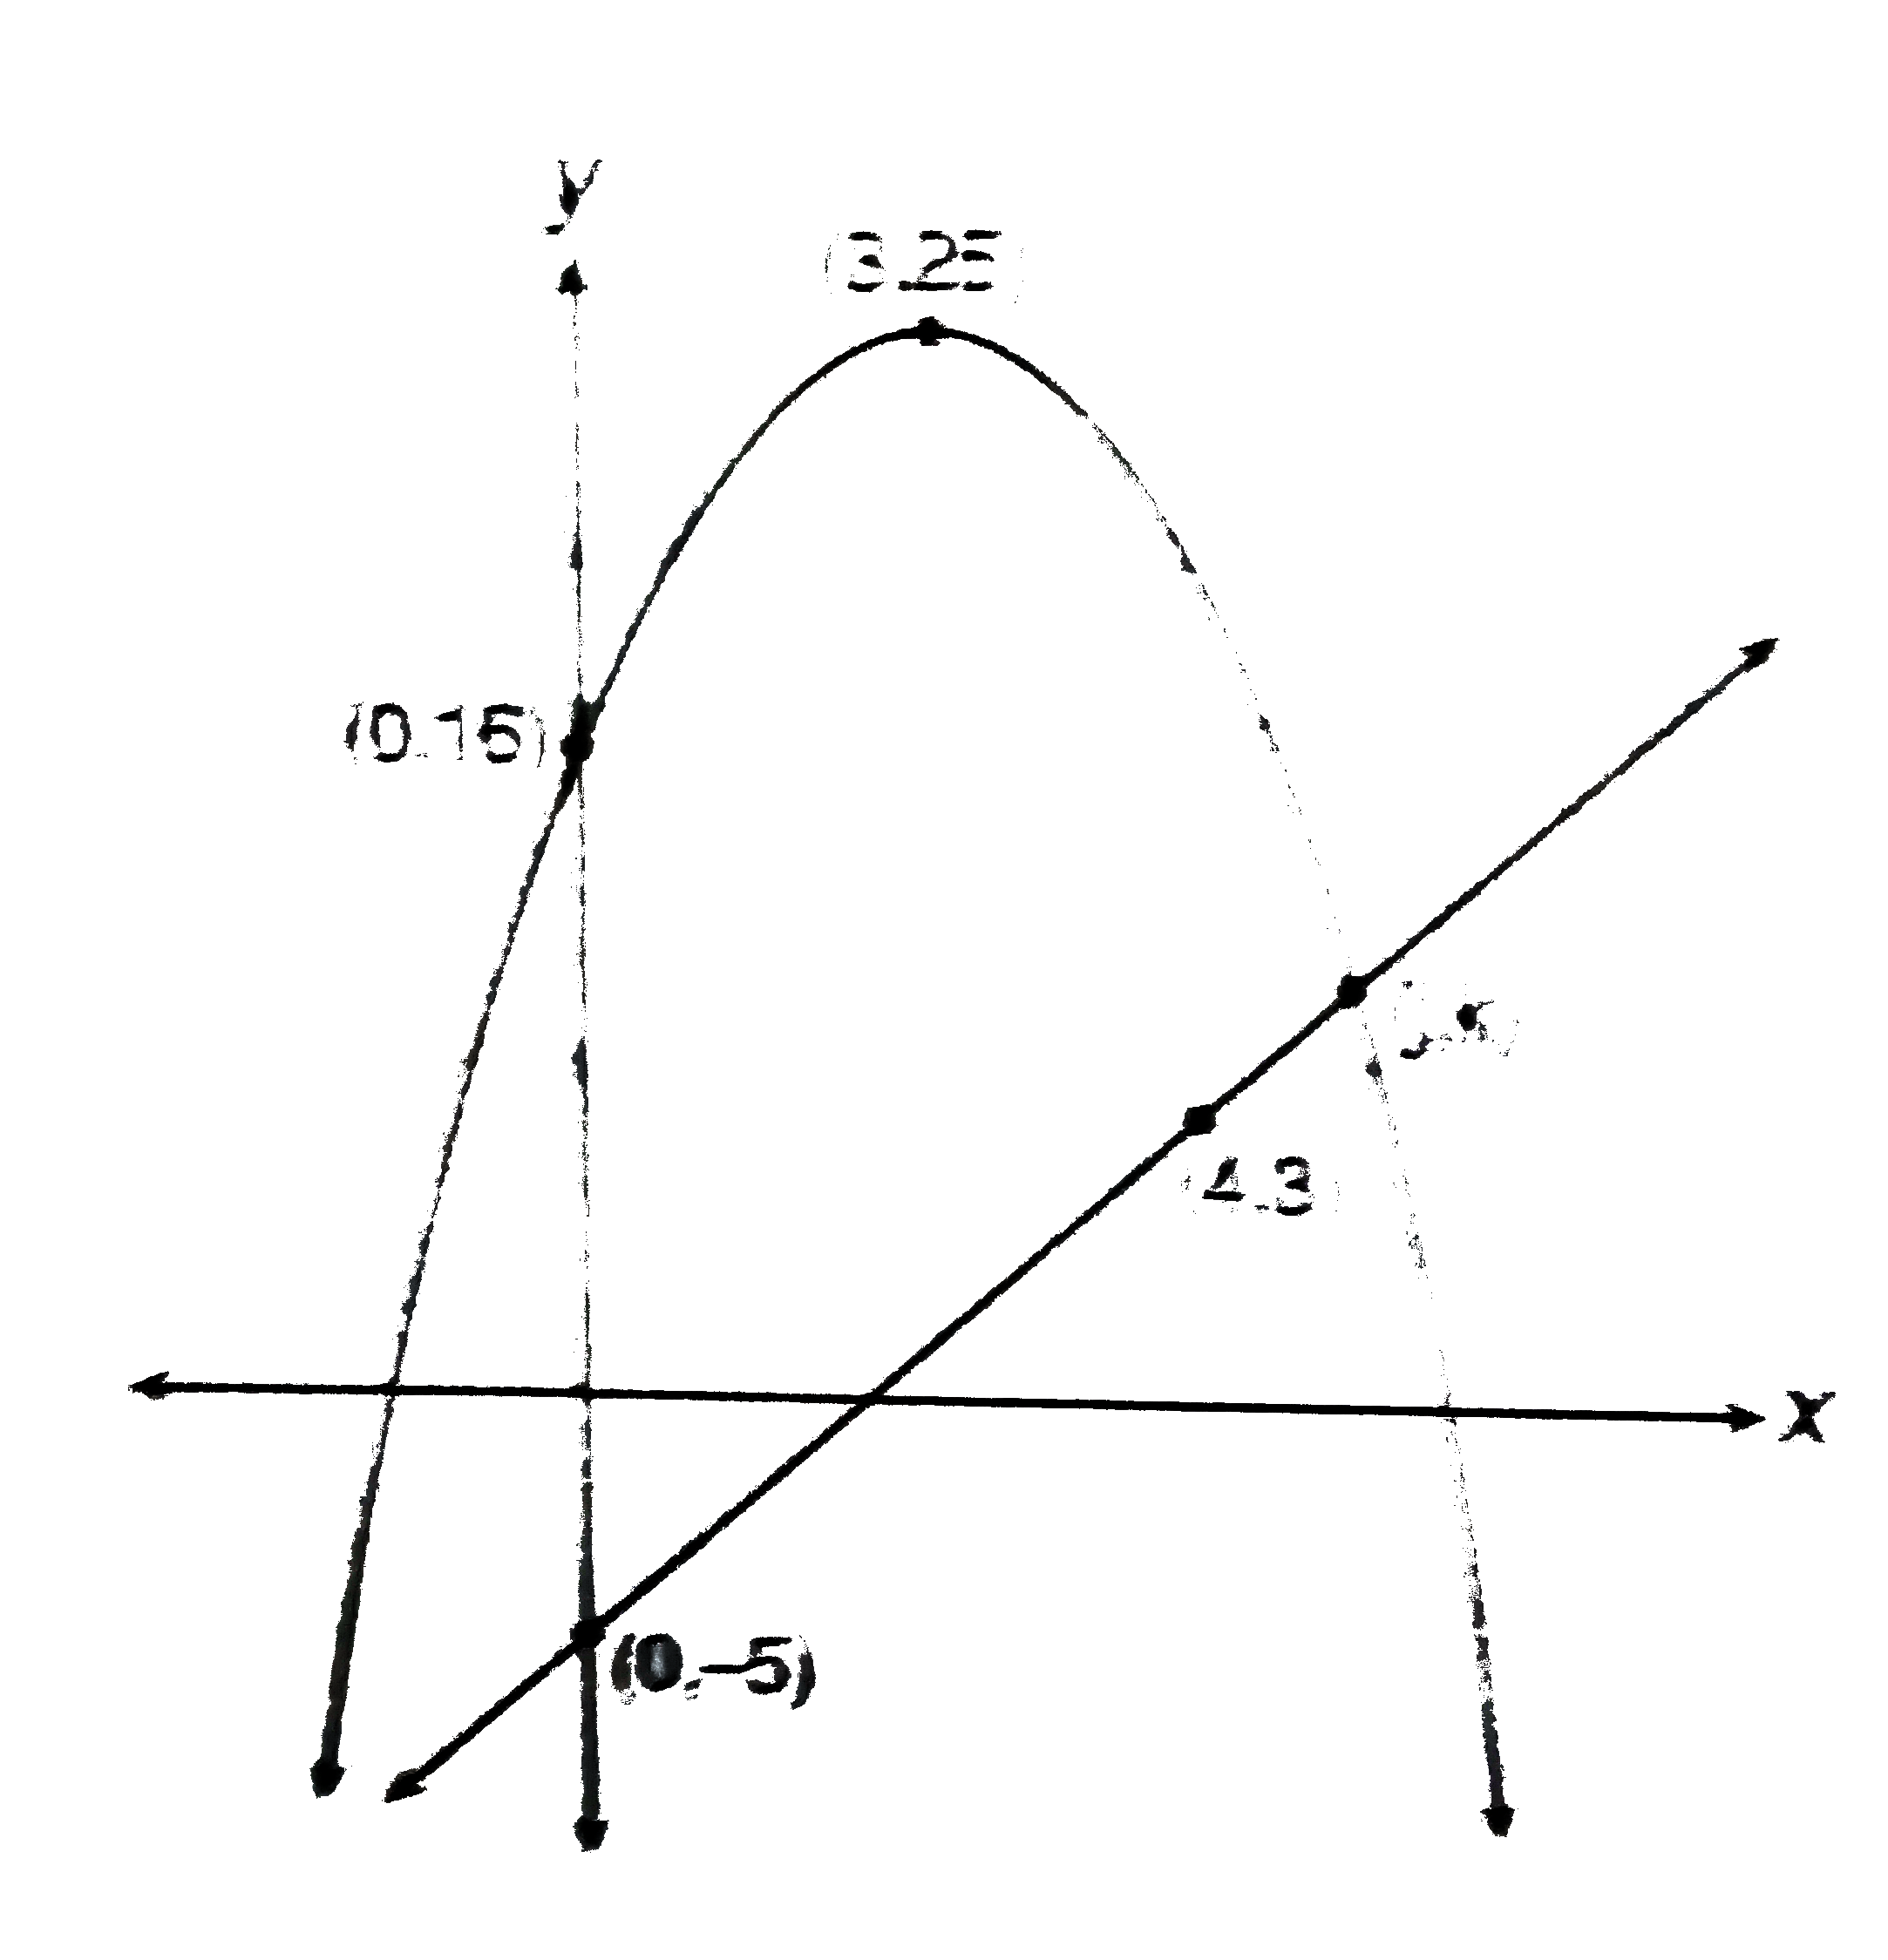
a quandratic function and a linear function are graphed in the xy-plane as shown above. The vertex of the graph of the quadratic function is at (3,25). If the two graphs intersect in the first quadrant at the point (j,k) what is the value of the product jk?
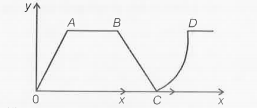
View SolutionIn the following graph, the slope of curve AB, BC and CD are
View Solution
