In the following graph, the slope of curve AB, BC and CD are 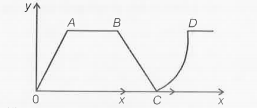
Zero, positive, negative
Zero, zero, variable
Positive, negative, variable
Zero, negative, variable
The correct Answer is:D
Step by step video & image solution for In the following graph, the slope of curve AB, BC and CD are by Physics experts to help you in doubts & scoring excellent marks in Class 12 exams.
Updated on:21/07/2023Topper's Solved these Questions
Similar Questions
Let A, B, C, D be points on a vertical line such that AB = BC = CD. If a body is released from position A, the times of descent through AB, BC and CD are in the ratio.
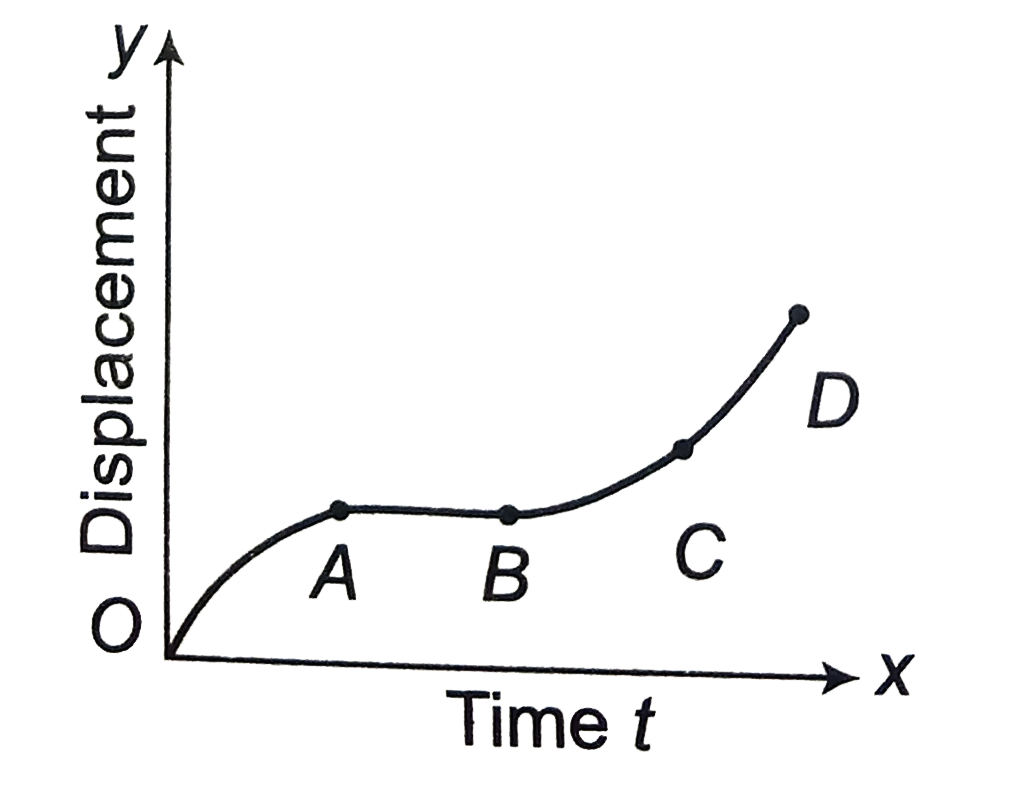
View SolutionThe graph between the displacement x and time t for a particle moving in a straight line is shown in the figure. During the interval OA,AB,BC and CD the acceleration of the particle is
OA,AB,BC,CD
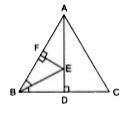
View SolutionIn the following figure, AB = AC and AD is perpendicular to BC. BE bisects angle B and EF is perpendicular to AB. Prove that :
(i) BD = CD
(ii) ED = EF
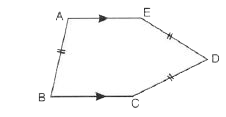
View SolutionIn the following figure, AE and BC are equal and parallel and the three sides AB, CD and DE are equal to one another. If angle A is 102∘. Find angles AEC and BCD
View SolutionWhich of the following graphs has a positive , decreasing slope ?
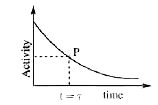
View SolutionThe activity of a certain radioactive sample is plotted against time in graph. If the initial slope of the curve is m, then find the slope of the curve at point P ?
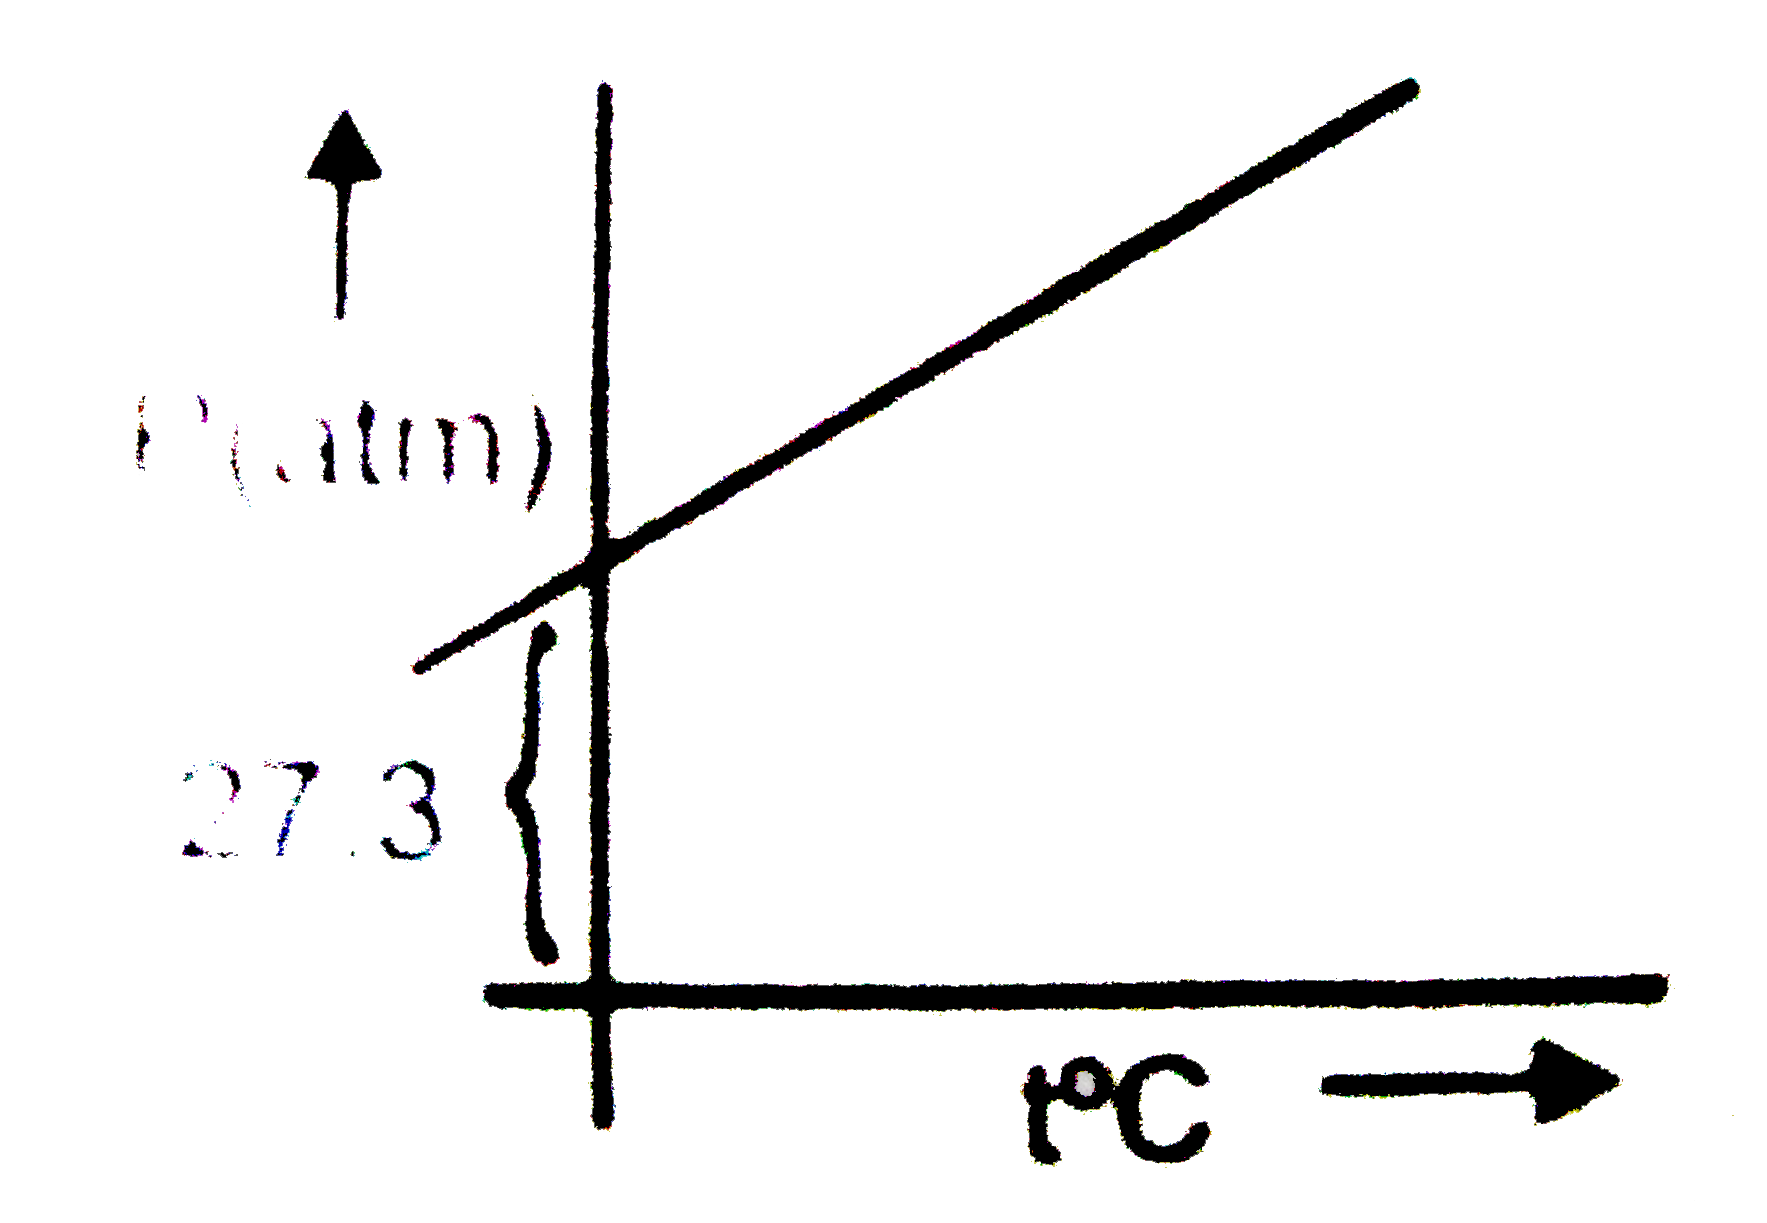
View SolutionA graph is plotted between p (atm) vs t∘C for 10 mol of an ideal gas as follows:
Then slope of curve and volume of container (L) respectively, are:
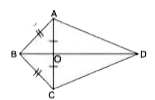
View SolutionIn the following figure, OA = OC and AB = BC. Prove that :
(i) ∠AOB=90∘
(ii) ΔAOD≅ΔCOD
(iii) AD = CD
View SolutionIn the following figure, OA=OC and AB=BC.
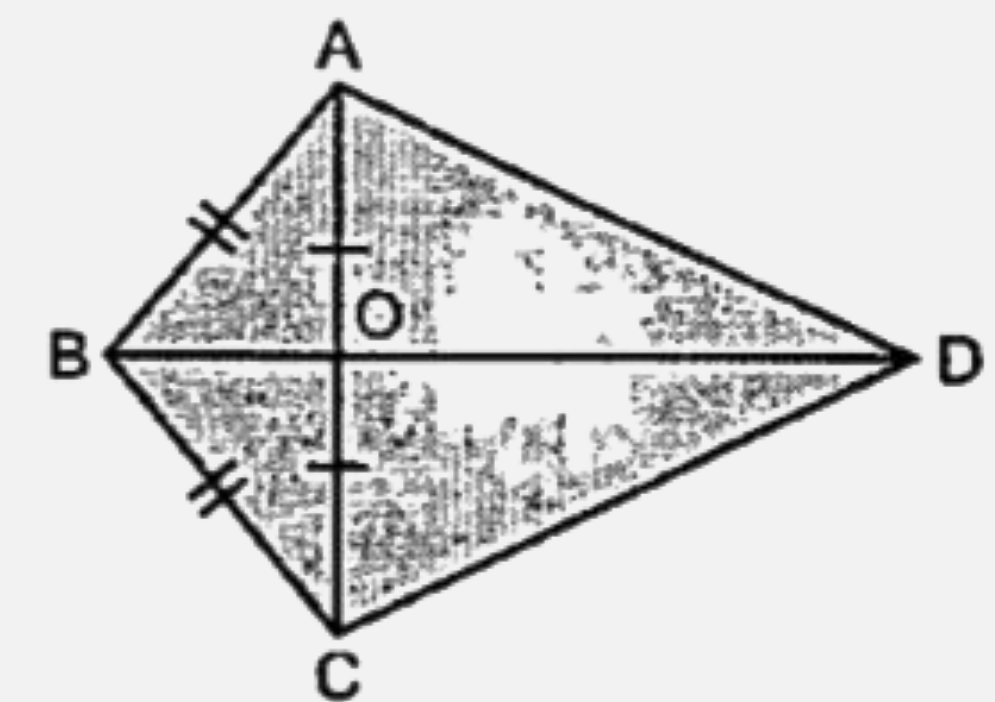
Prove that :
AD=CD
View SolutionConsider the following population and year graph: find the slope of the line AB and using it find what will be the population in the year 2010.
View Solution
