Which of the following graph ploltted between P and V is
INCORRECT ?
None of these
The correct Answer is:B
To determine which graph plotted between pressure (P) and volume (V) is incorrect, we need to analyze the graphs based on the gas laws.
1. Understanding Boyle's Law:
- Boyle's Law states that for a given mass of gas at constant temperature, the pressure (P) is inversely proportional to the volume (V). This can be mathematically expressed as:
PV=k(k is a constant)
- Therefore, if we plot P against V, the graph should be a hyperbola that approaches both axes but never touches them.
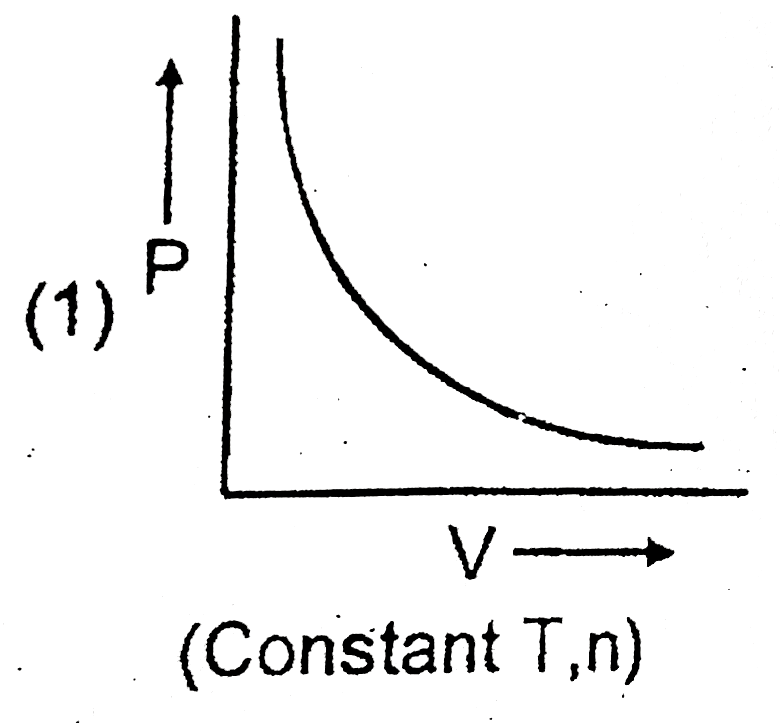
2. Analyzing the First Graph:
- The first graph shows a hyperbolic relationship between P and V.
- Since it follows Boyle's Law (P inversely proportional to V at constant temperature), this graph is correct.
3. Understanding Charles's Law:
- Charles's Law states that at constant pressure, the volume (V) of a gas is directly proportional to its temperature (T). This can be expressed as:
VT=k(k is a constant)
- If we plot V against T at constant pressure, the graph should be a straight line.
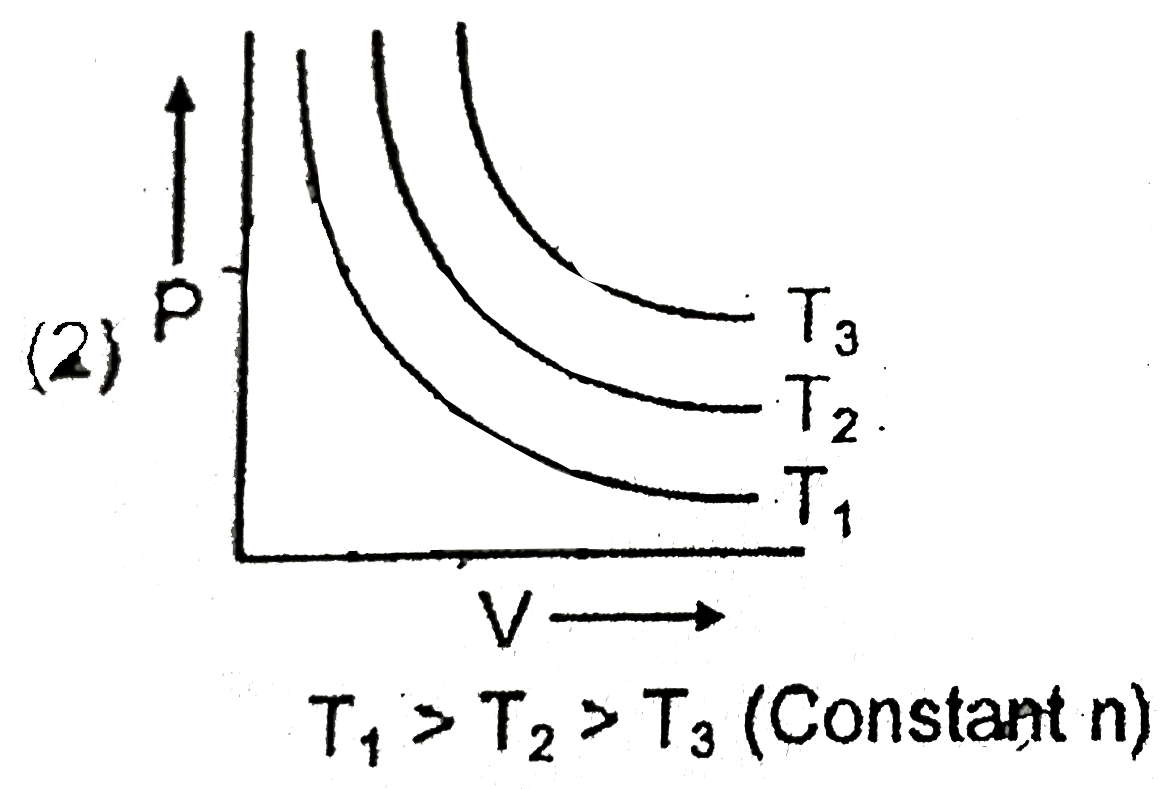
4. Analyzing the Second Graph:
- The second graph depicts a scenario where pressure is held constant while volume changes with temperature.
- If the order of temperatures is T1, T2, T3, and the volume is increasing, this suggests that the temperature is also increasing. However, if the graph suggests otherwise (like T3 being the lowest temperature), this indicates a contradiction with Charles's Law.
- Therefore, this graph is incorrect.
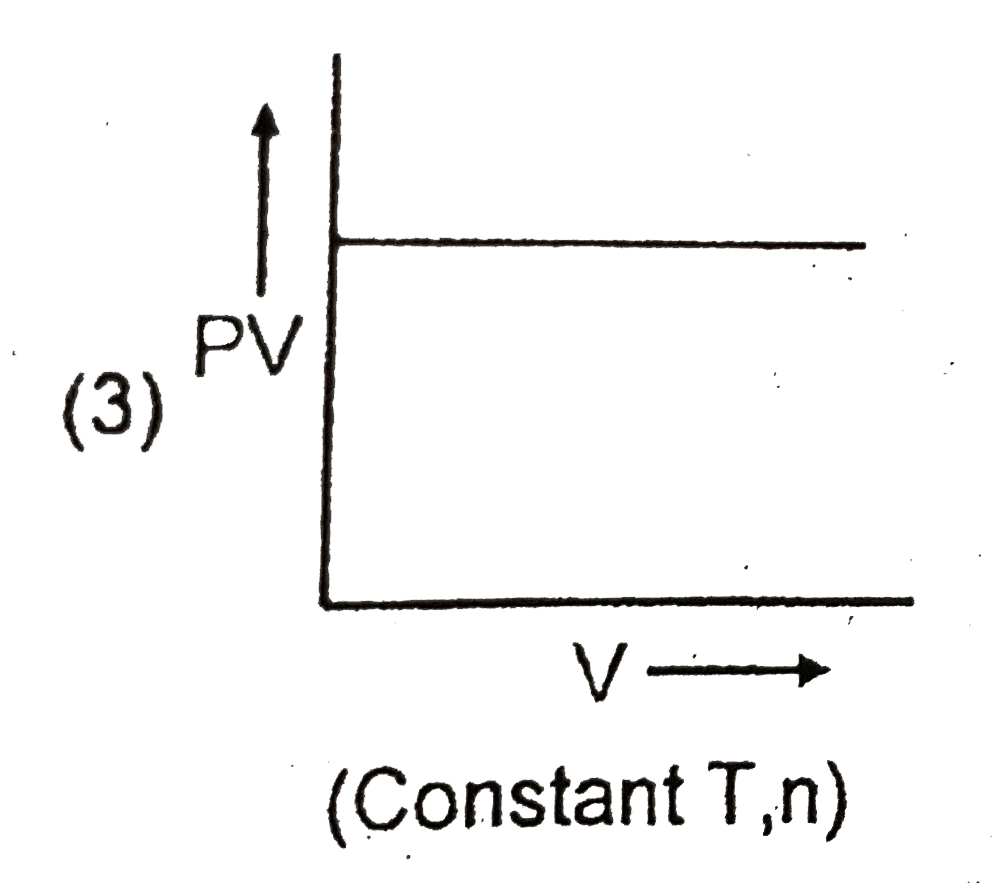
5. Analyzing the Third Graph:
- The third graph again shows a hyperbolic relationship similar to the first graph.
- Since it also follows Boyle's Law, this graph is correct.
Conclusion:
The incorrect graph plotted between P and V is the second graph.
- Boyle's Law states that for a given mass of gas at constant temperature, the pressure (P) is inversely proportional to the volume (V). This can be mathematically expressed as:
PV=k(k is a constant)
- Therefore, if we plot P against V, the graph should be a hyperbola that approaches both axes but never touches them.
- The first graph shows a hyperbolic relationship between P and V.
- Since it follows Boyle's Law (P inversely proportional to V at constant temperature), this graph is correct.
- Charles's Law states that at constant pressure, the volume (V) of a gas is directly proportional to its temperature (T). This can be expressed as:
VT=k(k is a constant)
- If we plot V against T at constant pressure, the graph should be a straight line.
- The second graph depicts a scenario where pressure is held constant while volume changes with temperature.
- If the order of temperatures is T1, T2, T3, and the volume is increasing, this suggests that the temperature is also increasing. However, if the graph suggests otherwise (like T3 being the lowest temperature), this indicates a contradiction with Charles's Law.
- Therefore, this graph is incorrect.
- The third graph again shows a hyperbolic relationship similar to the first graph.
- Since it also follows Boyle's Law, this graph is correct.
The incorrect graph plotted between P and V is the second graph.
Similar Questions
Knowledge Check
- Question 1 - Select One
Which of the following is incorrect relation between given pairs ?
A B
B C
C D
D
- Question 2 - Select One
Which of the following I-V graph represents ohmic conductors?
A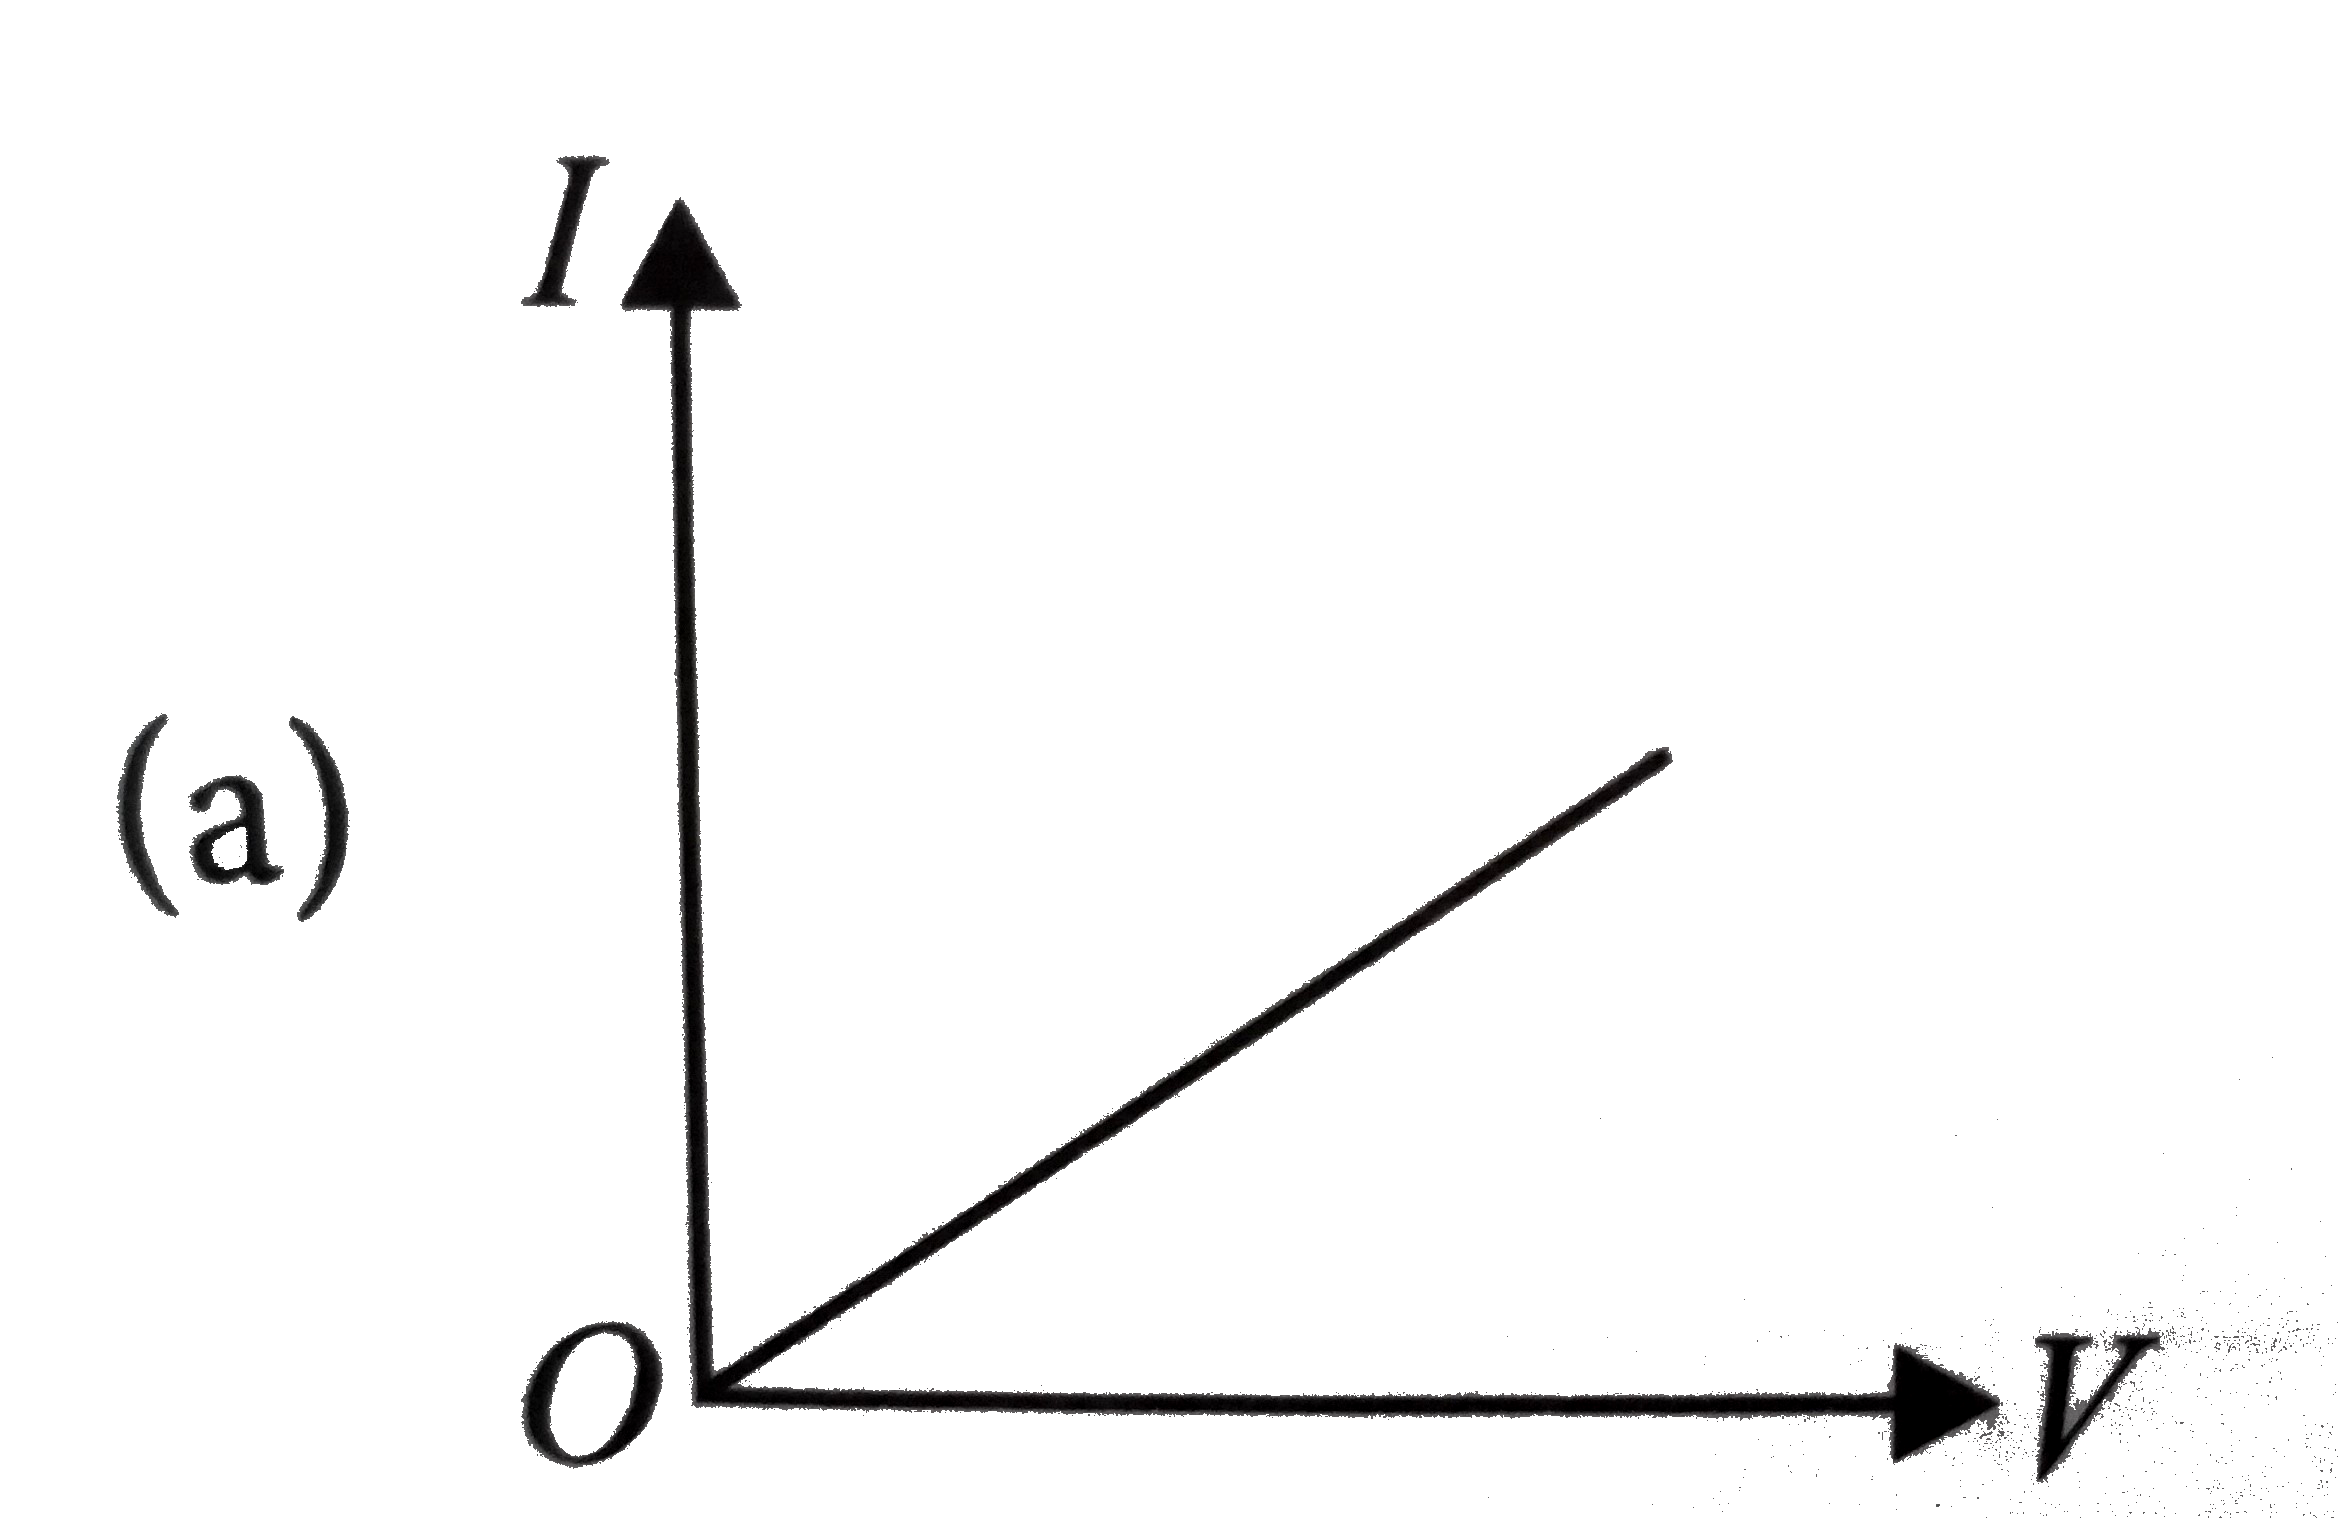 B
B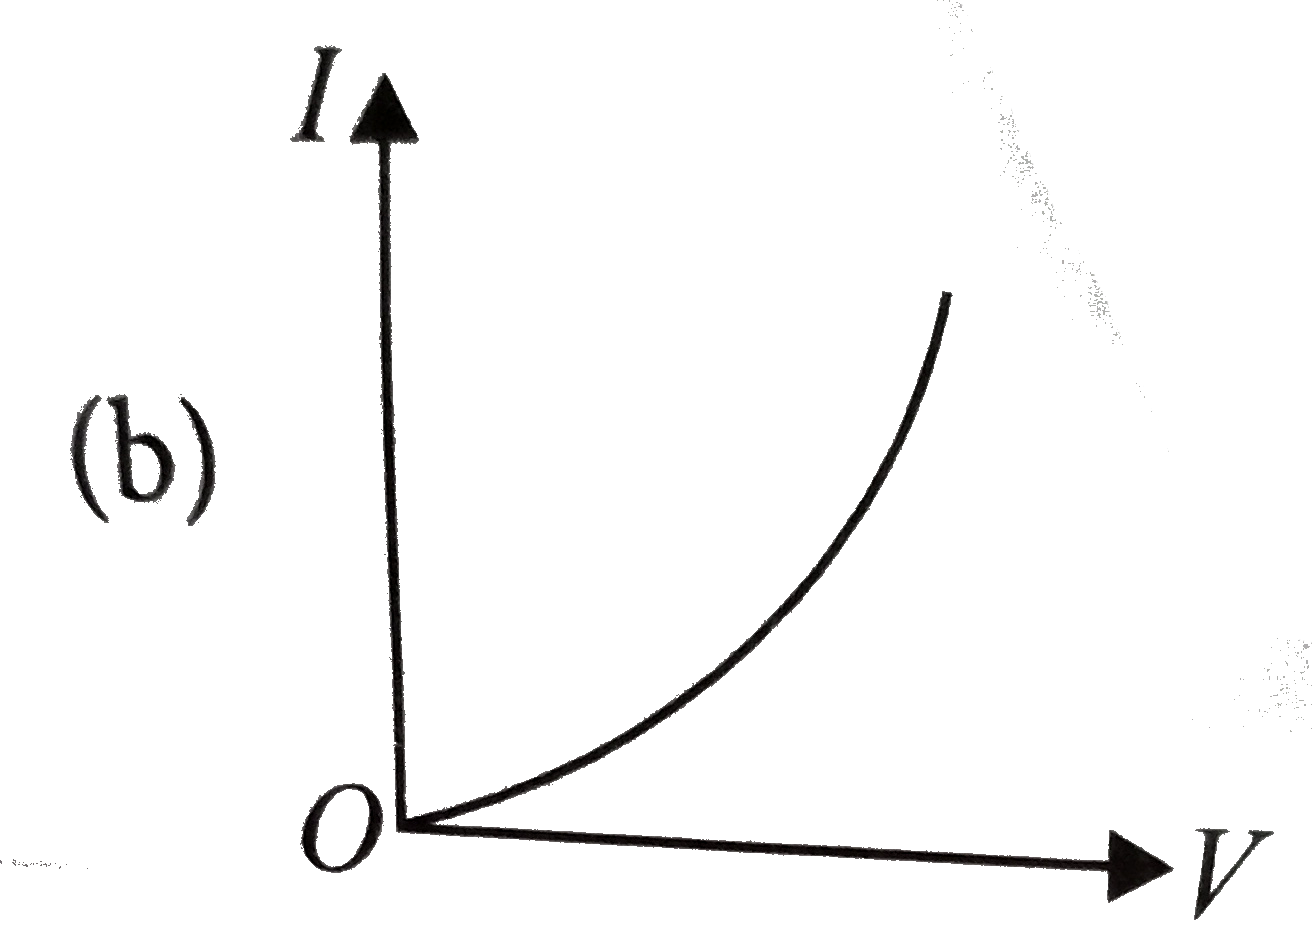 C
C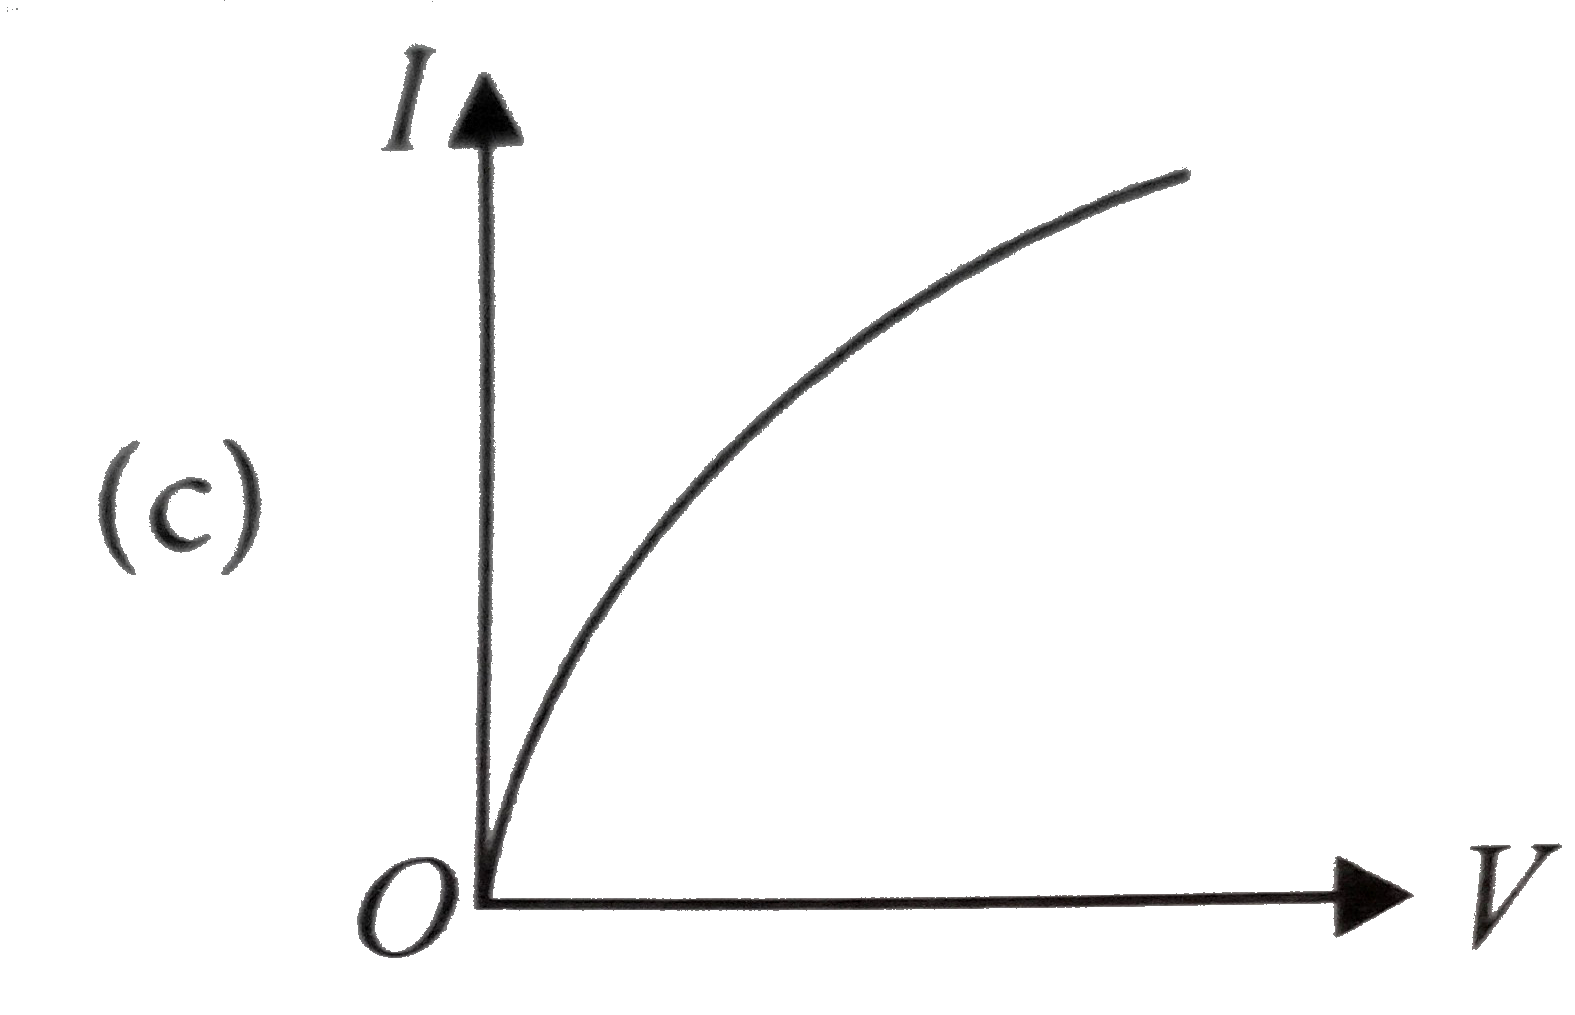 D
D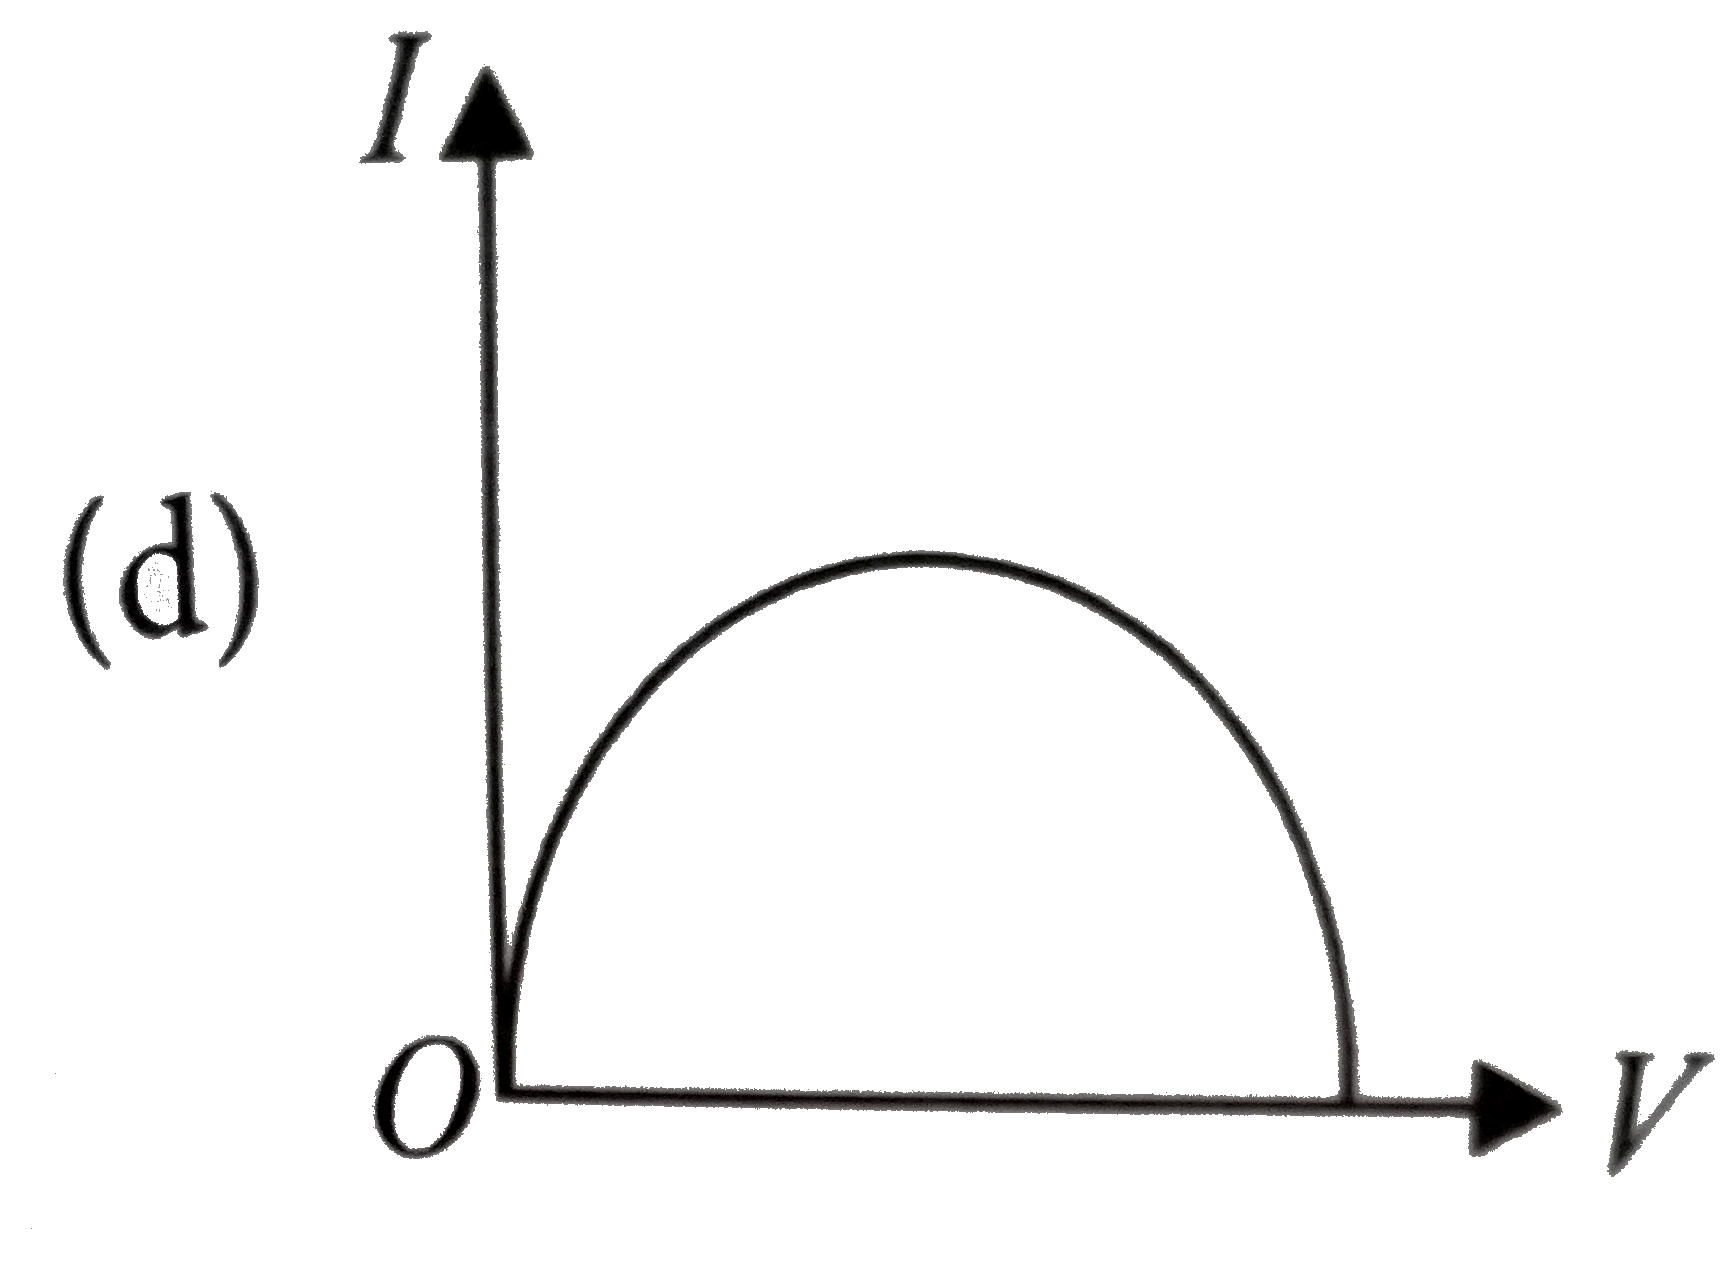
- Question 3 - Select One
Which of the following is incorrect about the given graph ?
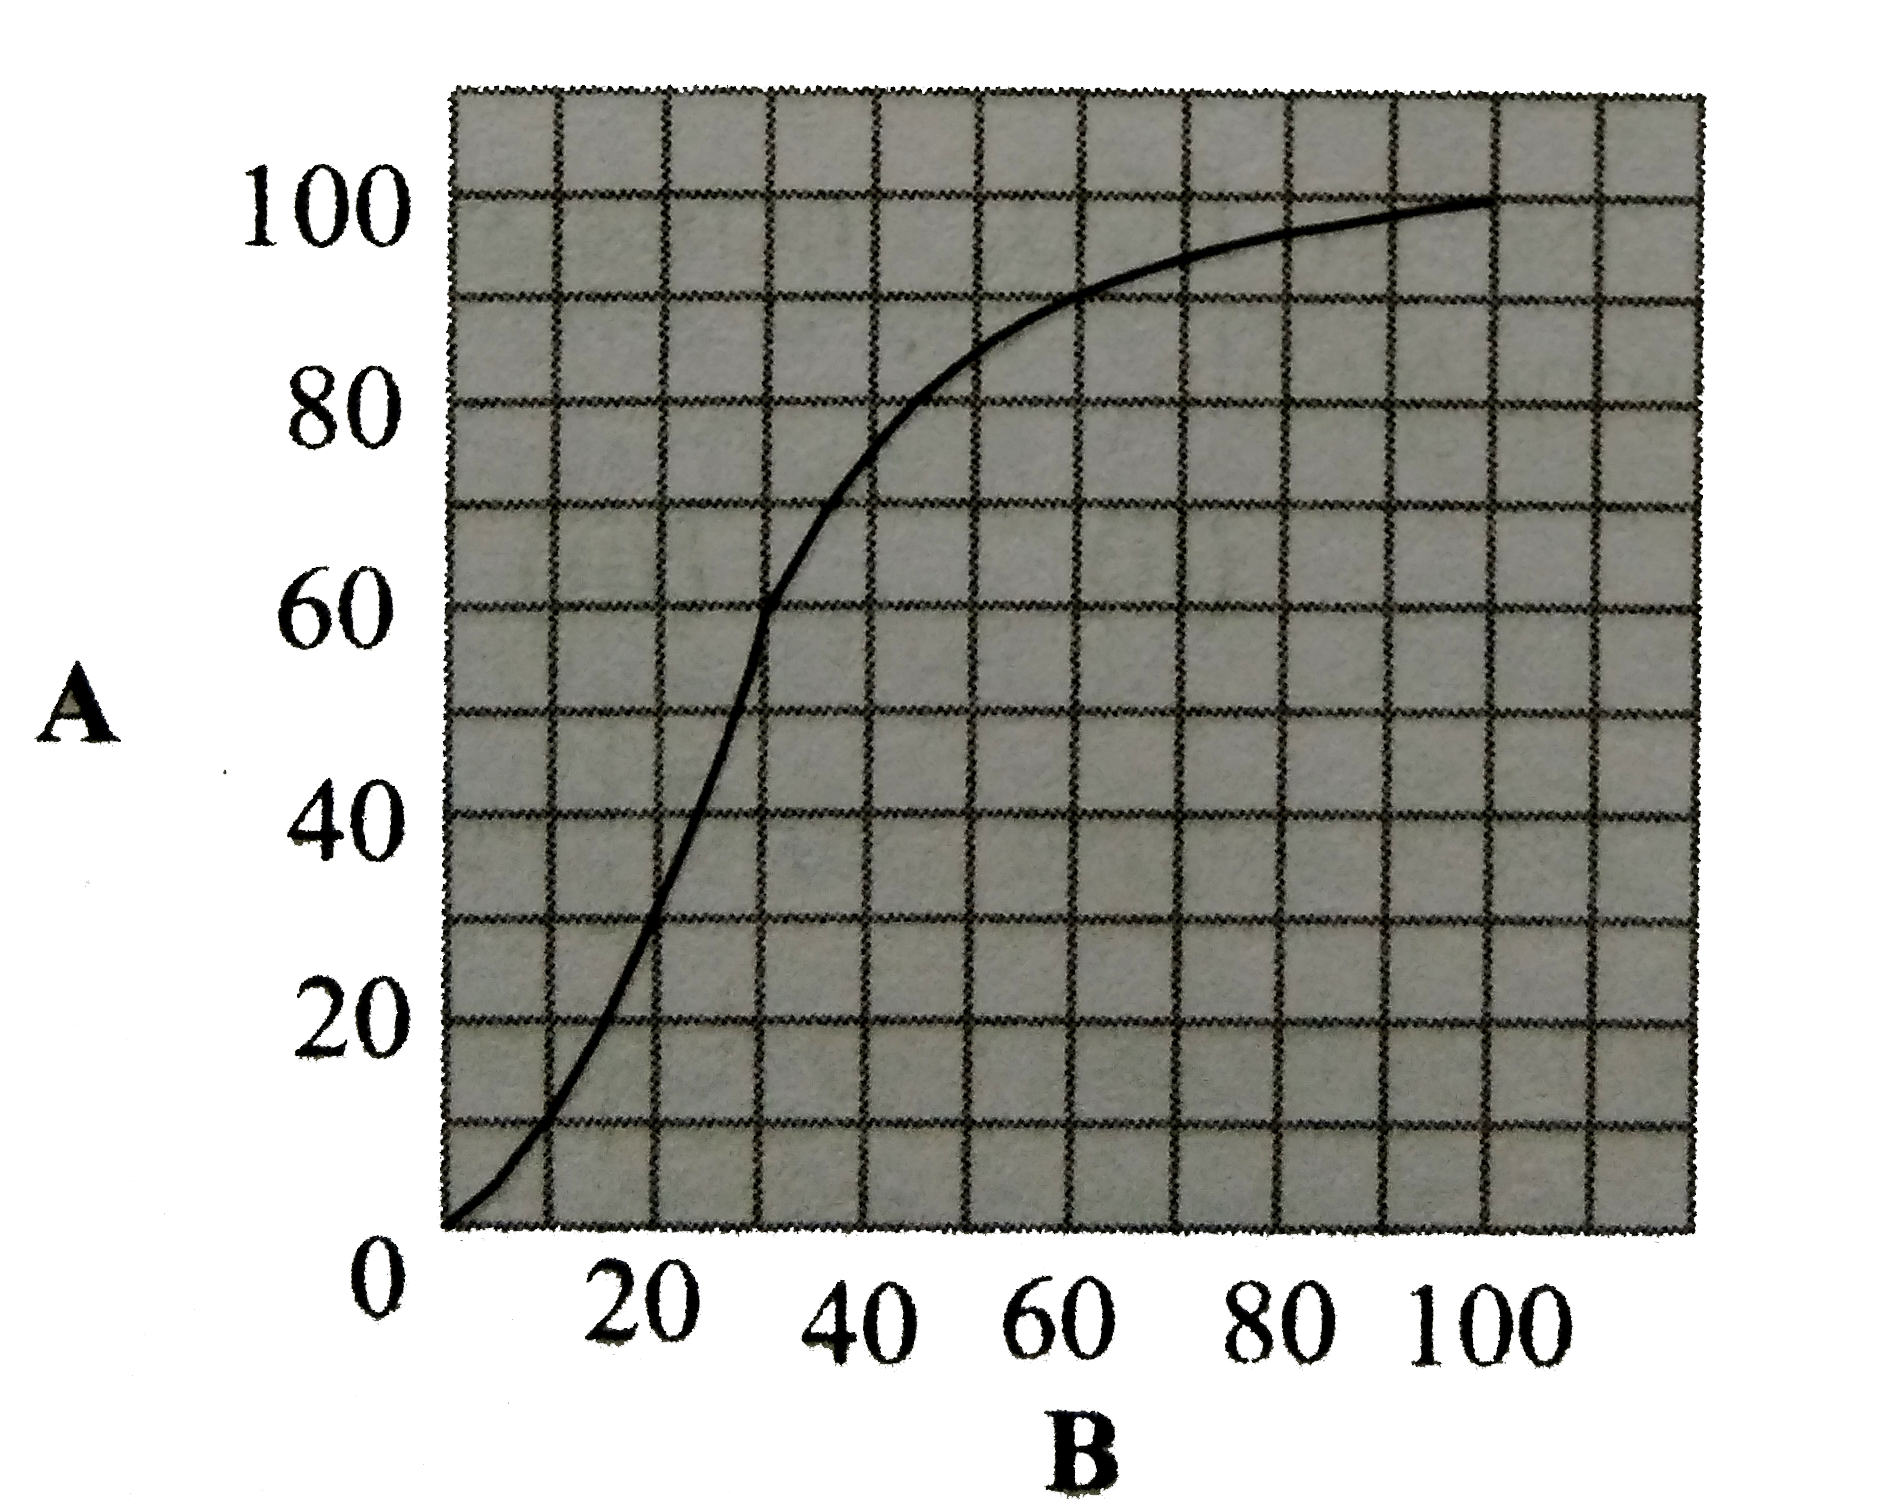 AThe curve is called oxygen dissociation curve.BThe part 'A' represents percentage saturation of haemologbin with oxygen.CThe part 'B' represents partial pressure of carbon dioxide.DThis curve is highly useful in studying the effect of factors like PCO2,H+ concentration, etc. on binding of CO2 with haemoglobin.
Which of the following.v-t graph can be obtained in practice?
 View Solution
Which of the following graph represents relation between the image position (v) and object position (u) from the concave lens.
View SolutionWhich of the following is incorrect match between organism and its larval form?
View SolutionWhich of the following is an incorrect match between virus, genome and its mode of transmission?
View SolutionWhich of the following is incorrect match between amino acid and its nature?
View Solution


