Using Einstein's photoelectric equation show how the cut -off voltage and threshold frequency for a given photosensitive material can be determined with the help of a suitable plot/graph.
To determine the cut-off voltage and the threshold frequency for a given photosensitive material using Einstein's photoelectric equation, we can follow these steps:
Step 1: Understand Einstein's Photoelectric Equation
Einstein's photoelectric equation is given by:
K.E.=hν−ϕ
Where:
- K.E. is the maximum kinetic energy of the emitted electrons.
- h is Planck's constant.
- ν is the frequency of the incident light.
- ϕ is the work function of the material, which is the minimum energy required to eject an electron from the surface.
Step 2: Relate Kinetic Energy to Cut-off Voltage
The maximum kinetic energy of the emitted electrons can also be expressed in terms of the stopping potential (Vs):
K.E.=eVs
Where e is the charge of the electron.
Step 3: Combine the Equations
By equating the two expressions for kinetic energy, we have:
eVs=hν−ϕ
Rearranging gives:
Vs=heν−ϕe
Step 4: Identify the Threshold Frequency
The threshold frequency (ν0) is defined as the frequency at which the stopping potential becomes zero (Vs=0). Setting Vs=0 in the equation gives:
0=heν0−ϕe
This leads to:
ν0=ϕh
Step 5: Plotting the Graph
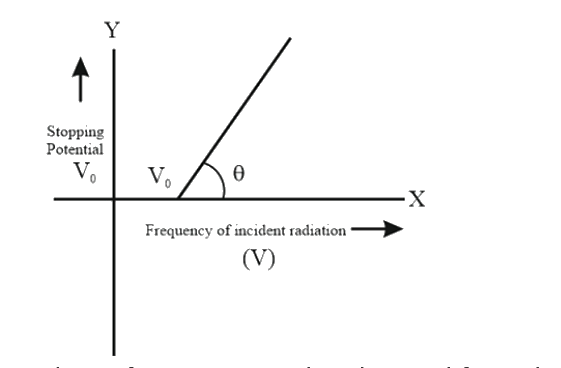
To visualize the relationship between stopping potential (Vs) and frequency (ν), we can plot Vs on the y-axis and ν on the x-axis. The equation Vs=heν−ϕe represents a straight line with:
- Slope = he
- Y-intercept = −ϕe
Step 6: Determine Cut-off Voltage and Threshold Frequency from the Graph
1. Cut-off Voltage: The cut-off voltage (Vs) can be determined for any frequency ν by locating the corresponding point on the graph.
2. Threshold Frequency: The threshold frequency (ν0) can be found by identifying the point where the line intersects the frequency axis (where Vs=0).
Summary
- The slope of the line gives the ratio of Planck's constant to the electron charge, he.
- The x-intercept of the line gives the threshold frequency ν0.
- The stopping potential can be read off the y-axis for any given frequency.
Einstein's photoelectric equation is given by:
- K.E. is the maximum kinetic energy of the emitted electrons.
- h is Planck's constant.
- ν is the frequency of the incident light.
- ϕ is the work function of the material, which is the minimum energy required to eject an electron from the surface.
The maximum kinetic energy of the emitted electrons can also be expressed in terms of the stopping potential (Vs):
By equating the two expressions for kinetic energy, we have:
The threshold frequency (ν0) is defined as the frequency at which the stopping potential becomes zero (Vs=0). Setting Vs=0 in the equation gives:
To visualize the relationship between stopping potential (Vs) and frequency (ν), we can plot Vs on the y-axis and ν on the x-axis. The equation Vs=heν−ϕe represents a straight line with:
- Slope = he
- Y-intercept = −ϕe
1. Cut-off Voltage: The cut-off voltage (Vs) can be determined for any frequency ν by locating the corresponding point on the graph.
2. Threshold Frequency: The threshold frequency (ν0) can be found by identifying the point where the line intersects the frequency axis (where Vs=0).
- The slope of the line gives the ratio of Planck's constant to the electron charge, he.
- The x-intercept of the line gives the threshold frequency ν0.
- The stopping potential can be read off the y-axis for any given frequency.
Topper's Solved these Questions
- ATOMIC PHYSICSBOOK - RESONANCE ENGLISHCHAPTER - ATOMIC PHYSICSEXERCISE - Advanved level problems
17 Videos
- ATOMIC PHYSICSBOOK - RESONANCE ENGLISHCHAPTER - ATOMIC PHYSICSEXERCISE - Exercise-2 Part-III : Comprehension
12 Videos
- ALTERNATING CURRENTBOOK - RESONANCE ENGLISHCHAPTER - ALTERNATING CURRENTEXERCISE - HIGH LEVEL PROBLEMS
11 Videos
- CAPACITANCEBOOK - RESONANCE ENGLISHCHAPTER - CAPACITANCEEXERCISE - High Level Problems
16 Videos
Similar Questions
For a photoelectric cell the graph showing the variation of cut of voltage (V0) with frequency (v) of incident light is best represented by

View SolutionHow does one explain the emission of electron from a photosensitive surface with te help of Einstein's photoelectric equation ?
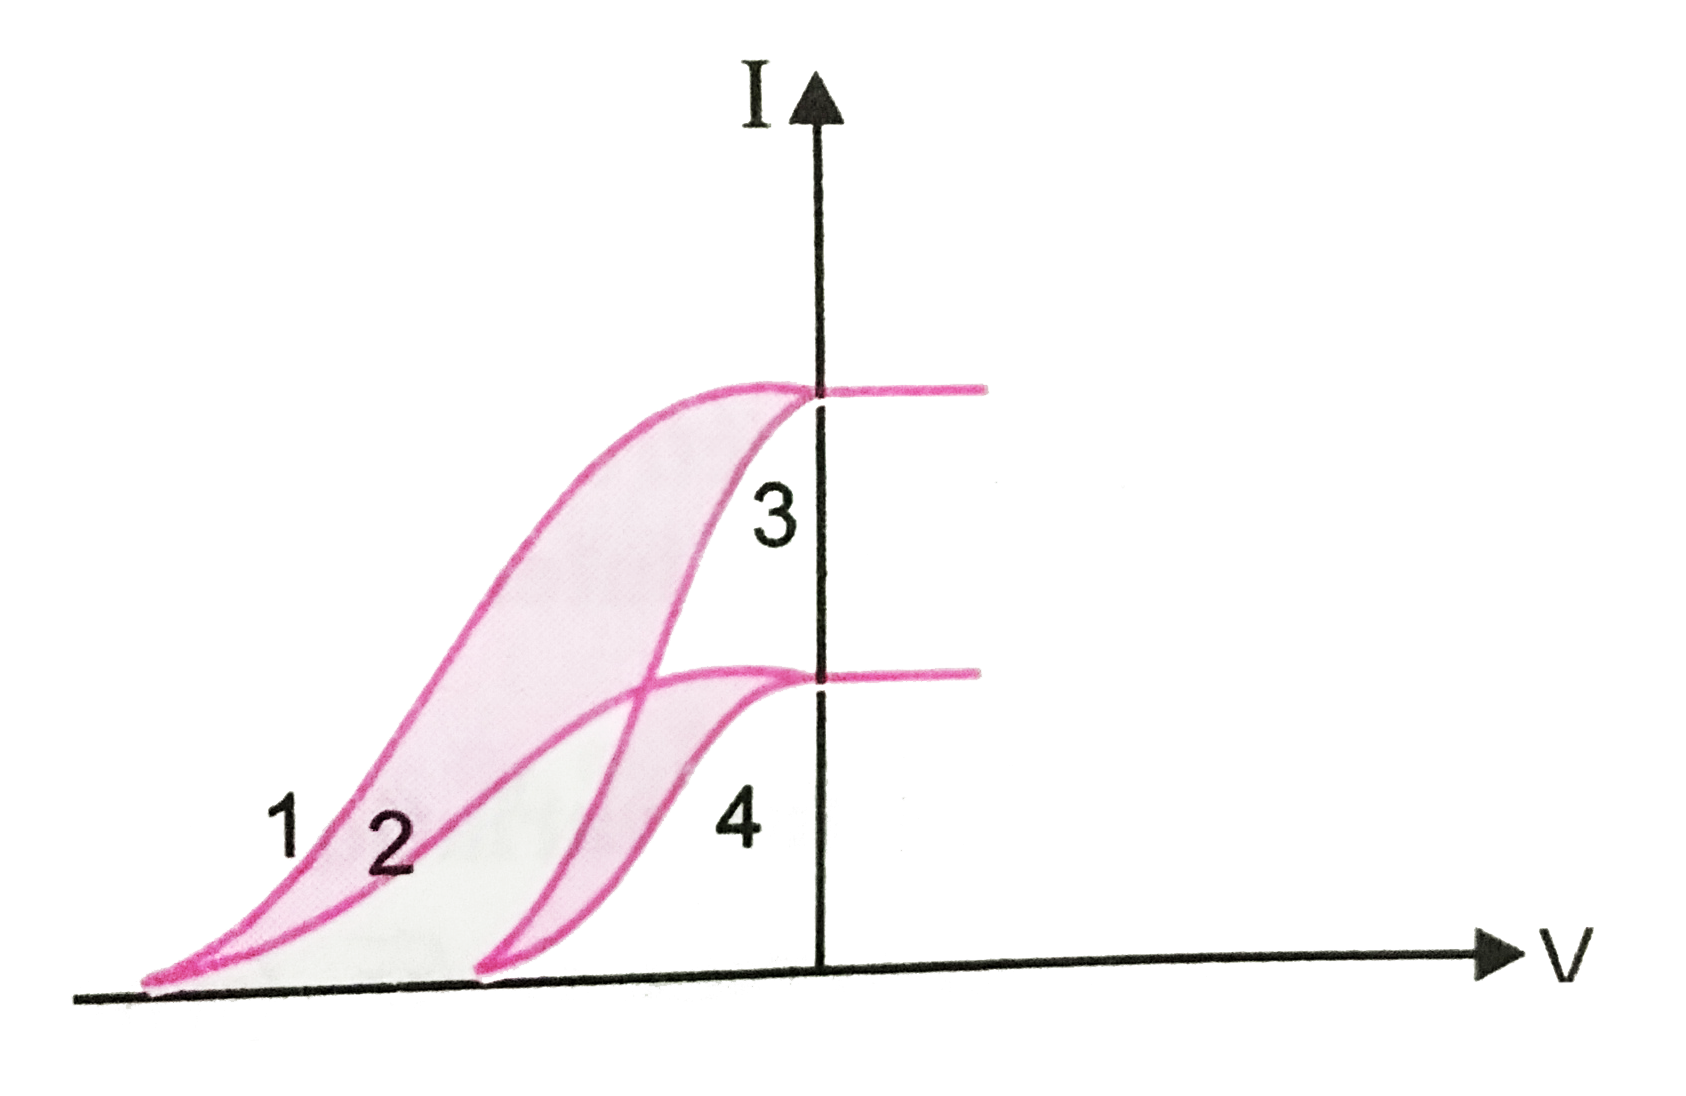
View SolutionThe graph of Fig. shows the variation of photoelectric current (I) versus applied voltage (V) for the two different photosensitive materials for two different intensities of the incident radiation. Identify the pairs of curves that correspond to different materials but same intensity of incident radiation.

View SolutionUsing photon picture of light, show how Einstein's photoelectic equation can be established.
View SolutionThe graph between frequency of incident radiations and stopping potential for a given photosensitive material as follows.

What information can be obtained from the value of the intercept on the potential axis ?
View SolutionIn an experiment on photoelectric effect, the slope of the cut off voltage versus frequency of incident light is found to be 4.12×10⁻¹⁵Vs. Given e=1.6×10⁻¹⁹C, estimate the value of Planck's constant.
View SolutionIn the photoelectric effect the electrons are emiited instantaneously from a given metal plate when it is irradiated with radiation of frequency equal to or greater than some minimum ferquency, is called the threshold frequency.According to Planck's idea, light may be considered to be made up discrete particles called photons.Each photon carries energy equal to hv.When this photon collides with the electron of the metal, the electron acquires energy of the emitted electron is given by :
hv=K.Emaximum+PE=12mu2+PE
If the incident rediation is of threshold frequency the electron will be emitted without any kinetic energy
i.e hv0
∴12mu2=hv−hv0
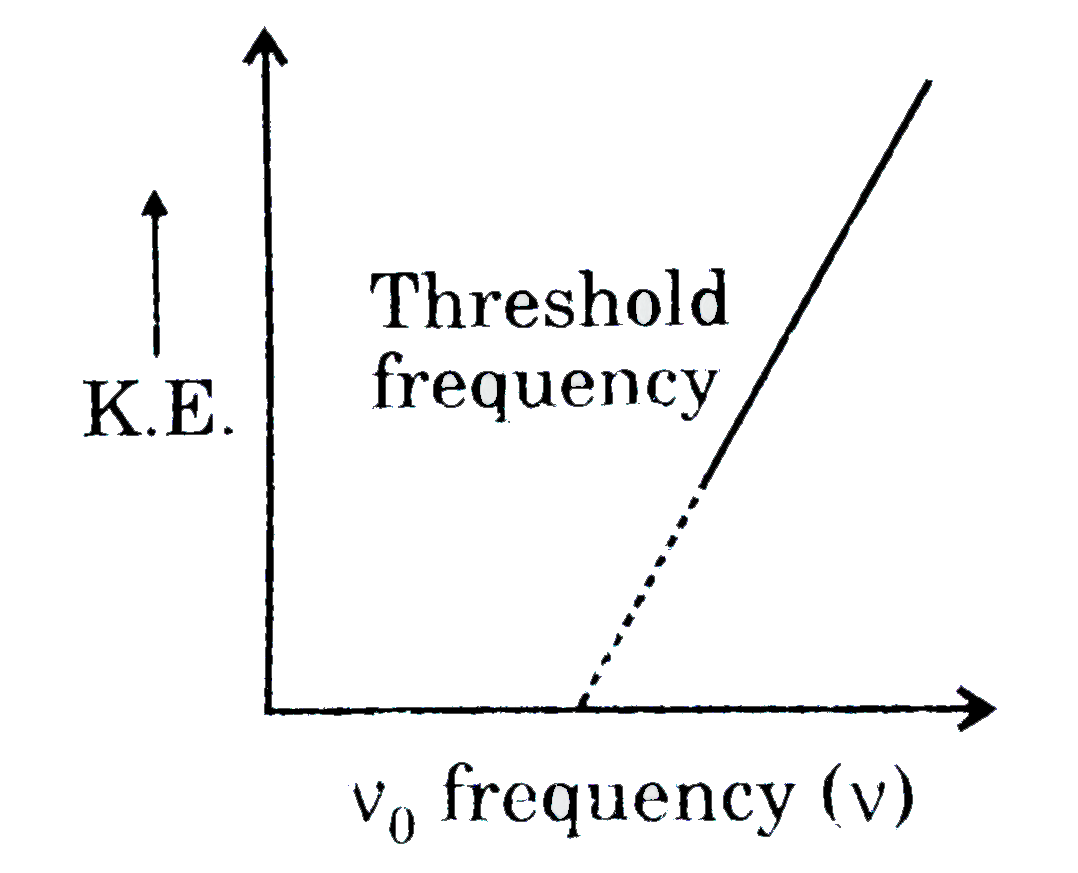
A plot of kinetic energy of the emitted electron versus frequency of the incident radiation yields a straight line given as :

A laser producting monochromatic lights of different wavelenght is uesd to eject electrons from the sheet of gold having threshold frequency 6.15×10¹⁴s−1 Which of the following incident rediation will be suitable for the ejecting of electrons ?
View SolutionSketch the graphs, showing the variation of stopping potential Vs with frequency v of the incident radiations for two photosensitive materials A and B having threshold frequencies v0>v'0 respectively.
(i) which of the two metals A or B has higher work function?
(ii) What information do you get from the slope of the graphs?
(iii) What does the value of the intercept of graph A on the potential axis represent?
View Solution(a) (i) Write Einstein.s photo electric equation.
(ii) if the frequency of the incident radiation is increased from 4×10¹⁵ Hz to 8×10¹⁵ Hz by how much will the stopping potential for a given photosensitive surface go up ?
(b) Laser light of wavelength 630 nmis incident on a pair of slits which are separated by 1.8 mm. If the screen is kept 80 cm away from the two slits. calculate :
(i) fringe separation i.e., fringr width
(ii) distance of 10th bright fringe from the centre of the interference pattern.
View SolutionWhat is the photoelectric effect? With the help of suitable graph show the variation of photocurrent with (i) the intensity of incident radiation. (ii) the voltage applied between cathode and anode. (iii) the frequency of incident radiation.
View Solution
