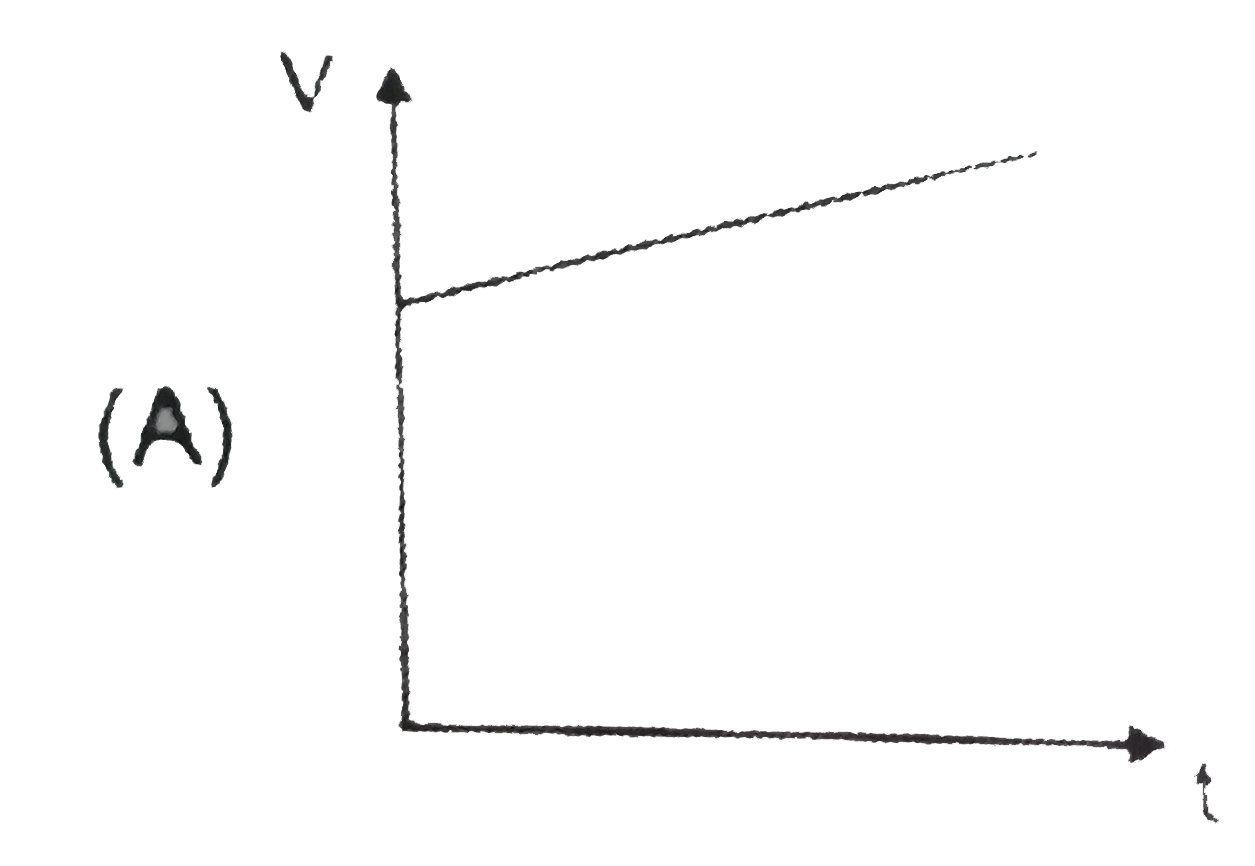
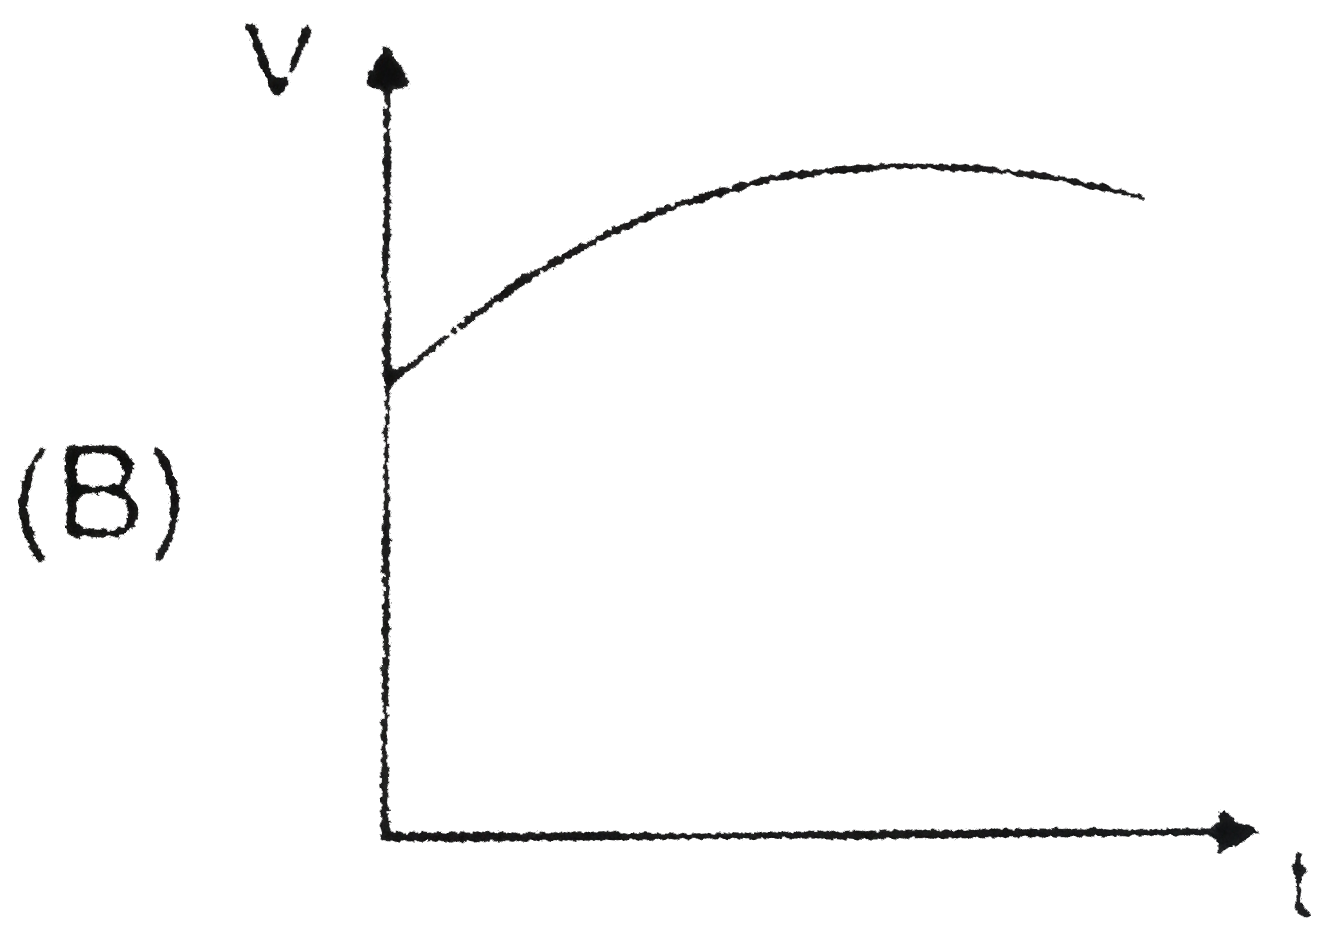
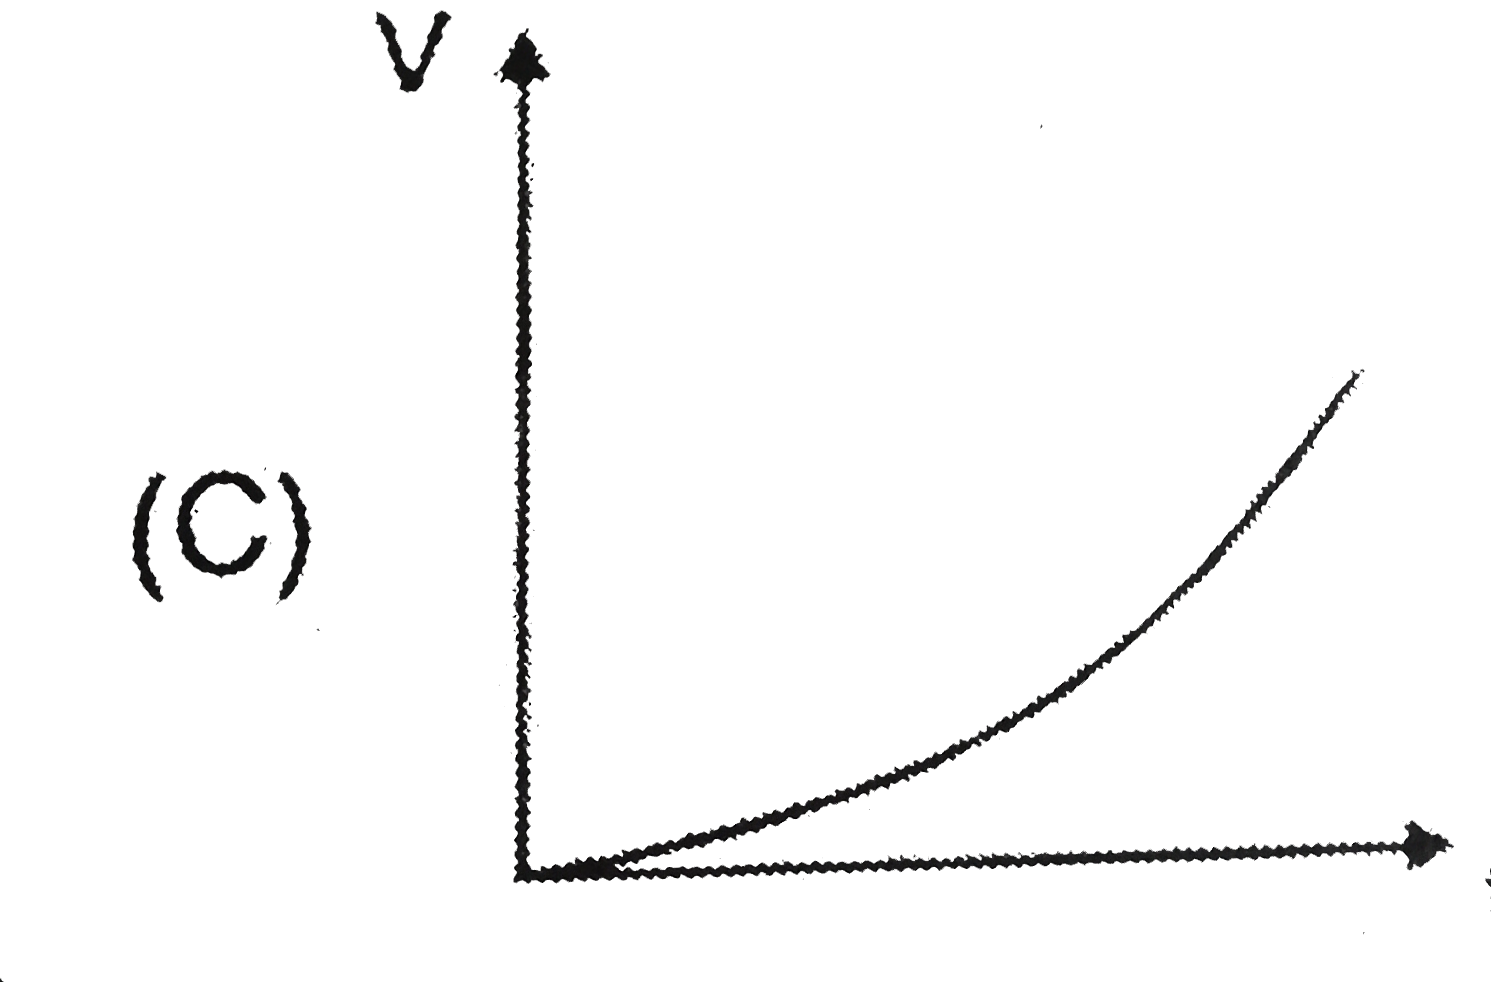
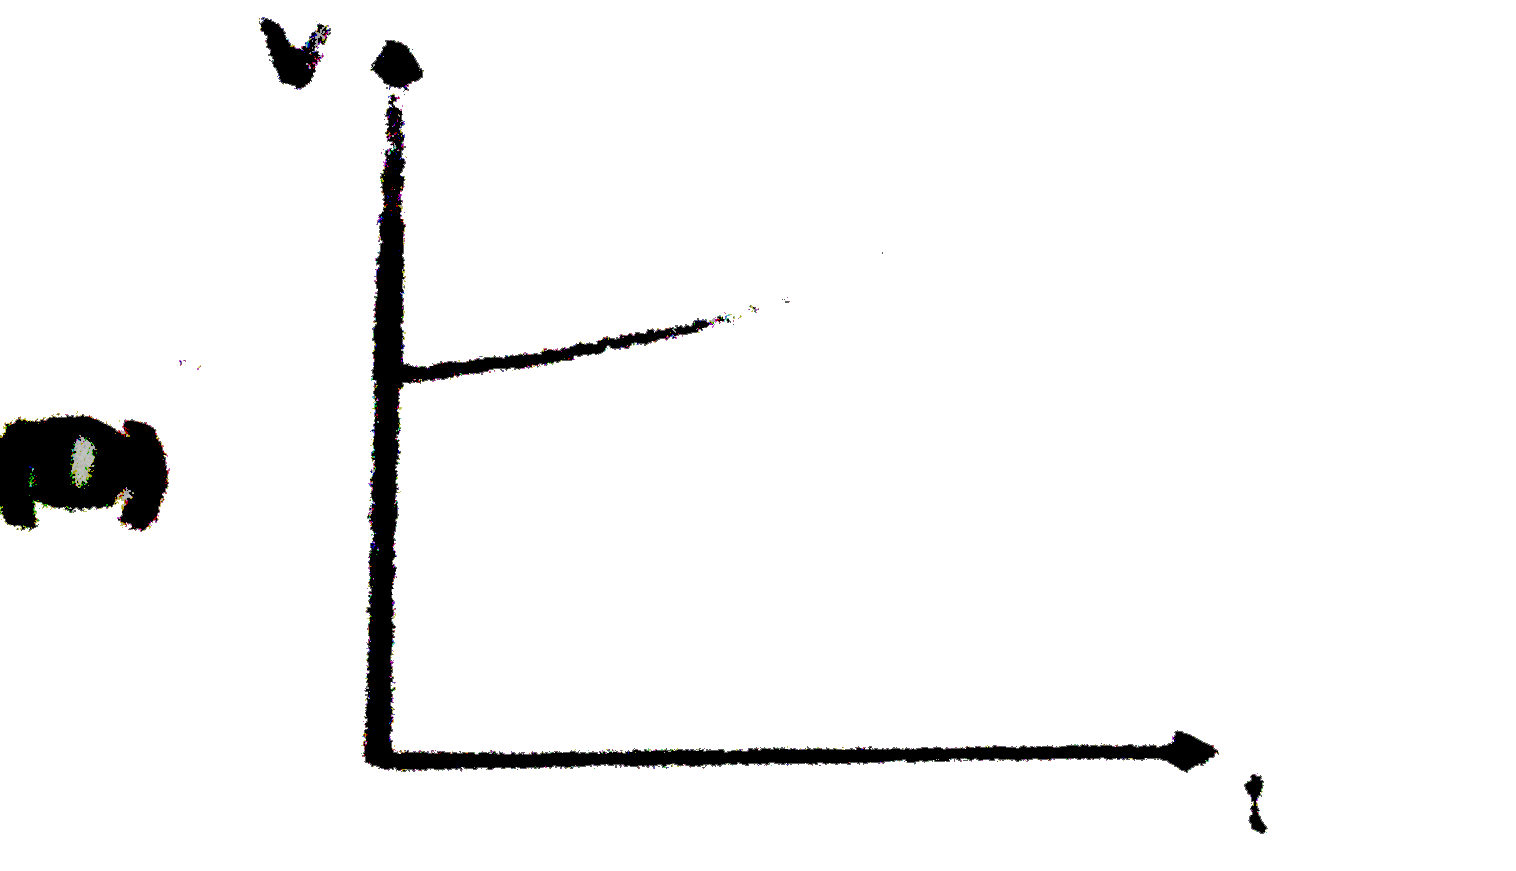
Choose Graph between potential and time for an isolated conductor of finite capacitance C, if its charge varies according to the formula Q=(αt+Q0) coulomb, where Q0 and α are positive constant.
The correct Answer is:A
To solve the problem, we need to analyze the relationship between the charge Q on an isolated conductor and the potential V across it, given the formula for charge as Q=αt+Q0, where Q0 and α are positive constants.
1. Understand the relationship between charge and potential:
The potential V across a capacitor is given by the formula:
V=QC
where C is the capacitance of the conductor.
2. Substitute the expression for charge into the potential formula:
Given Q=αt+Q0, we can substitute this into the potential formula:
V=αt+Q0C
3. Simplify the expression for potential:
We can rewrite the potential as:
V=αCt+Q0C
This is a linear equation in the form V=mt+b, where:
- m=αC (the slope)
- b=Q0C (the y-intercept)
4. Identify the characteristics of the graph:
- The graph of V versus t will be a straight line.
- The slope of the line is positive since both α and C are positive constants.
- The y-intercept is also positive since Q0 is a positive constant.
5. Conclusion about the graph:
Since the slope is constant and positive, and the y-intercept is also a constant positive value, the graph will be a straight line that starts above the origin and rises as time increases.
Final Answer:
The graph between potential V and time t is a straight line with a positive slope, starting from Q0C on the y-axis.
---
The potential V across a capacitor is given by the formula:
V=QC
where C is the capacitance of the conductor.
Given Q=αt+Q0, we can substitute this into the potential formula:
V=αt+Q0C
We can rewrite the potential as:
V=αCt+Q0C
This is a linear equation in the form V=mt+b, where:
- m=αC (the slope)
- b=Q0C (the y-intercept)
- The graph of V versus t will be a straight line.
- The slope of the line is positive since both α and C are positive constants.
- The y-intercept is also positive since Q0 is a positive constant.
Since the slope is constant and positive, and the y-intercept is also a constant positive value, the graph will be a straight line that starts above the origin and rises as time increases.
The graph between potential V and time t is a straight line with a positive slope, starting from Q0C on the y-axis.
Topper's Solved these Questions
- CAPACITANCEBOOK - RESONANCE ENGLISHCHAPTER - CAPACITANCEEXERCISE - Exercise - 3
26 Videos
- CAPACITANCEBOOK - RESONANCE ENGLISHCHAPTER - CAPACITANCEEXERCISE - High Level Problems
16 Videos
- CAPACITANCEBOOK - RESONANCE ENGLISHCHAPTER - CAPACITANCEEXERCISE - Exercise - 1
79 Videos
- ATOMIC PHYSICSBOOK - RESONANCE ENGLISHCHAPTER - ATOMIC PHYSICSEXERCISE - Advanved level problems
17 Videos
- COMMUNICATION SYSTEMSBOOK - RESONANCE ENGLISHCHAPTER - COMMUNICATION SYSTEMSEXERCISE - Exercise 3
13 Videos
Similar Questions
A particle having a velocity v=v0 at t=0 is decelerated at the rate |a|=α√v, where α is a positive constant.
View SolutionA charge Q is given to the plates of an isolated capacitor of capacitance C. Now, the terminals of this capacitor are connected to the terminals of an inductor L at t = 0. After how much time will the energy stored in the capacitor and the Inductor become equal?
View SolutionPotential difference that is applied across a conductor of resistance .R. varies with time .t. according to the equation V(t)=V0e−t/z where z is a constant that has dimonsions of time. Obviously, the applied potential difference decreases exponentially with time. Charge that passes through any fixed observation point within the conductor between t=0 and t=z will be
View SolutionThe displacement x of a particle varies with time t as x=ae−αt+beβt. Where a,b,α and β positive constant.
The velocity of the particle will.
View SolutionThe displacement x of a particle varies with time t as x=ae−αt+beβt. Where a,b,α and β positive constant.
The velocity of the particle will.
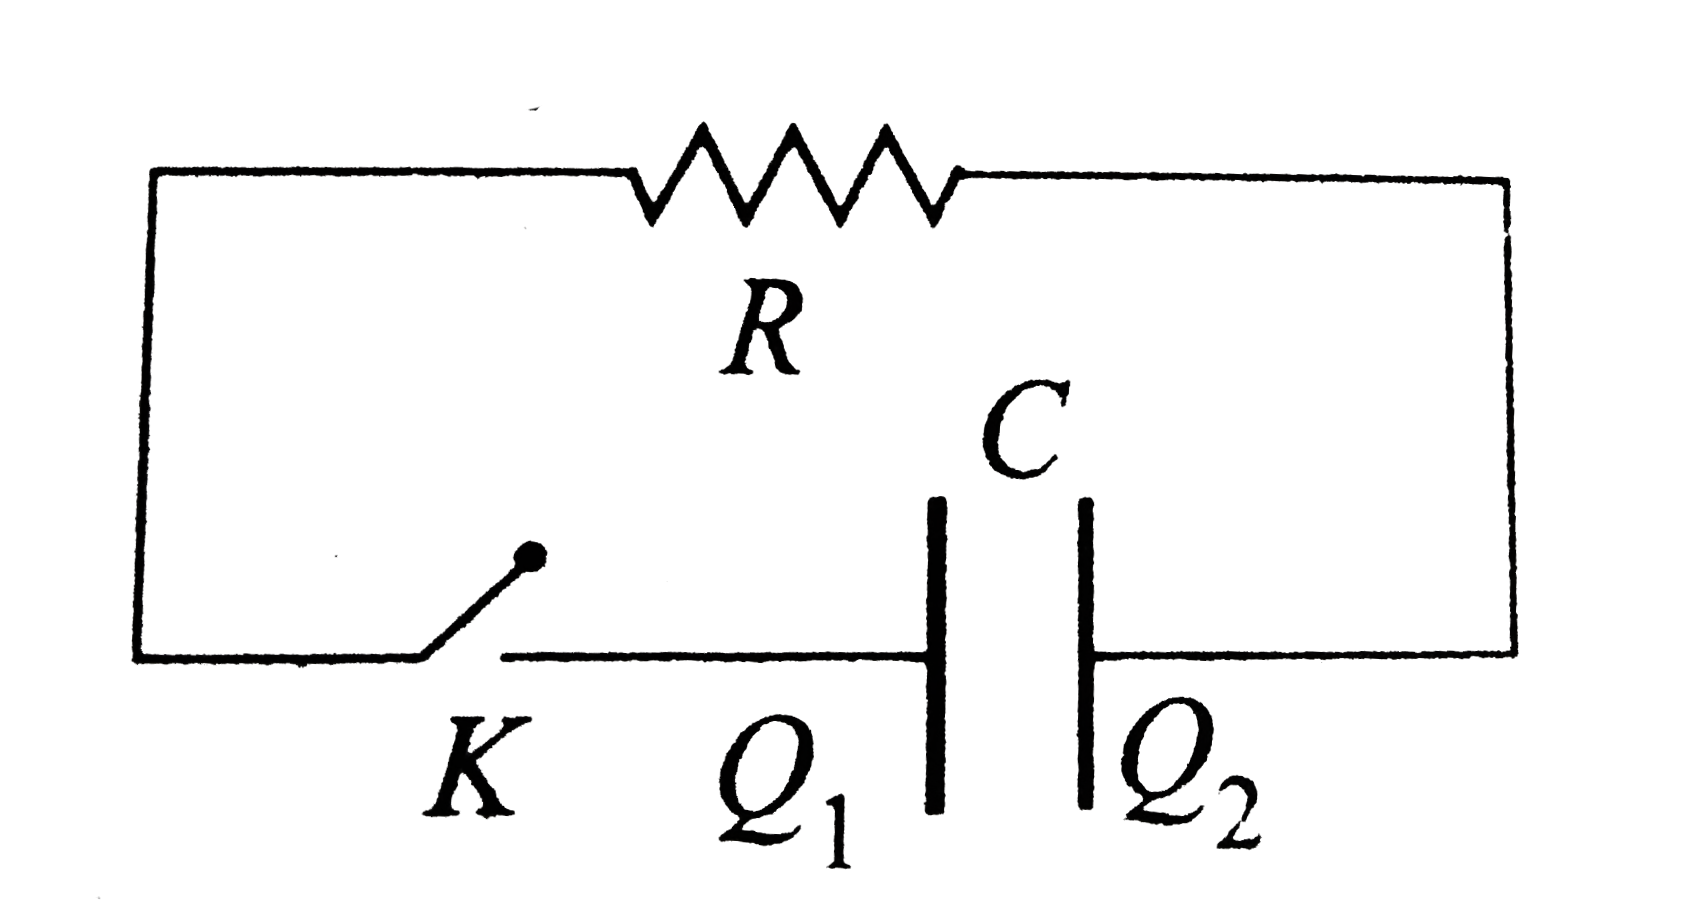
View SolutionThe plates of a capacitor of capacitance C are given the charges Q1andQ2 as shown in figure. Now the switch is closed at t =0. Find the charges on plates after time t.
View SolutionThe charge flowing throug a conductor beginning with time to=0 is given by the formula q=2t2+3t+1 (coulombs). Find the current i=dqdt at the end of the 5th seconds.
View SolutionThe time dependence of a physical quantity P is given by P=P0exp(−αt2), where α is a constant and t is time. The constant α
View SolutionThe time dependence of a physical quantity P is given by P=P0exp(−αt2), where α is a constant and t is time. The constant α
View SolutionA capacitor of capacitance C=2.0±0.1μF is charged to a voltage V=20±0.2V. What will be the charge Q on the capacitor ? Use Q=CV.
View Solution
