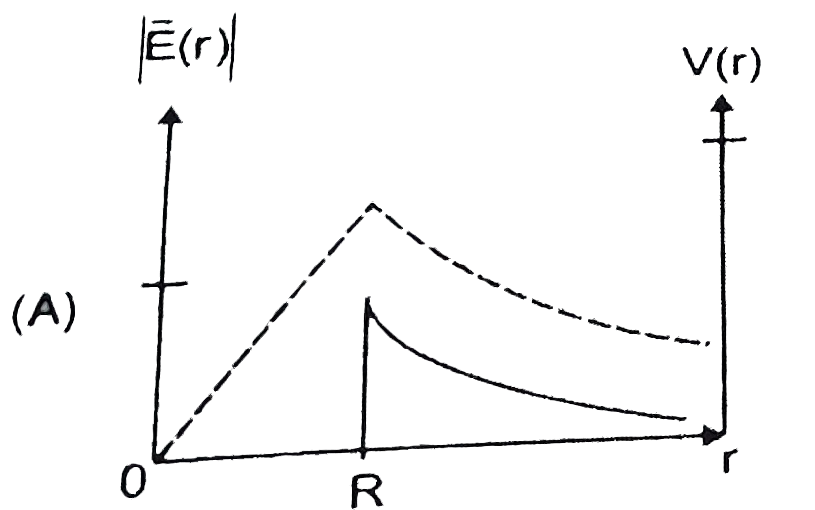
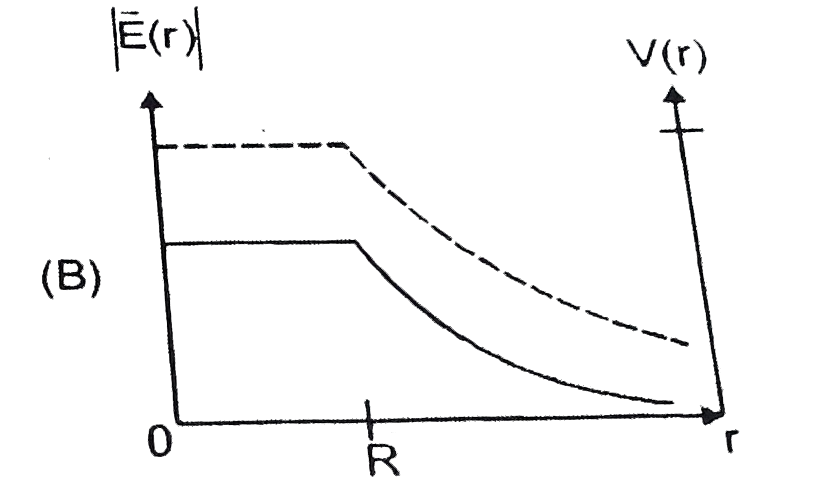
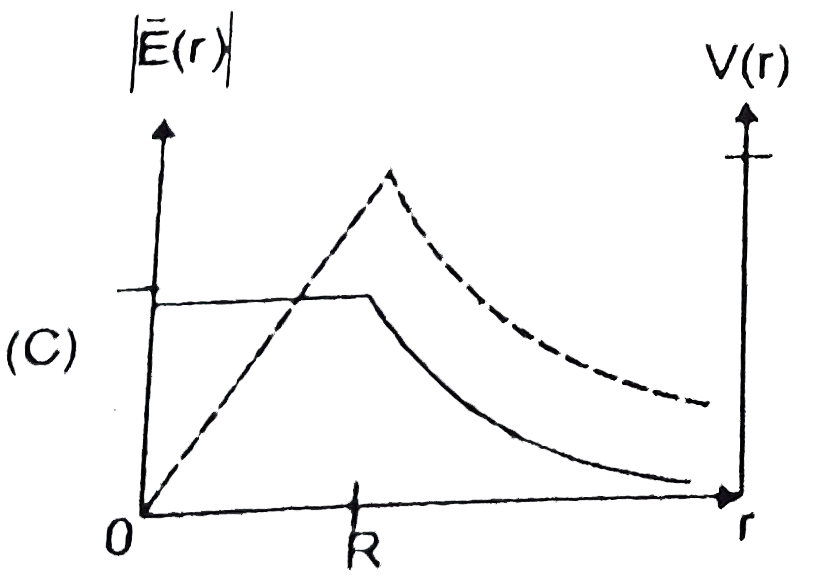
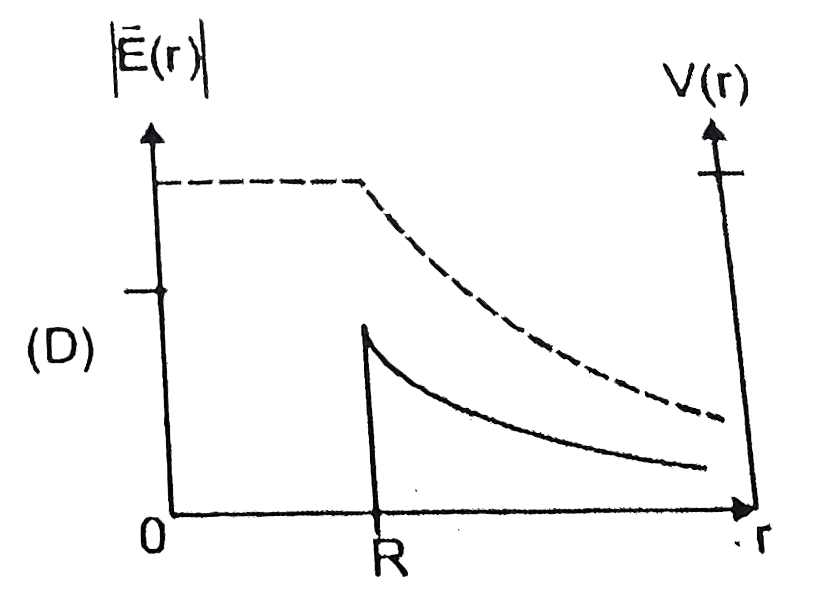
Consider a thin spherical shell of radius R with its centre at the origin, carrying uniform positive surface charge density. The variation of the magnitude of the electric field ∣∣→E(r)∣∣ and the electric potential V (r) with the distance r from the center, is best represented by which graph?


The correct Answer is:D
Step by step video & image solution for Consider a thin spherical shell of radius R with its centre at the origin, carrying uniform positive surface charge density. The variation of the magnitude of the electric field |vecE(r)| and the electric potential V (r) with the distance r from the center, is best represented by which graph? by Physics experts to help you in doubts & scoring excellent marks in Class 12 exams.
Updated on:21/07/2023Topper's Solved these Questions
- ELECTROSTATICSBOOK - RESONANCE ENGLISHCHAPTER - ELECTROSTATICSEXERCISE - Part - II
23 Videos
- ELECTROSTATICSBOOK - RESONANCE ENGLISHCHAPTER - ELECTROSTATICSEXERCISE - HLP
40 Videos
- ELECTROSTATICSBOOK - RESONANCE ENGLISHCHAPTER - ELECTROSTATICSEXERCISE - Part - IV
9 Videos
- ELECTROMAGNETIC INDUCTIONBOOK - RESONANCE ENGLISHCHAPTER - ELECTROMAGNETIC INDUCTIONEXERCISE - A.l.P
19 Videos
- EXPERIMENTAL PHYSICSBOOK - RESONANCE ENGLISHCHAPTER - EXPERIMENTAL PHYSICSEXERCISE - PART -II
10 Videos
Similar Questions
Conisder a thin spherical shell of radius R with centre at the origin, carrying uniform poistive surface charge denisty. The variation of the magnitude of the electric field ∣∣→E(r)∣∣ and the electric potential V(r) with the distance r from the centre, is best represented by which graph?
View SolutionA long thin flat sheet has a uniform surface charge density σ. The magnitude of the electric field at a distance .r. from it is given by
View Solution
Knowledge Check
Consider a thin spherical shell of radius R consisting of uniform surface charge density σ. The electric field at a point of distance x from its centre and outside the shell is
Ainversely proportional to σBdirectly proportional to x2Cdirectlr proportional to RDinversely proportional to x2
A thin spherical shell of radius R has charge Q spread uniformly over its surface. Which of the following graphs most closely represents the electric field E(r) produced by the shell in the range 0≤r<∞, where r is the distance from the centre of the shell?
View SolutionA thin spherical shell of radius R has charge Q spread uniformly over its surface. Which of the following graphs most closely represents the electric field E(r) produced by the shell in the range 0≤r<∞, where r is the distance from the centre of the shell?
View SolutionA non-conducting solid sphere of radius R, has a uniform charge density. The graph representing variation of magnitude of electric field (E) as a function of distance (x) from the centre of the sphere is

View SolutionVariation of electric potential due to npn-conducting (positively charged) solid sphere with distance from its centre is best represented as
View SolutionThe electric field inside a spherical shell of uniform surface charge density is
View SolutionAn isolated solid metal sphere of radius R is given an electric charge. The variation of the intensity of the electric field with the distance r from the centre of the sphere is best shown by
View SolutionThe electric field due to uniformly charged sphere of radius R as a function of the distance from its centre is represented graphically by
View Solution
