Use the method of least squares to fit a trend line to the data in Problem 6 below. Also, obtain the trend value for the year 1975.
The correct Answer is:y = 5+0.8x , y = 9.8
Topper's Solved these Questions
- QUESTION BANK 2021BOOK - NAVNEET PUBLICATION - MAHARASHTRA BOARDCHAPTER - QUESTION BANK 2021EXERCISE - Part II 4. TIME SERIES (V) Activity based questions)
4 Videos
- QUESTION BANK 2021BOOK - NAVNEET PUBLICATION - MAHARASHTRA BOARDCHAPTER - QUESTION BANK 2021EXERCISE - Part II 5. INDEX NUMBERS (I) Choose the correct alternative.)
9 Videos
- QUESTION BANK 2021BOOK - NAVNEET PUBLICATION - MAHARASHTRA BOARDCHAPTER - QUESTION BANK 2021EXERCISE - Part II 4. TIME SERIES (III) State whether each of the following is True or False.)
5 Videos
- PROBABILITY DISTRIBUTIONBOOK - NAVNEET PUBLICATION - MAHARASHTRA BOARDCHAPTER - PROBABILITY DISTRIBUTIONEXERCISE - MULTIPLE CHOICE QUESTIONS
9 Videos
- THREE DIMENSIONAL GEOMETRY BOOK - NAVNEET PUBLICATION - MAHARASHTRA BOARDCHAPTER - THREE DIMENSIONAL GEOMETRY EXERCISE - MULTIPLE CHOICE QUESTIONS
8 Videos
Similar Questions
The following table gives the production of steel (in millions of tons) for years 1976 to 1986.

Fit a trend line by the method of least squares. Also, obtain the trend value for the year 1990.
View SolutionIf the arithmetic mean of the data given below is 20.6, let us find the value of 'a'
View Solution
Knowledge Check
(##KPL_SAT_PRD_PLS_C09_E01_004_Q01.png" width="80%">
The scaterplot abouve shows data collected each year after the British Parlimament enacted a mandatory seat belt law and line of beast fit to the data. Which of the following equations best represents the trend of the data shown in the figure ?Ay=0.4x+25By=1.8x+15Cy=2.1x+35Dy=2.6x+25
Obtain trend values for data in Problem 1 using 4-yearly centered moving averages.
View SolutionThe index number by the method of aggregates for the year 2010, taking 2000 as the base year, was found to be 116. If sum of the prices in the year 2000 is Rs. 300, find the values of x and y in the data given below:

View SolutionLeast squares method of finding trend is very simple and does not involve any calculations.
View SolutionThe production of cement by a firm in years 1 to 9 is given below:

Calculate the trend values for the above series by the 3 yearly moving average method.
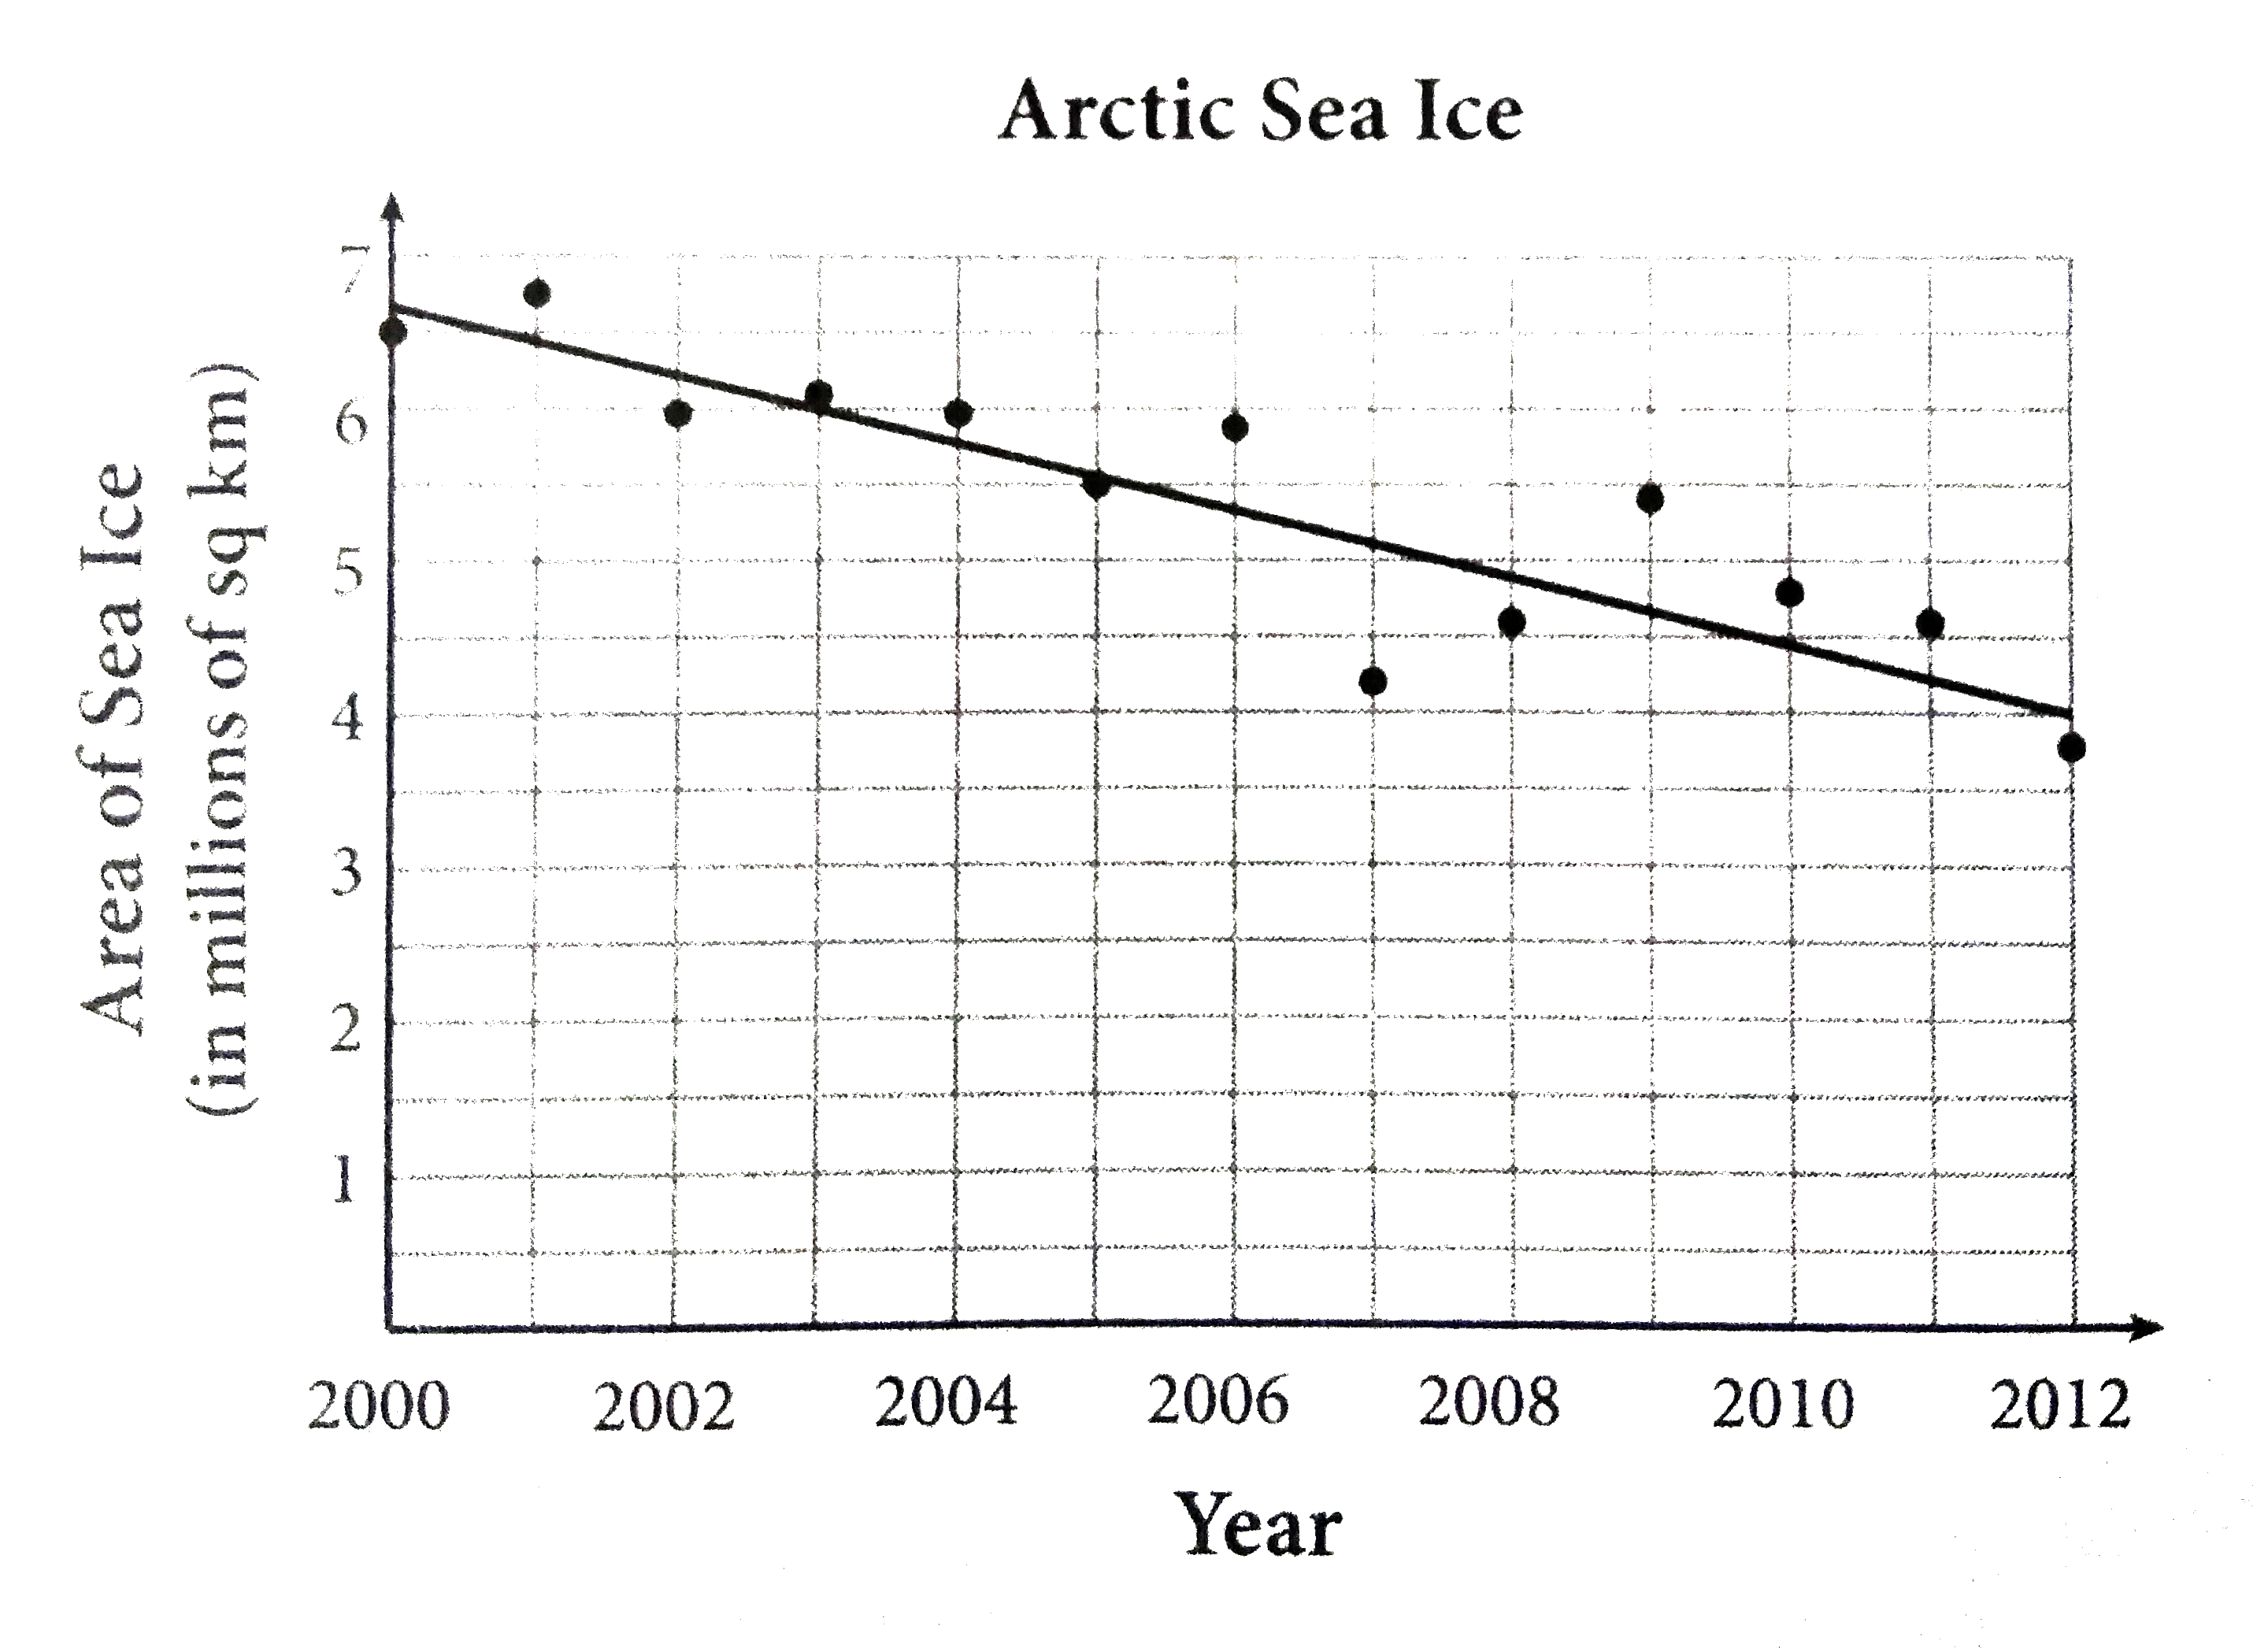
View SolutionSea ice extent is a measurement of the area of ocean with at least 15% sea ice. The graph below shows data for the extent of Artic sea ice between 2000 and 2012 as reported by the National Snow and Ice Data Center. The line of best fit is also shown. The equations of the line is A(t)=−0.187t+380.5, where A(t) represents the area of measurement sea ice in the Artic Ocean in the year t.

Q. Assuming the trend of the data continues in what year will the measurable sea ice in the Arctic Ocean cease to exist?
View SolutionThe…………concept states that if straight line method of depreciation is used in one used in one year, then it should also be usd in the next year.
View SolutionThe use of calculator is not permited.

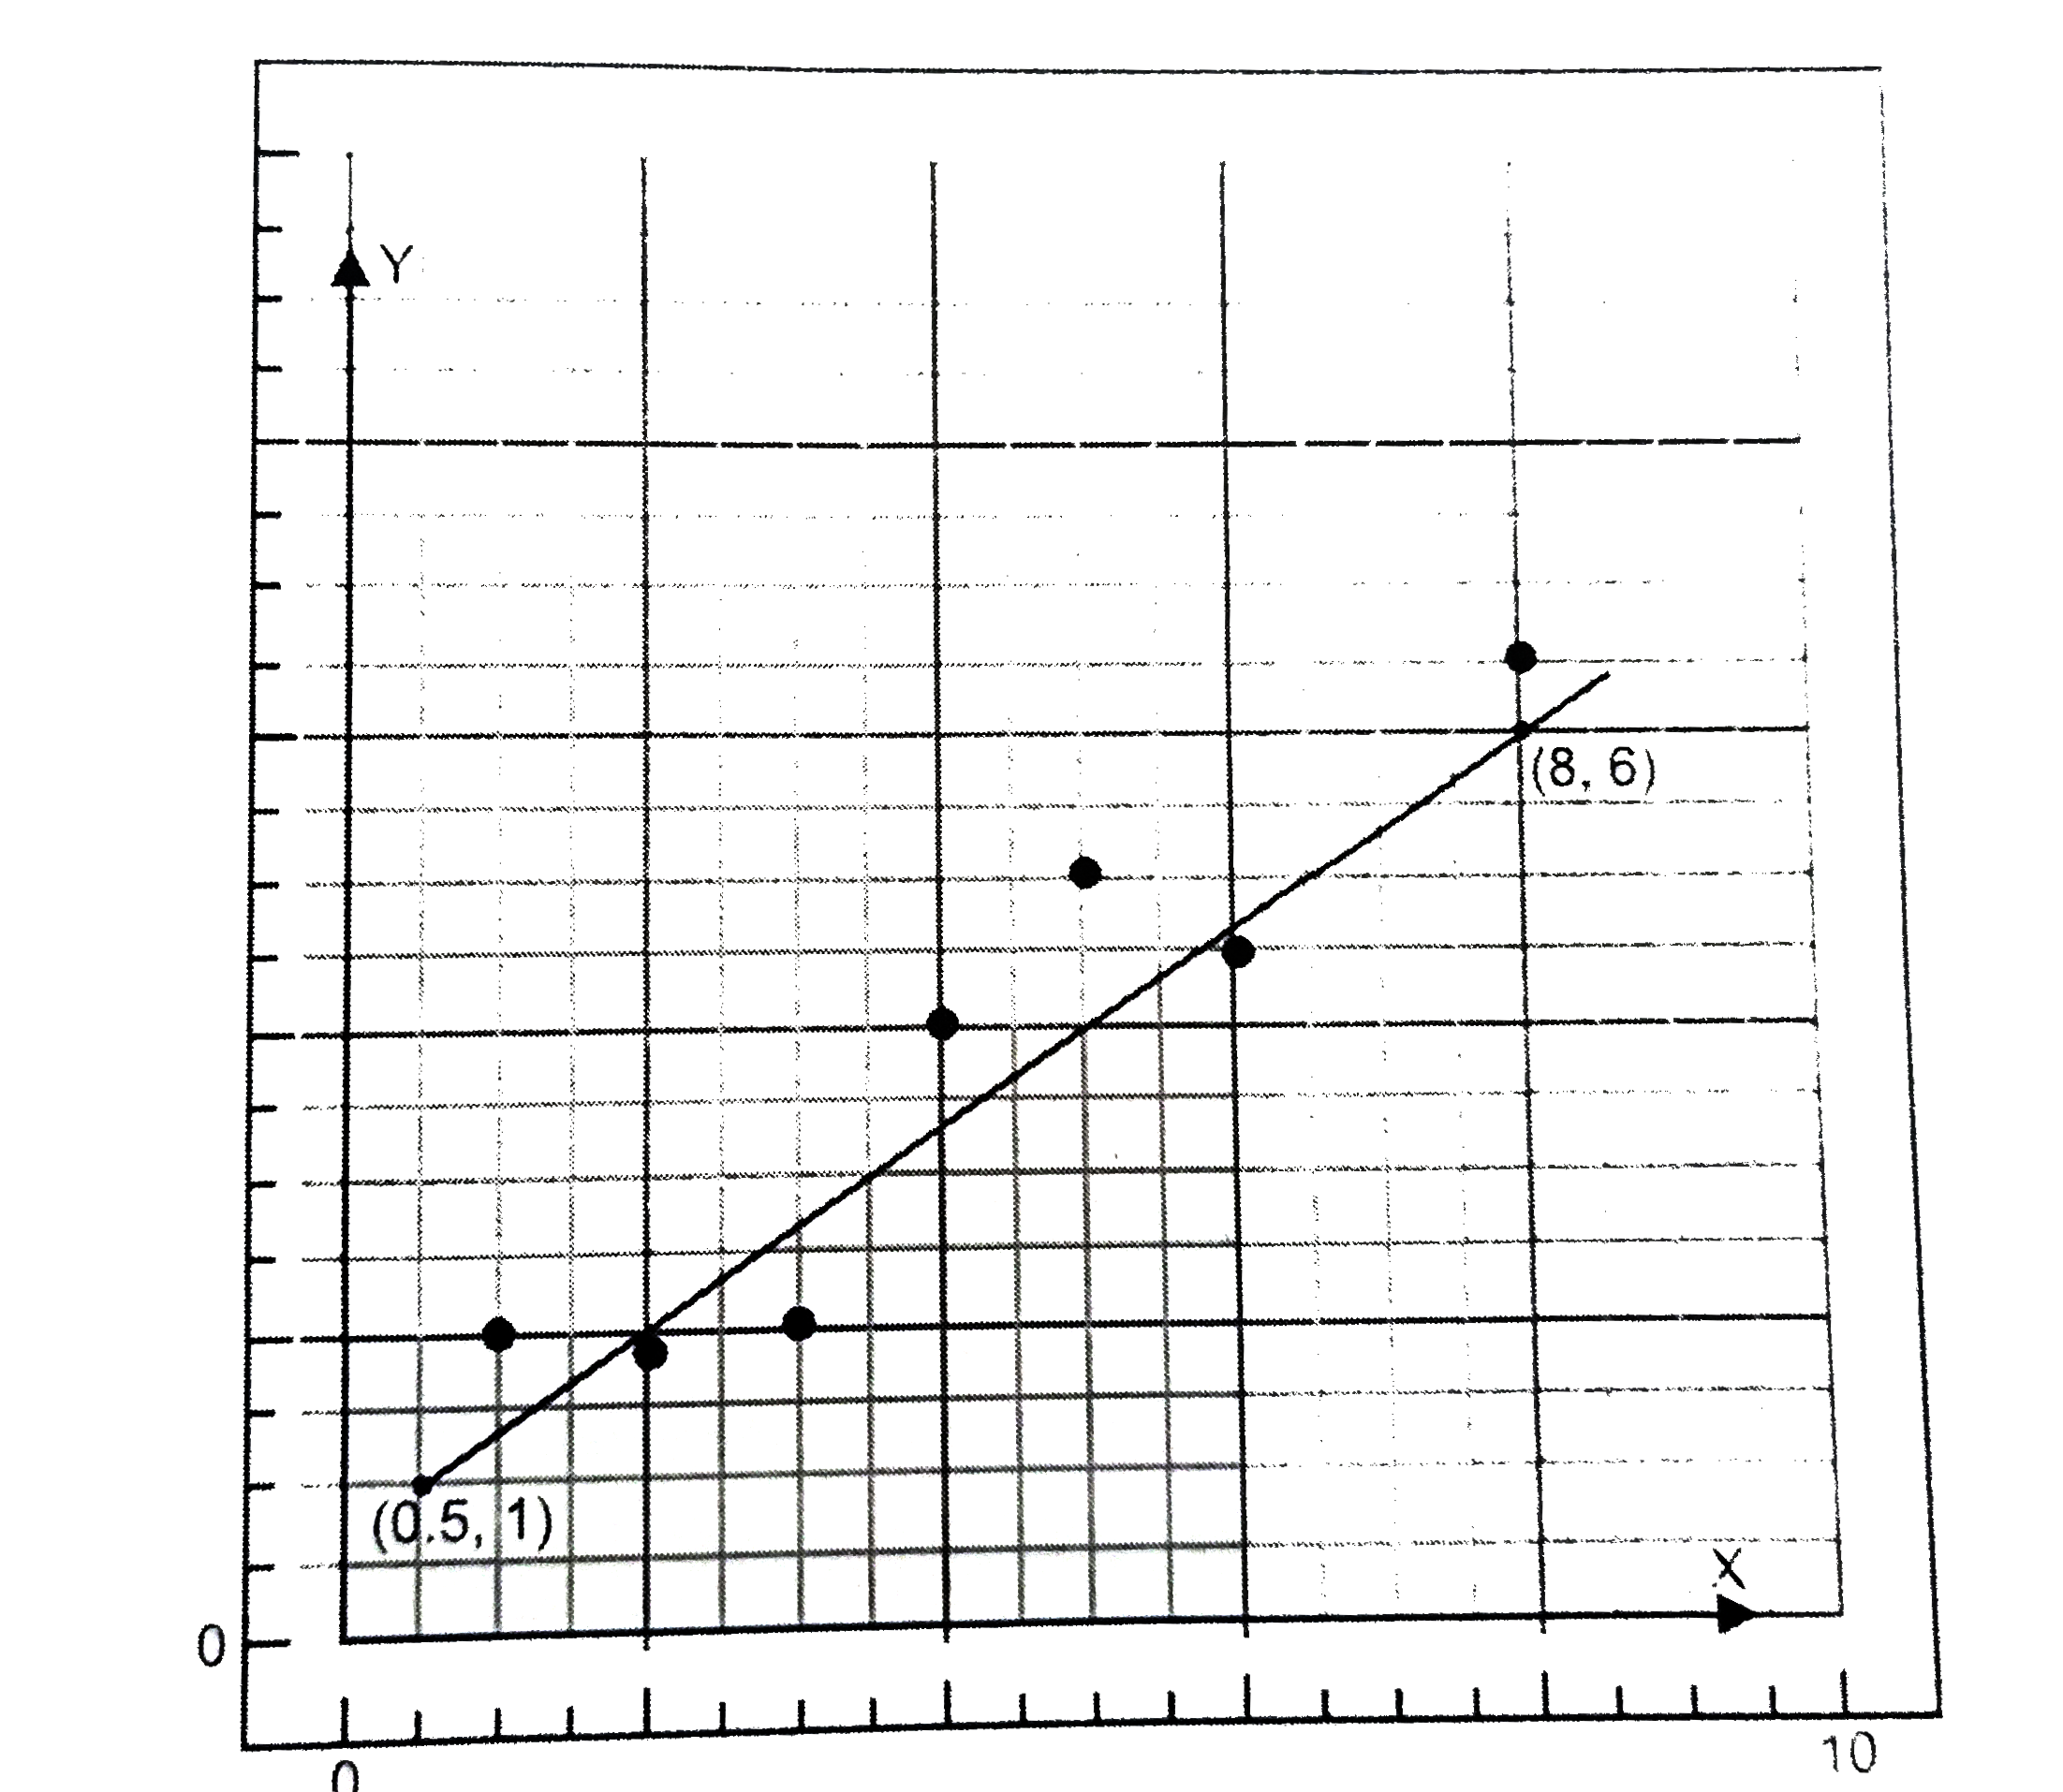
In the graph above ,a number of points are shown, and the line of best fit is also shown. What is the sum of the expected values of the Y coordinates of the points having X values 7 and 9?
View Solution
