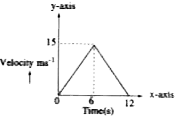
The velocity-time graph of a particle moving along a straight line is shown in fig. The rate of acceleration and deceleration is constant and it is equal to 5ms−2. If the average velocity during the motion is 20ms−1, Then  .
.
The distace travelled with uniform velcoty is .
5s
10s
20s
5√2s
The correct Answer is:A
Average speed =20ms−1
(##VMCPHYXIWORBOK01_C02E03027_S01.png width=80%><br> ("Total distance ")/( "Total time") =20 rArr ( "Area of graph")/( 20 + t) = 20 rArr (1)/(2) (20 +t+20 - t ) xx 5t = 20 (20 +t) rArr t5s
Topper's Solved these Questions
- BOOK - VMC MODULES ENGLISHCHAPTER - KINEMATICS OF A PARTICLE EXERCISE - JEE MAIN (archive)19videos
KINEMATICS OF A PARTICLE
- BOOK - VMC MODULES ENGLISHCHAPTER - KINEMATICS OF A PARTICLE EXERCISE - JEE Advanced (archive)14videos
KINEMATICS OF A PARTICLE
- BOOK - VMC MODULES ENGLISHCHAPTER - KINEMATICS OF A PARTICLE EXERCISE - LEVEL 175videos
KINEMATICS OF A PARTICLE
- BOOK - VMC MODULES ENGLISHCHAPTER - JEE MAIN REVISON TEST-23EXERCISE - PHYSICS (SECTION 2)1videos
JEE MAIN REVISON TEST-23
- BOOK - VMC MODULES ENGLISHCHAPTER - LAWS OF MOTION EXERCISE - IMPECCABLE53videos
LAWS OF MOTION
Similar Questions
The velocity-time graph of a particle moving along a straight line is shown is Fing. The rate of acceleration and deceleration is constant and it is equal to 5ms−2. If the a average velocity during the motion is 20ms−1, Then
 .
.
The distace travelled with uniform velcoty is .View SolutionThe velocity-time graph of a particle moving along a straight line is shown is . The rate of acceleration and deceleration is constant and it is equal to 5ms−2. If the a average velocity during the motion is 20ms−1, Then
 .
.
The value of t is.View SolutionThe velocity-time graph of a particle moving along a straight line is shown is Fig. The rate of acceleration and deceleration is constant and it is equal to 5ms−2. If the a average velocity during the motion is 20ms−1, Then
 .
.
The maximum velocity of the particle is .View SolutionThe velocity-time graph of a particle moving along a straight line is shown is Fig. The rate of acceleration and deceleration is constant and it is equal to 5ms−2. If the a average velocity during the motion is 20ms−1, Then
 .
.
The maximum velocity of the particle is .View Solution
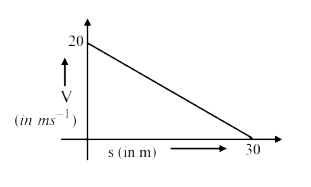
The velocity displacement graph of a particle moving along a straight line is shown in figure.
Then the acceleration displacement graph is.View SolutionThe velocity –position graph of a particle moving along a straight line is shown. Then acceleration of the particle at s = 15 m is :
 View Solution
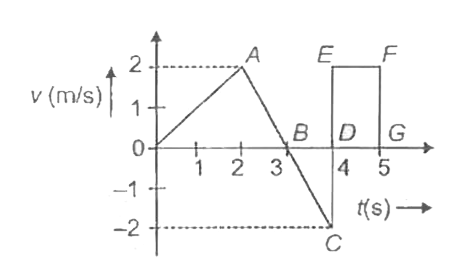
The velocity - time graph of a particle moving along a straight line is shown in the figure given below
The displacement of the particle in 5 second is
 View Solution
The velocity - displacement graph of a particle moving along a straight line is shown
The most suitable acceleration - displacement graph will be
 View Solution
The velocity and time graph for a particle moving in a straight line s shown in the figure. Then, the average velocity between t=4 s and t=6 s is _____
 View Solution
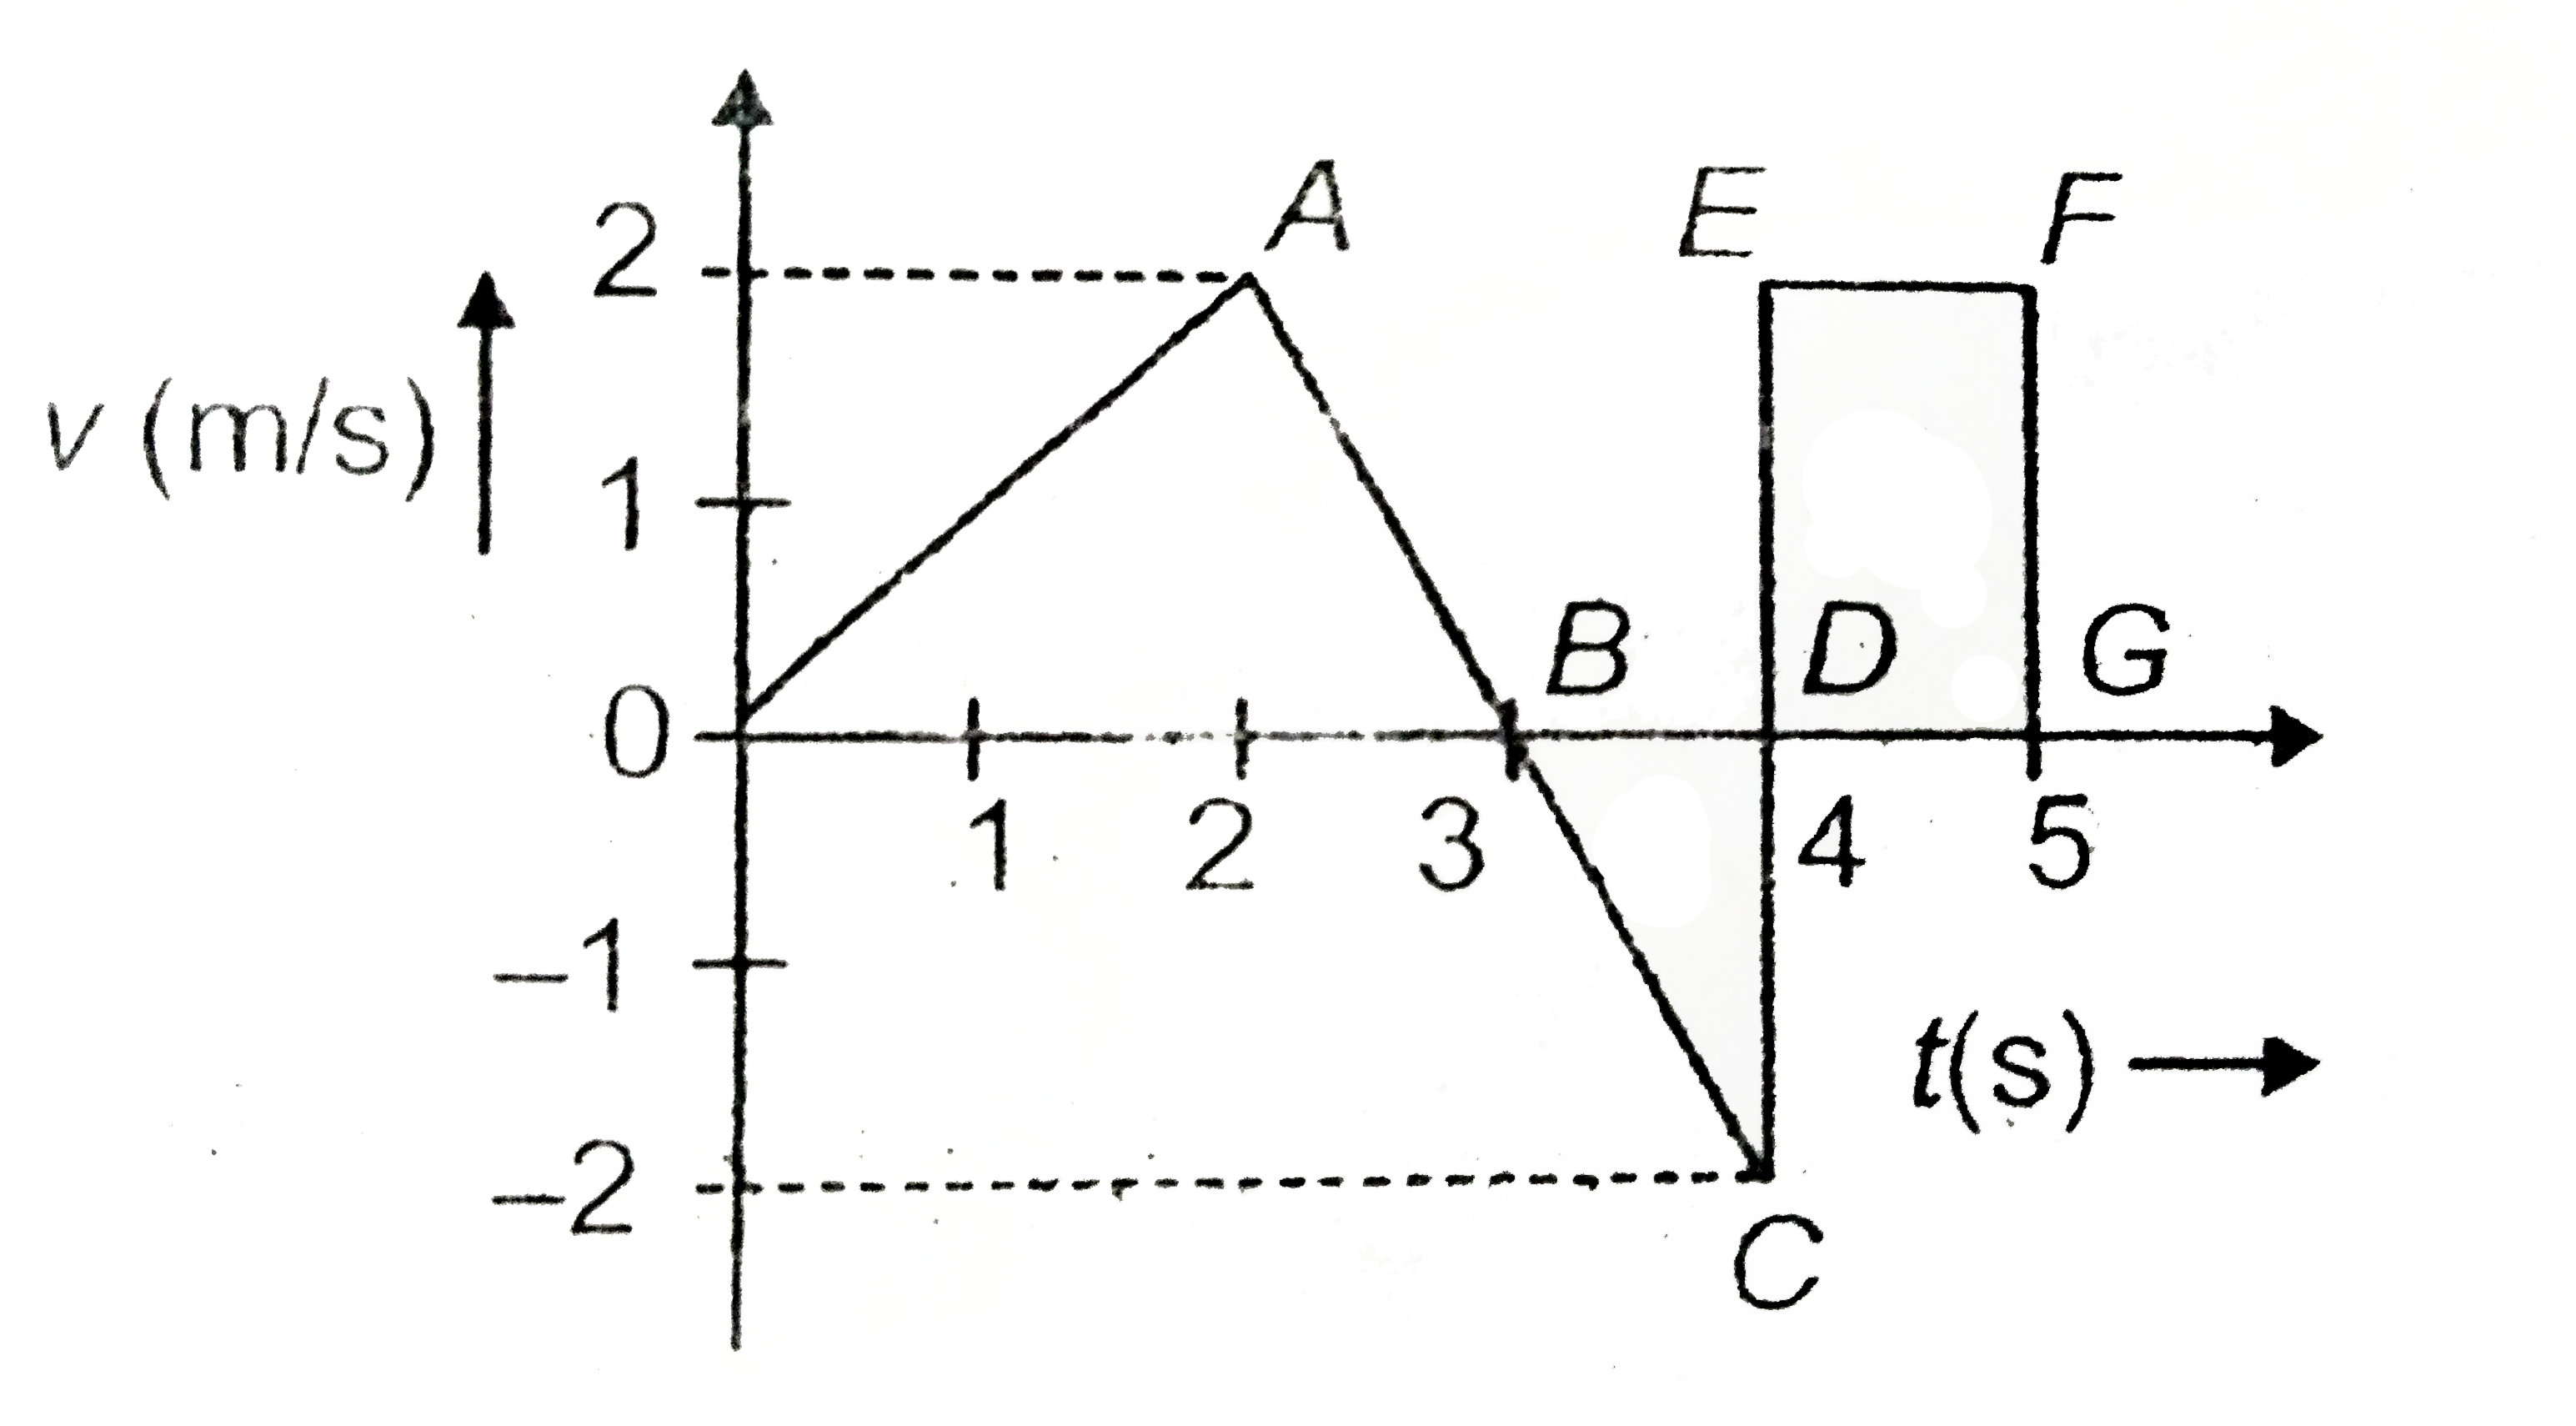
The velocity-time graph of a particle moving along a straight line is shown in the figure-given below

The displacement of the particle in 5 second is
0.5 m
1 m
2 m
4 mView Solution

