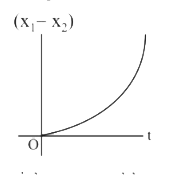
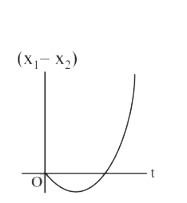
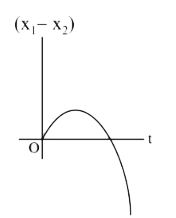
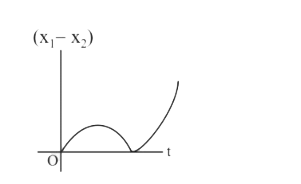
A body is at rest at x = 0. At t = 0, it starts moving in the positive x-direction with a constant acceleration. At the same instant another body passes through x = 0 moving in the positive x-direction with a constant speed. The position of the first body is given by x1(t) after time 't' and that of the second body by x(2)(t) after the same time interval. Which of the following graph correctly describes (x1−x2) as function of time 't' ?


The correct Answer is:B
For 1st particle : " " It starts moving (u1=0)which acceleration
∴ x1=x1(t)=u1t+12at2=12at2…….(1)
For 2nd particle :
It is moving with constant velocity (v) ∴ x2=x2(t)=vt ...(ii)
Relative position of particle 1 w.r.t. 2, x1−x2=x1=12at2−vt ...(iii)
Hence graph should be parabola.
Differentiating equation (iii) w.r.t time, we get the relative velocity of particle 1 w.r.t 2
|v1,2|dx1.2dt=at−v, t=0,v1,2=−v
It means the slope of the parabola at t = 0 should be negative.
The parabola should open upwards. Hence graph ‘B’ fulfills the requirements.
Topper's Solved these Questions
- KINEMATICS OF A PARTICLE BOOK - VMC MODULES ENGLISHCHAPTER - KINEMATICS OF A PARTICLE EXERCISE - JEE Advanced (archive)
14 Videos
- KINEMATICS OF A PARTICLE BOOK - VMC MODULES ENGLISHCHAPTER - KINEMATICS OF A PARTICLE EXERCISE - LEVEL 2
65 Videos
- JEE MAIN REVISON TEST-23BOOK - VMC MODULES ENGLISHCHAPTER - JEE MAIN REVISON TEST-23EXERCISE - PHYSICS (SECTION 2)
1 Videos
- LAWS OF MOTION BOOK - VMC MODULES ENGLISHCHAPTER - LAWS OF MOTION EXERCISE - IMPECCABLE
53 Videos
Similar Questions
A body is at rest at x=0 . At t=0, it starts moving in the positive x−direction with a constant acceleration . At the same instant another body passes through x=0 moving in the positive x−direction with a constant speed . The position of the first body is given by x1(t) after time 't', and that of the second body by x2(t) after the same time interval . which of the following graphs correctly describes (x1−x2) as a function of time 't' ?
View SolutionA particle located at x = 0 at time t = 0, starts moving along the positive x-direction with a velocity that varies as v=p√x. The displacement of the particle varies with time as (where, p is constant)
View Solution
Knowledge Check
A body of mass 0.4kg starting at origin at t=0 with a speed of 10ms−1 in the positive x-axis direction is subjected to a constant F=8 N towards negative x-axis. The position of body after 25s is
A−6000mB−8000mC+4000mD+7000m
A particle located at x=0 at time t=0, starts moving along with the positive x−direction with a velocity 'v' that varies as v=a√x. The displacement of the particle varies with time as
View SolutionA particle located at x=0 at time t=0, starts moving along with the positive x-direction with a velocity v that varies as v=α√x. The displacement of the particle varies with time as
View SolutionA particle located at position x=0, at time t=0, starts moving along the positive x-direction with a velocity v2=αx (where alpha is a positive constant). The displacement of particle is proportional to
View SolutionA particle starts moving from position of rest under a constant acceleration. If it travels a distance x in t second, what distance will it travel in next t second?
View SolutionA wave propagates in a string in the positive x-direction with velocity v. The shape of the string at t=t0 is given by
f(x,t0)=Asin(x2a2). Then the wave equation at any instant t is given by
View SolutionA body of mass m moving with a constant velocity v hits another body of the same mass moving with the same velocity v but in the opposite direction and sticks to it. The velocity of the compound body after collision is
View SolutionA point mass starts moving in straight line with constant acceleration a from rest at t=0. At time t=2s, the acceleration changes the sign remaining the same in magnitude. The mass returns to the initial position at time t=t0 after start of motion. Here t0 is
View Solution
