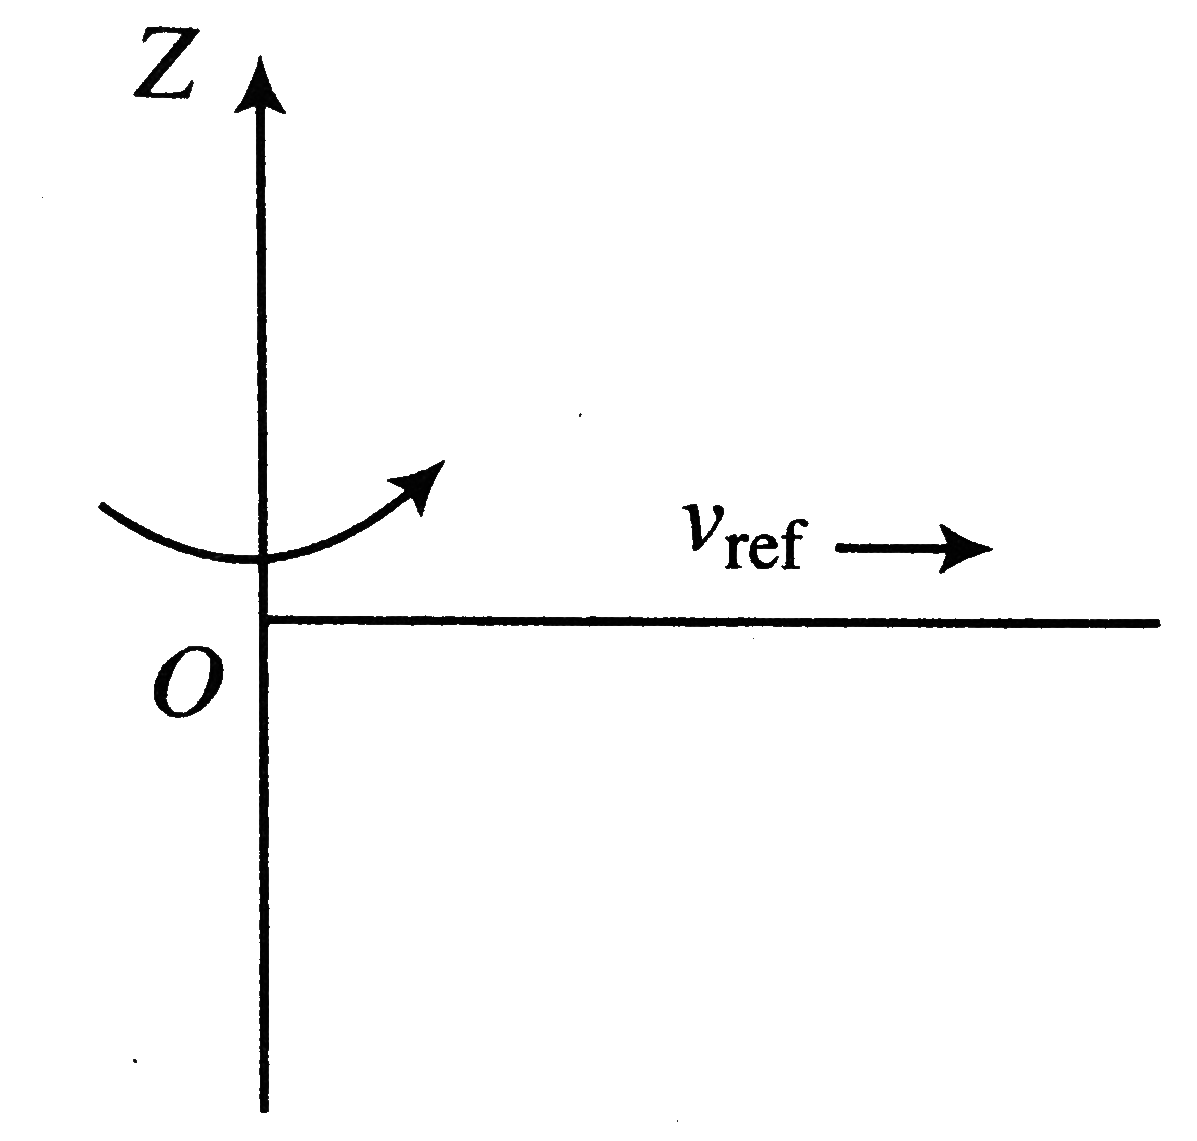
A thin uniform rod, pivoted at O, is rotating in the horizontal plane with constant angular speed ω, as shown in the figure. At tune t=0, a small insect starts from O and moves with constant speed v with respect to the rod towards the other end. It reaches the end of the rod at t=T and stops. The angular speed of the system remains ω throughout. The magnitude of the torque (τ) on the system about O, as a function of time is best represented by which plot?


The correct Answer is:B
Let M and l be the mass and length of the rod respectively and m be the mass of the insect. Let insect be at a distance x from O at any instant of time t.
x= vt
Angular momentum of the system abot O.
L=[MI23+mx2]ω=[MI23+m(vt)2]ω

=[MI23+mv2t2]ω,As|→τ|=dLdt=ddt[MI23+mV2t2]ω
As ω and v remain constant. ∴|→τ|=2mωv2t
∴|→τ|∝t
Hence, the graph is a straight line passing through the (0,0). Option (b) represents correct plot.
Topper's Solved these Questions
- ROTATIONAL MOTION BOOK - VMC MODULES ENGLISHCHAPTER - ROTATIONAL MOTION EXERCISE - JEE Advanced (Archive) (MULTIPLE OPTIONS CORRECT TYPE)
17 Videos
- ROTATIONAL MOTION BOOK - VMC MODULES ENGLISHCHAPTER - ROTATIONAL MOTION EXERCISE - JEE Advanced (Archive) (LINKED COMPREHENSIVE TYPE)
7 Videos
- ROTATIONAL MOTION BOOK - VMC MODULES ENGLISHCHAPTER - ROTATIONAL MOTION EXERCISE - JEE MAIN (ARCHIVE)
58 Videos
- REVISION TEST-2 JEEBOOK - VMC MODULES ENGLISHCHAPTER - REVISION TEST-2 JEEEXERCISE - PHYSICS
25 Videos
- SIMPLE HARMONIC MOTION BOOK - VMC MODULES ENGLISHCHAPTER - SIMPLE HARMONIC MOTION EXERCISE - 7-previous year question
46 Videos
Similar Questions
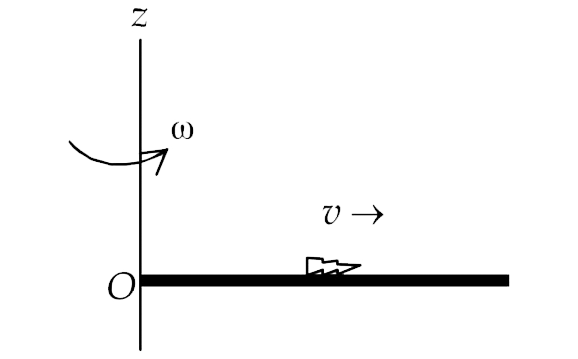
A thin uniform rod, pivoted at O, is rotating in the horizontal plane with constatn angular speed ω, as shown in the figure. At time t = 0, a small insect starts from O and moves with constant sped v, with respect to the rod towards the other end. It reaches the end of the rod at t =T and stops. The angular speed of the system remains ω throughout. The magnitude of the torque (|→π|) about O, as a function of time is best represented by which plot?
View SolutionA uniform rod of length l is rotating with constant angular speed ω as shown in figure. Choose the graph which correctly shows the variation of T with x.
_2019_CBT7_E01_017_Q01.png)
View Solution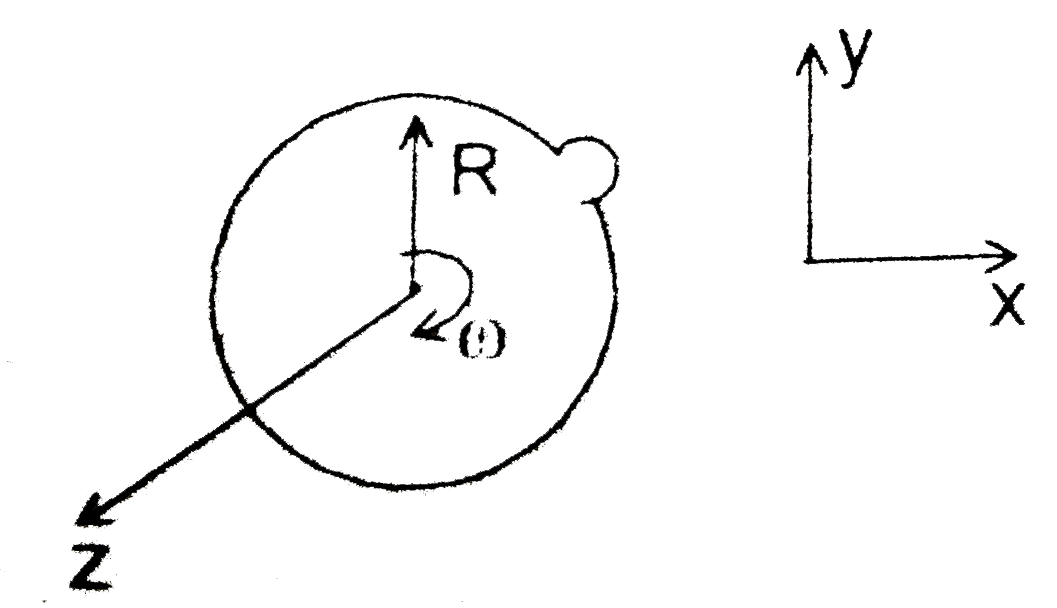
A small pulse is generated on a ring rotating with constant angular velocity ω as shown in the figure. Then the speed of pulse with respect to ground.
View SolutionThe magnitude of displacement of a particle moving in a circle of radius a with constant angular speed ω varries with time t is
View SolutionA uniform rod of mass m and length l rotates in a horizontal plane with an angular velocity ω about a vertical axis passing through one end. The tension in the rod at a distance x from the axis is
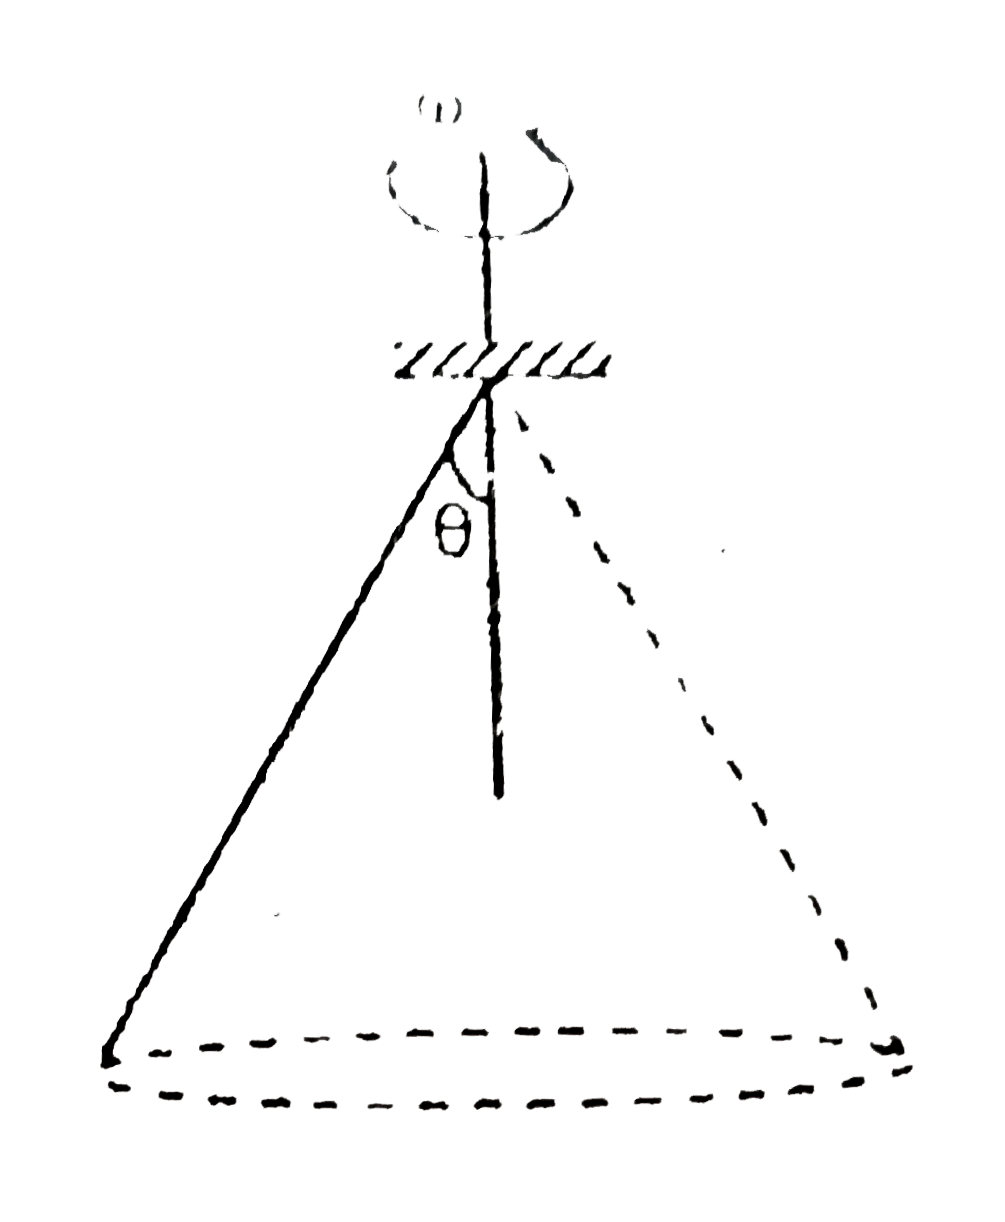
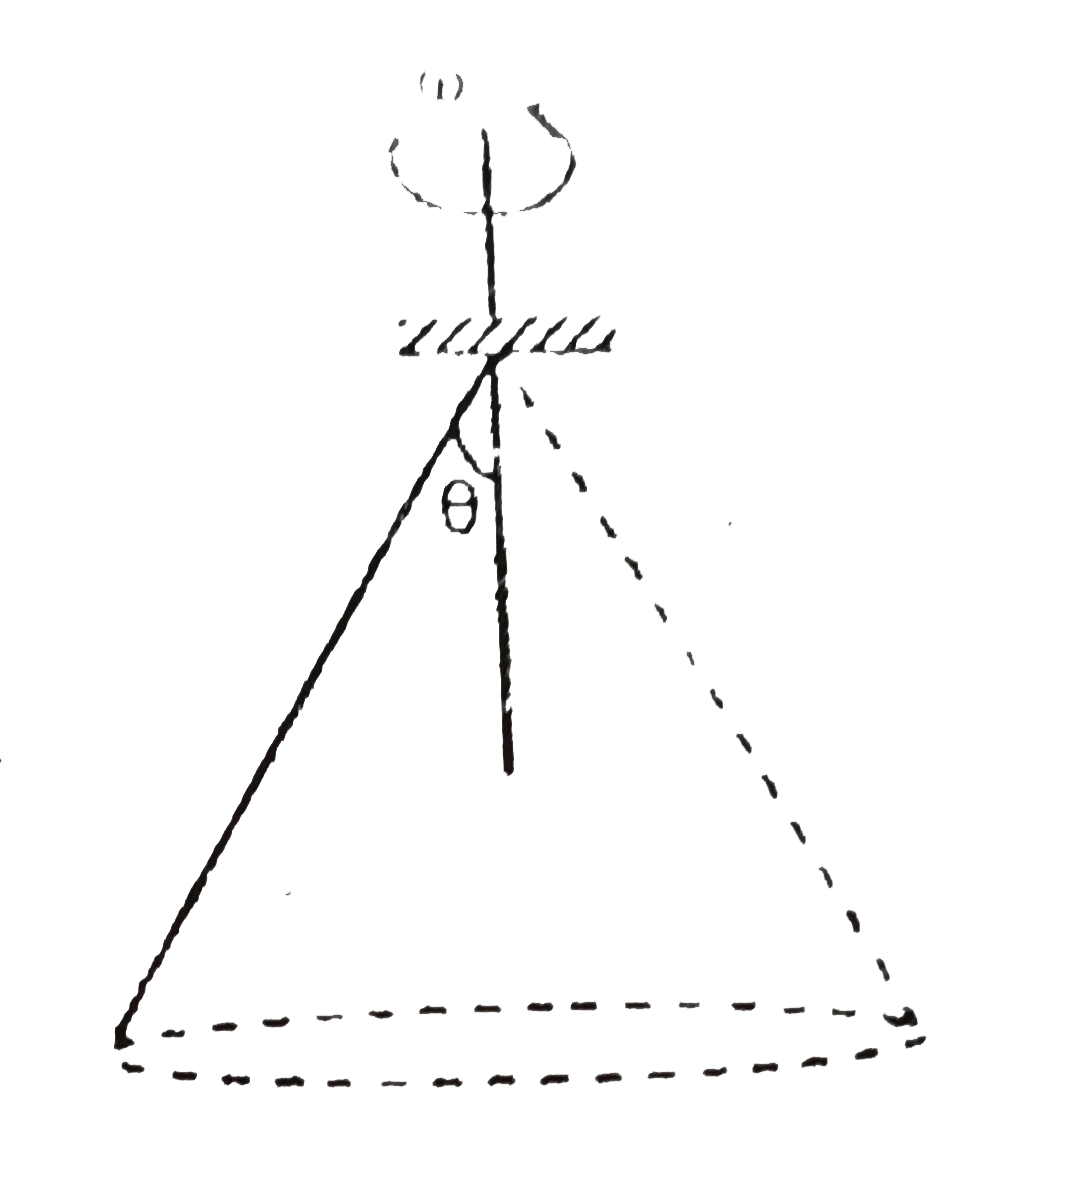
View SolutionA rod of mass m and length l is rotating about a fixed point in the ceiling with an angular velocity ω as shown in the figure. The rod maintains a constant angle θ with the vertical.
What angle will the rod make with the vertical
View Solution_2019_CBT4_E01_067_Q01.png)
A uniform rod of mass M and length L highed at centre is rotating in horizontal plane with angular speed ω0 now two object each of mass m are kept on rod near thhe hinge on both sides. They starts sliding towards ends. Find ω of rod finally
View SolutionA uniform rod of length l is being rotated in a horizontal plane with a constant angular speed about an axis passing through one of its ends. If the tension generated in the rod due to rotation is T(x) at a distance x from the axis. Then which of the following graphs depicts it most closely?
View SolutionA rod of mass m and length l is rotating about a fixed point in the ceiling with an angular velocity ω as shown in the figure. The rod maintains a constant angle θ with the vertical.
What is the rate of change of angular momentum of the rod ?
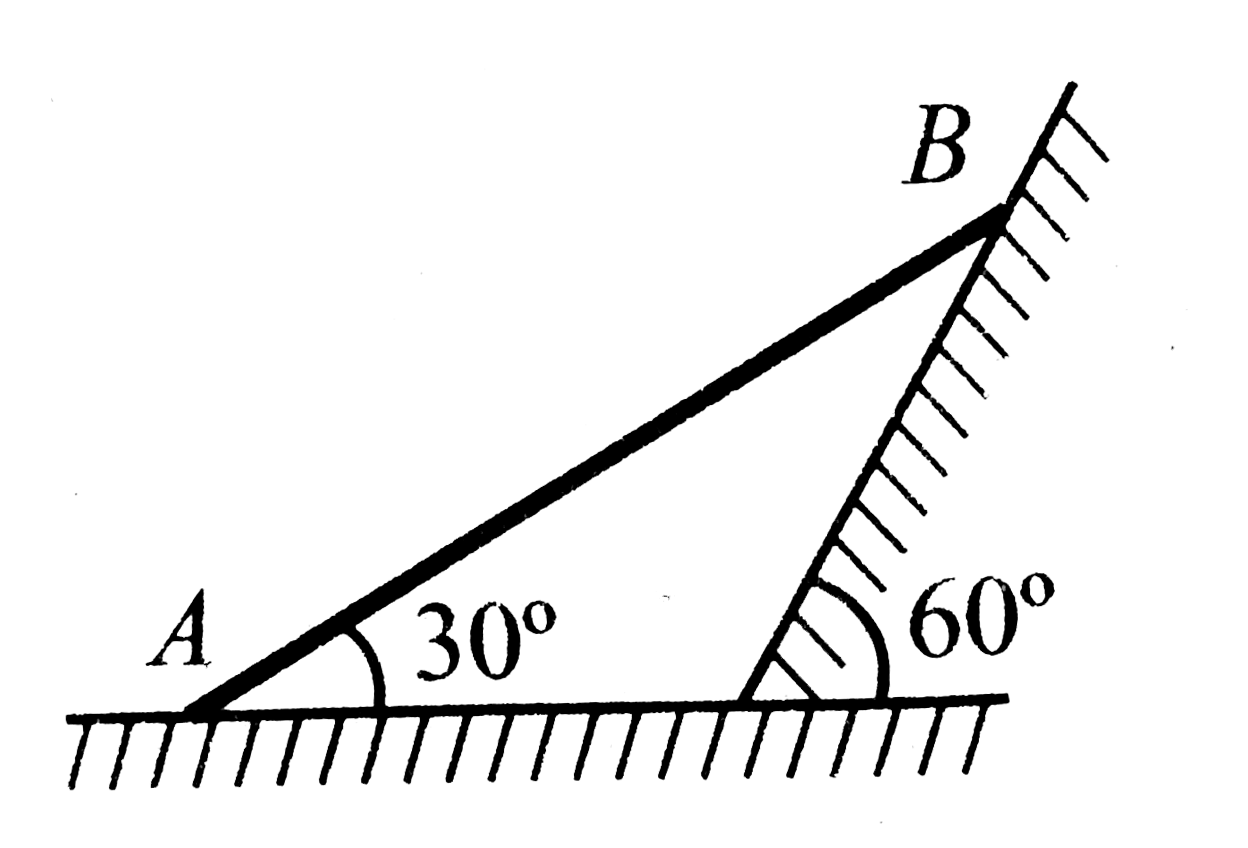
View SolutionIn the figure shown, the instantaneous speed of end A of the rod is v to the left. The angular velocity of the rod of length L must be
View Solution