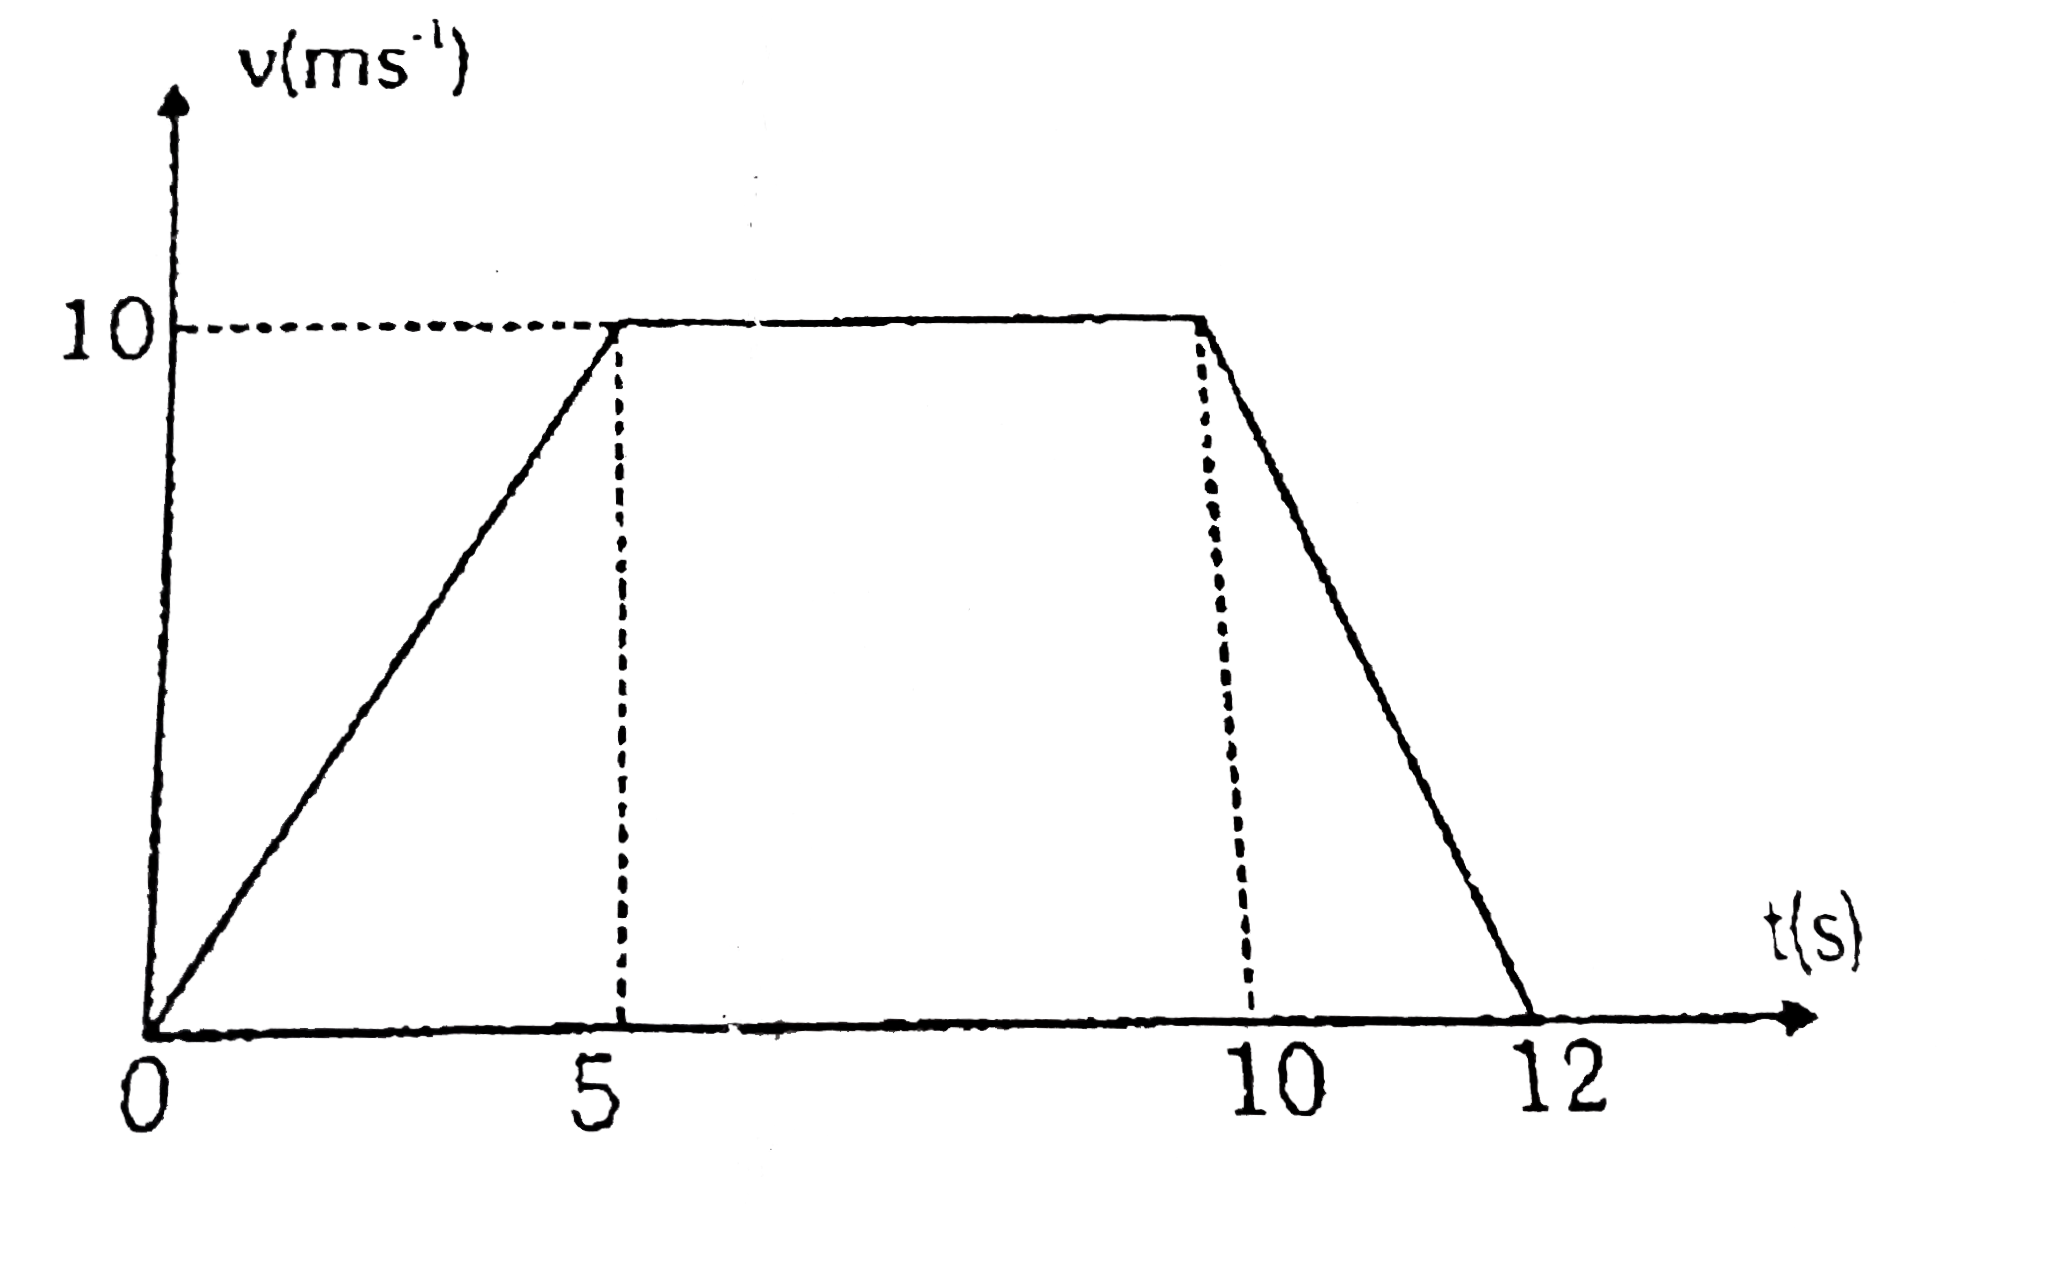
The velocity of a boedy increases for some time, then attains a constnat value and finally the velocity decreases until the body stops. What will be the shape of the velocity-time graph ?
Straight line
Square
Circle
Trapezium
The correct Answer is:D
To determine the shape of the velocity-time graph for the given scenario, we can break down the motion of the body into three distinct phases:
Step 1: Identify the phases of motion
1. Acceleration Phase: The velocity of the body increases over time.
2. Constant Velocity Phase: The body moves with a constant velocity.
3. Deceleration Phase: The velocity of the body decreases until it comes to a stop.
Step 2: Draw the graph for each phase
1. Acceleration Phase:
- During this phase, as time increases, the velocity also increases. This can be represented as a straight line with a positive slope on the velocity-time graph.
- Let’s denote this line as segment A.
2. Constant Velocity Phase:
- In this phase, the velocity remains constant while time continues to increase. This is represented as a horizontal line on the graph.
- We can denote this line as segment B.
3. Deceleration Phase:
- In this phase, the velocity decreases until the body stops. As time increases, the velocity decreases, which can be represented as a straight line with a negative slope on the graph.
- We can denote this line as segment C.
Step 3: Combine the segments
- The overall shape of the velocity-time graph will consist of three segments:
- Segment A (increasing velocity) is a straight line with a positive slope.
- Segment B (constant velocity) is a horizontal line.
- Segment C (decreasing velocity) is a straight line with a negative slope that ends at the time when the body stops (velocity = 0).
Conclusion
- The resulting shape of the velocity-time graph will resemble a trapezium (or a trapezoidal shape) where:
- The left side represents the acceleration phase,
- The top horizontal part represents the constant velocity phase,
- The right side represents the deceleration phase.
Final Answer
The shape of the velocity-time graph is trapezoidal.
---
1. Acceleration Phase: The velocity of the body increases over time.
2. Constant Velocity Phase: The body moves with a constant velocity.
3. Deceleration Phase: The velocity of the body decreases until it comes to a stop.
1. Acceleration Phase:
- During this phase, as time increases, the velocity also increases. This can be represented as a straight line with a positive slope on the velocity-time graph.
- Let’s denote this line as segment A.
- In this phase, the velocity remains constant while time continues to increase. This is represented as a horizontal line on the graph.
- We can denote this line as segment B.
- In this phase, the velocity decreases until the body stops. As time increases, the velocity decreases, which can be represented as a straight line with a negative slope on the graph.
- We can denote this line as segment C.
- The overall shape of the velocity-time graph will consist of three segments:
- Segment A (increasing velocity) is a straight line with a positive slope.
- Segment B (constant velocity) is a horizontal line.
- Segment C (decreasing velocity) is a straight line with a negative slope that ends at the time when the body stops (velocity = 0).
- The resulting shape of the velocity-time graph will resemble a trapezium (or a trapezoidal shape) where:
- The left side represents the acceleration phase,
- The top horizontal part represents the constant velocity phase,
- The right side represents the deceleration phase.
The shape of the velocity-time graph is trapezoidal.
Topper's Solved these Questions
- MOTION IN A STRAIGHT LINE & PLANE BOOK - VMC MODULES ENGLISHCHAPTER - MOTION IN A STRAIGHT LINE & PLANE EXERCISE - ENABLE
50 Videos
- MOTION IN A STRAIGHT LINE & PLANE BOOK - VMC MODULES ENGLISHCHAPTER - MOTION IN A STRAIGHT LINE & PLANE EXERCISE - EFFICIENT
50 Videos
- MOCK TEST 9BOOK - VMC MODULES ENGLISHCHAPTER - MOCK TEST 9EXERCISE - PHYSICS (SECTION 2)
5 Videos
- Motion in Straight Line BOOK - VMC MODULES ENGLISHCHAPTER - Motion in Straight Line EXERCISE - IN-CHAPTER EXERCISE-J
10 Videos
Similar Questions
Knowledge Check
For a uniformly retarded motion, the velocity-time graph is :
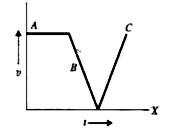
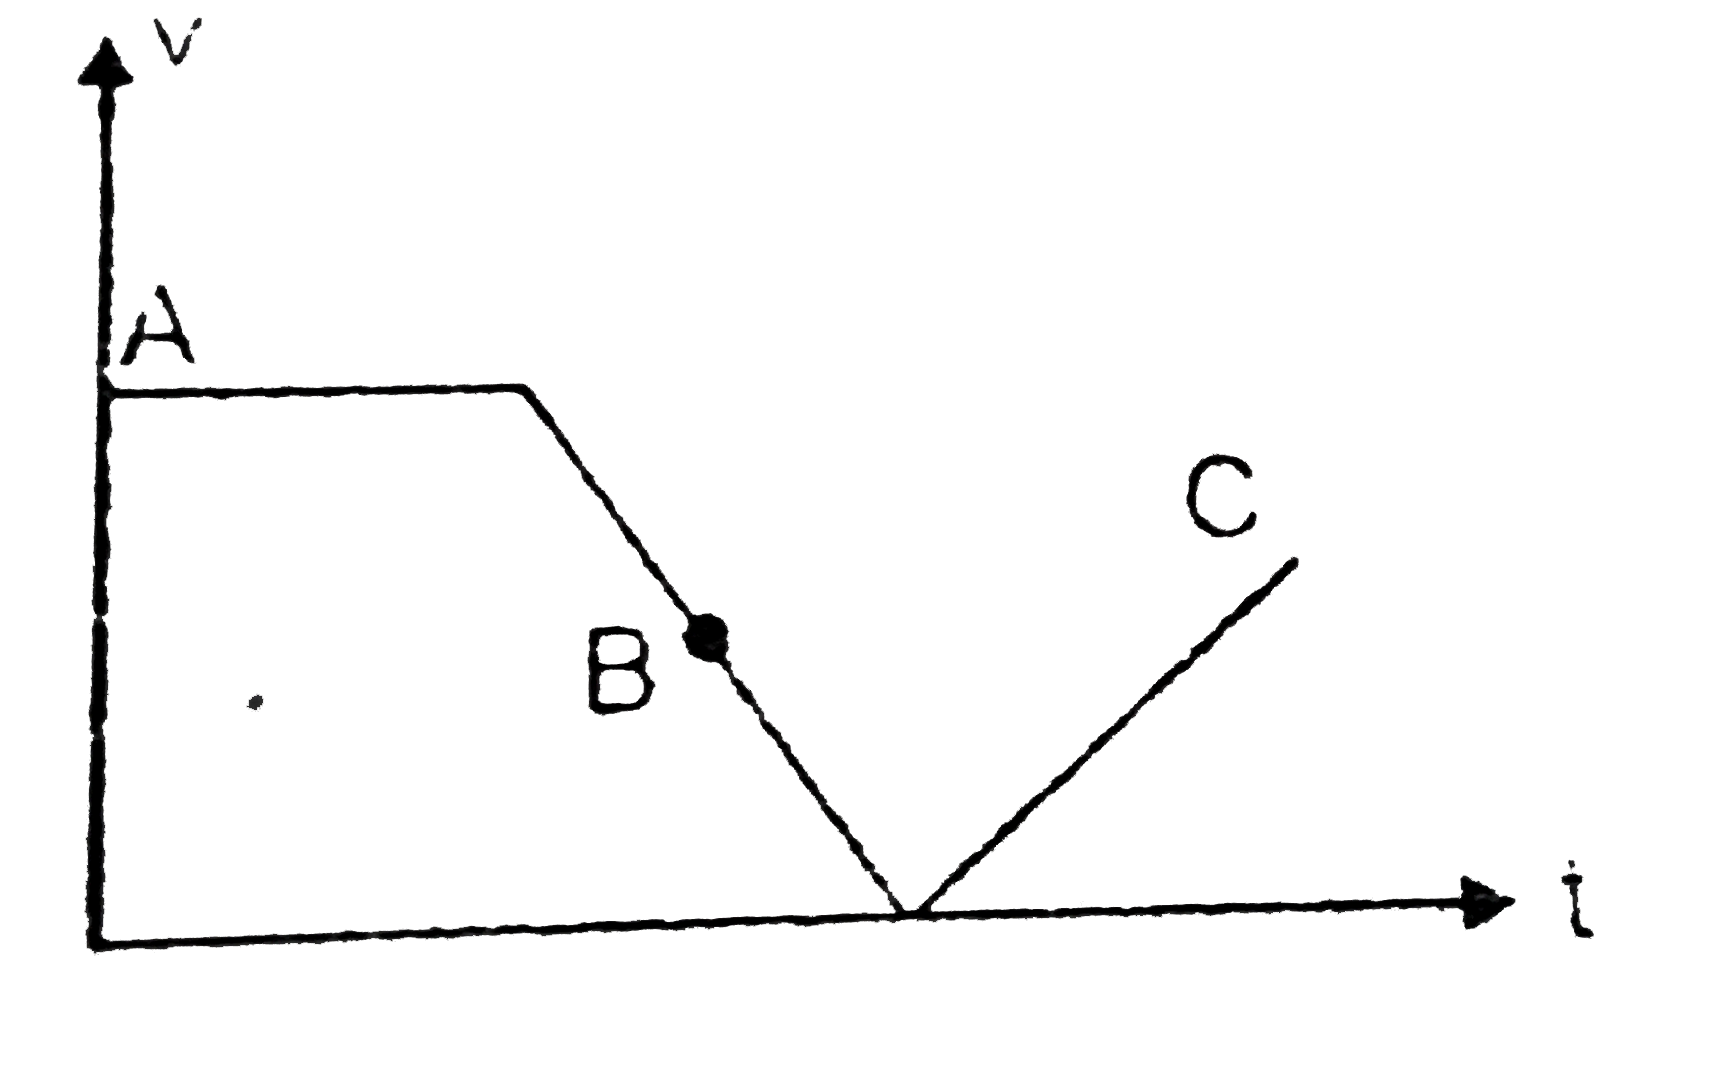
Aa curveBa straight line parallel to the time axisCa straight line perpendicular to the time axis.Da straight line inclined to the time axis.The velocity time graph of a body is shown in fig. 3.3. it implies that at point B
 Athe force is zeroBthere is a force towards motionCthere is force which oppose motionDnone of the above
if average velocity becomes 4 times, then what will be the effect on rms velocity at the temperature?
View SolutionWhat is the quantity which is measured by the area occupied below the velocity-time graph ?
View SolutionPlot a graph of terminnal velocity versus time.
View SolutionThe velocity time graph of a body is shown in fig. it indicates that :

View SolutionDraw displacement time and acceleration -time graph for the given velocity-time graph

View SolutionThe a -t graph is shown in the figure. The maximum velocity attained by the body from rest will be

View Solution
