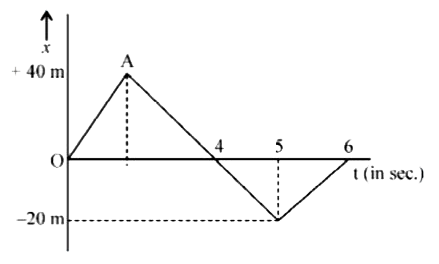
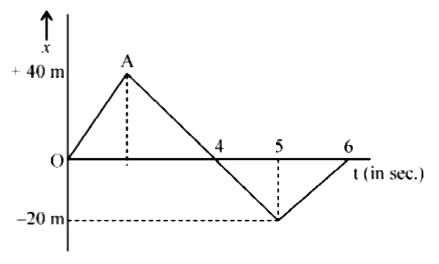
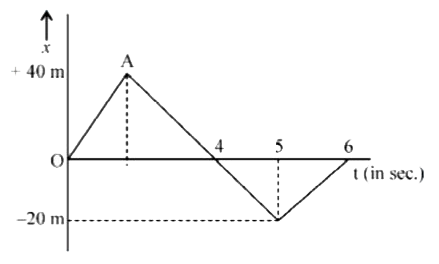
s-t graph of a particle in motion is shown in Fig. Calculate
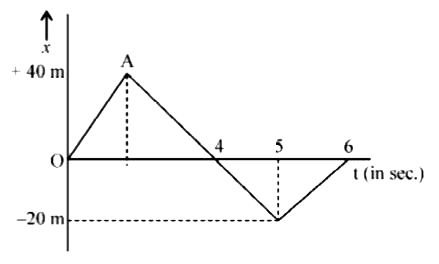
Displacement
0
Topper's Solved these Questions
- Motion in Straight Line BOOK - VMC MODULES ENGLISHCHAPTER - Motion in Straight Line EXERCISE - IN-CHAPTER EXERCISE-A
11 Videos
- Motion in Straight Line BOOK - VMC MODULES ENGLISHCHAPTER - Motion in Straight Line EXERCISE - IN-CHAPTER EXERCISE-B
10 Videos
- Motion in Straight Line BOOK - VMC MODULES ENGLISHCHAPTER - Motion in Straight Line EXERCISE - SOLVED EXAMPLES
20 Videos
- MOTION IN A STRAIGHT LINE & PLANE BOOK - VMC MODULES ENGLISHCHAPTER - MOTION IN A STRAIGHT LINE & PLANE EXERCISE - IMPECCABLE
52 Videos
- Motion in Two DimensionsBOOK - VMC MODULES ENGLISHCHAPTER - Motion in Two DimensionsEXERCISE - MCQ
2 Videos
Similar Questions
Knowledge Check
The velocity-time graph of a particle in one-dimensional motion is shown in the figure. Which of the following formulae is correct for describing the motion of the particle over the time interval t1 to t2?
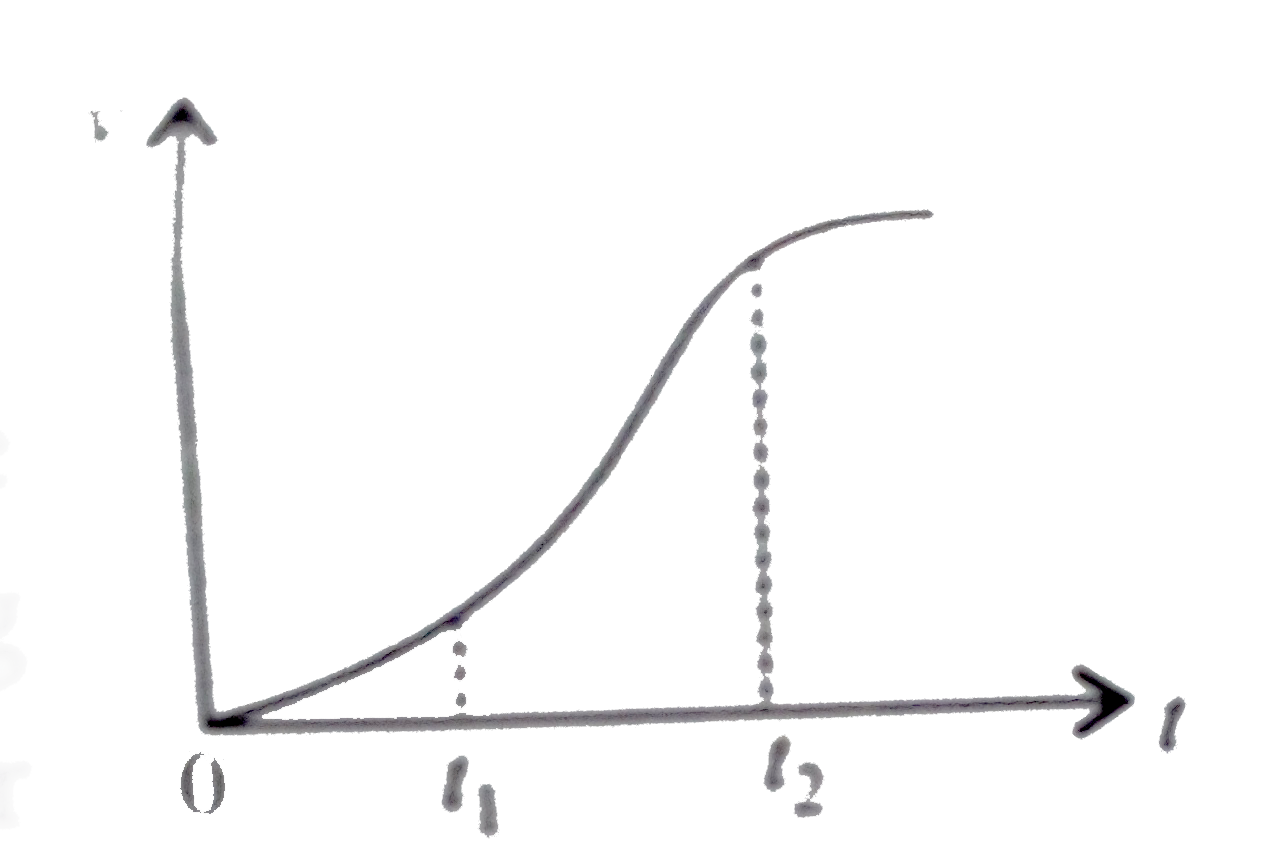 Ax(t2)=x(t1)+v(t1)(t2−t1)+(12)a(t2−t1)2Bv(t2)=v(t1)+a(t2−t1)Cvaverage=x(t2)+x(t1)t2−t1Daaverage=v(t2)−v(t1)t2−t1
s-t graph of a particle in motion is shown in Fig. Calculate Average velocity
View Solutions-t graph of a particle in motion is as shown below.

(a) State, whether the given graph represents a uniform motion or not.
(b) Find velocity of the particle.
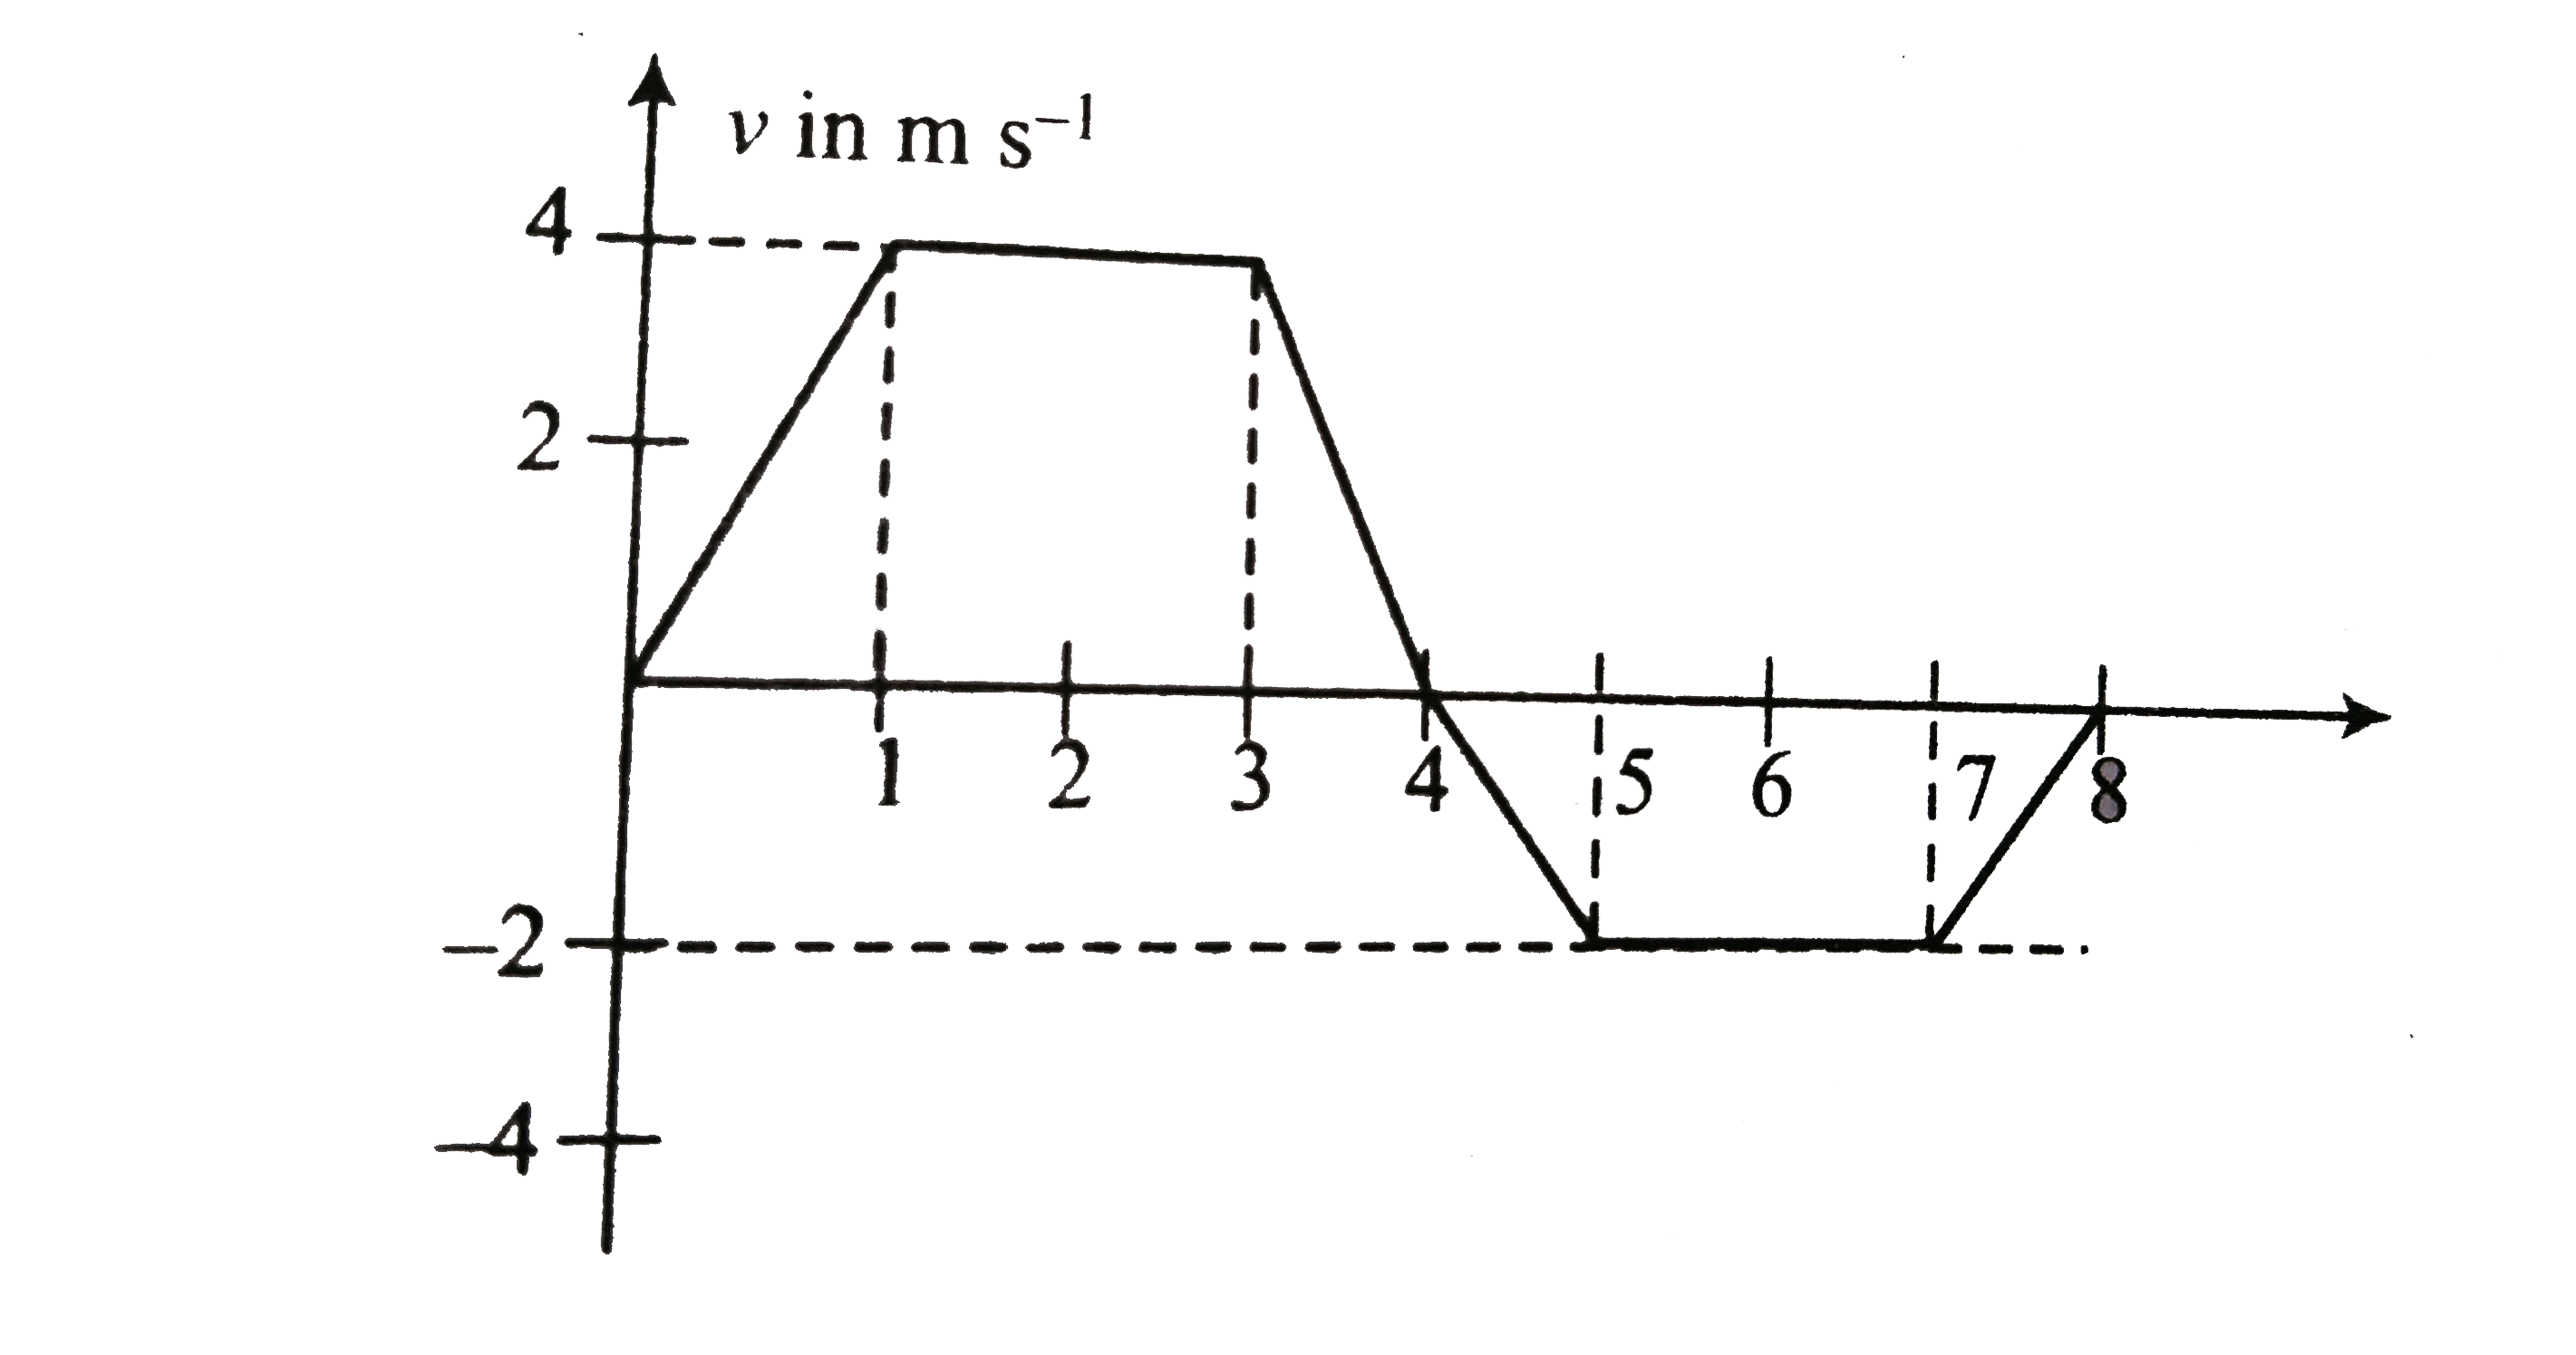
View SolutionThe velocity-time graph of a particle in straight line motion is velocity-time graph of a particle in straight line motion is shown in. The particle starts its motion from origin.
 .
.
The distance of the particle from the origin after 8s is .
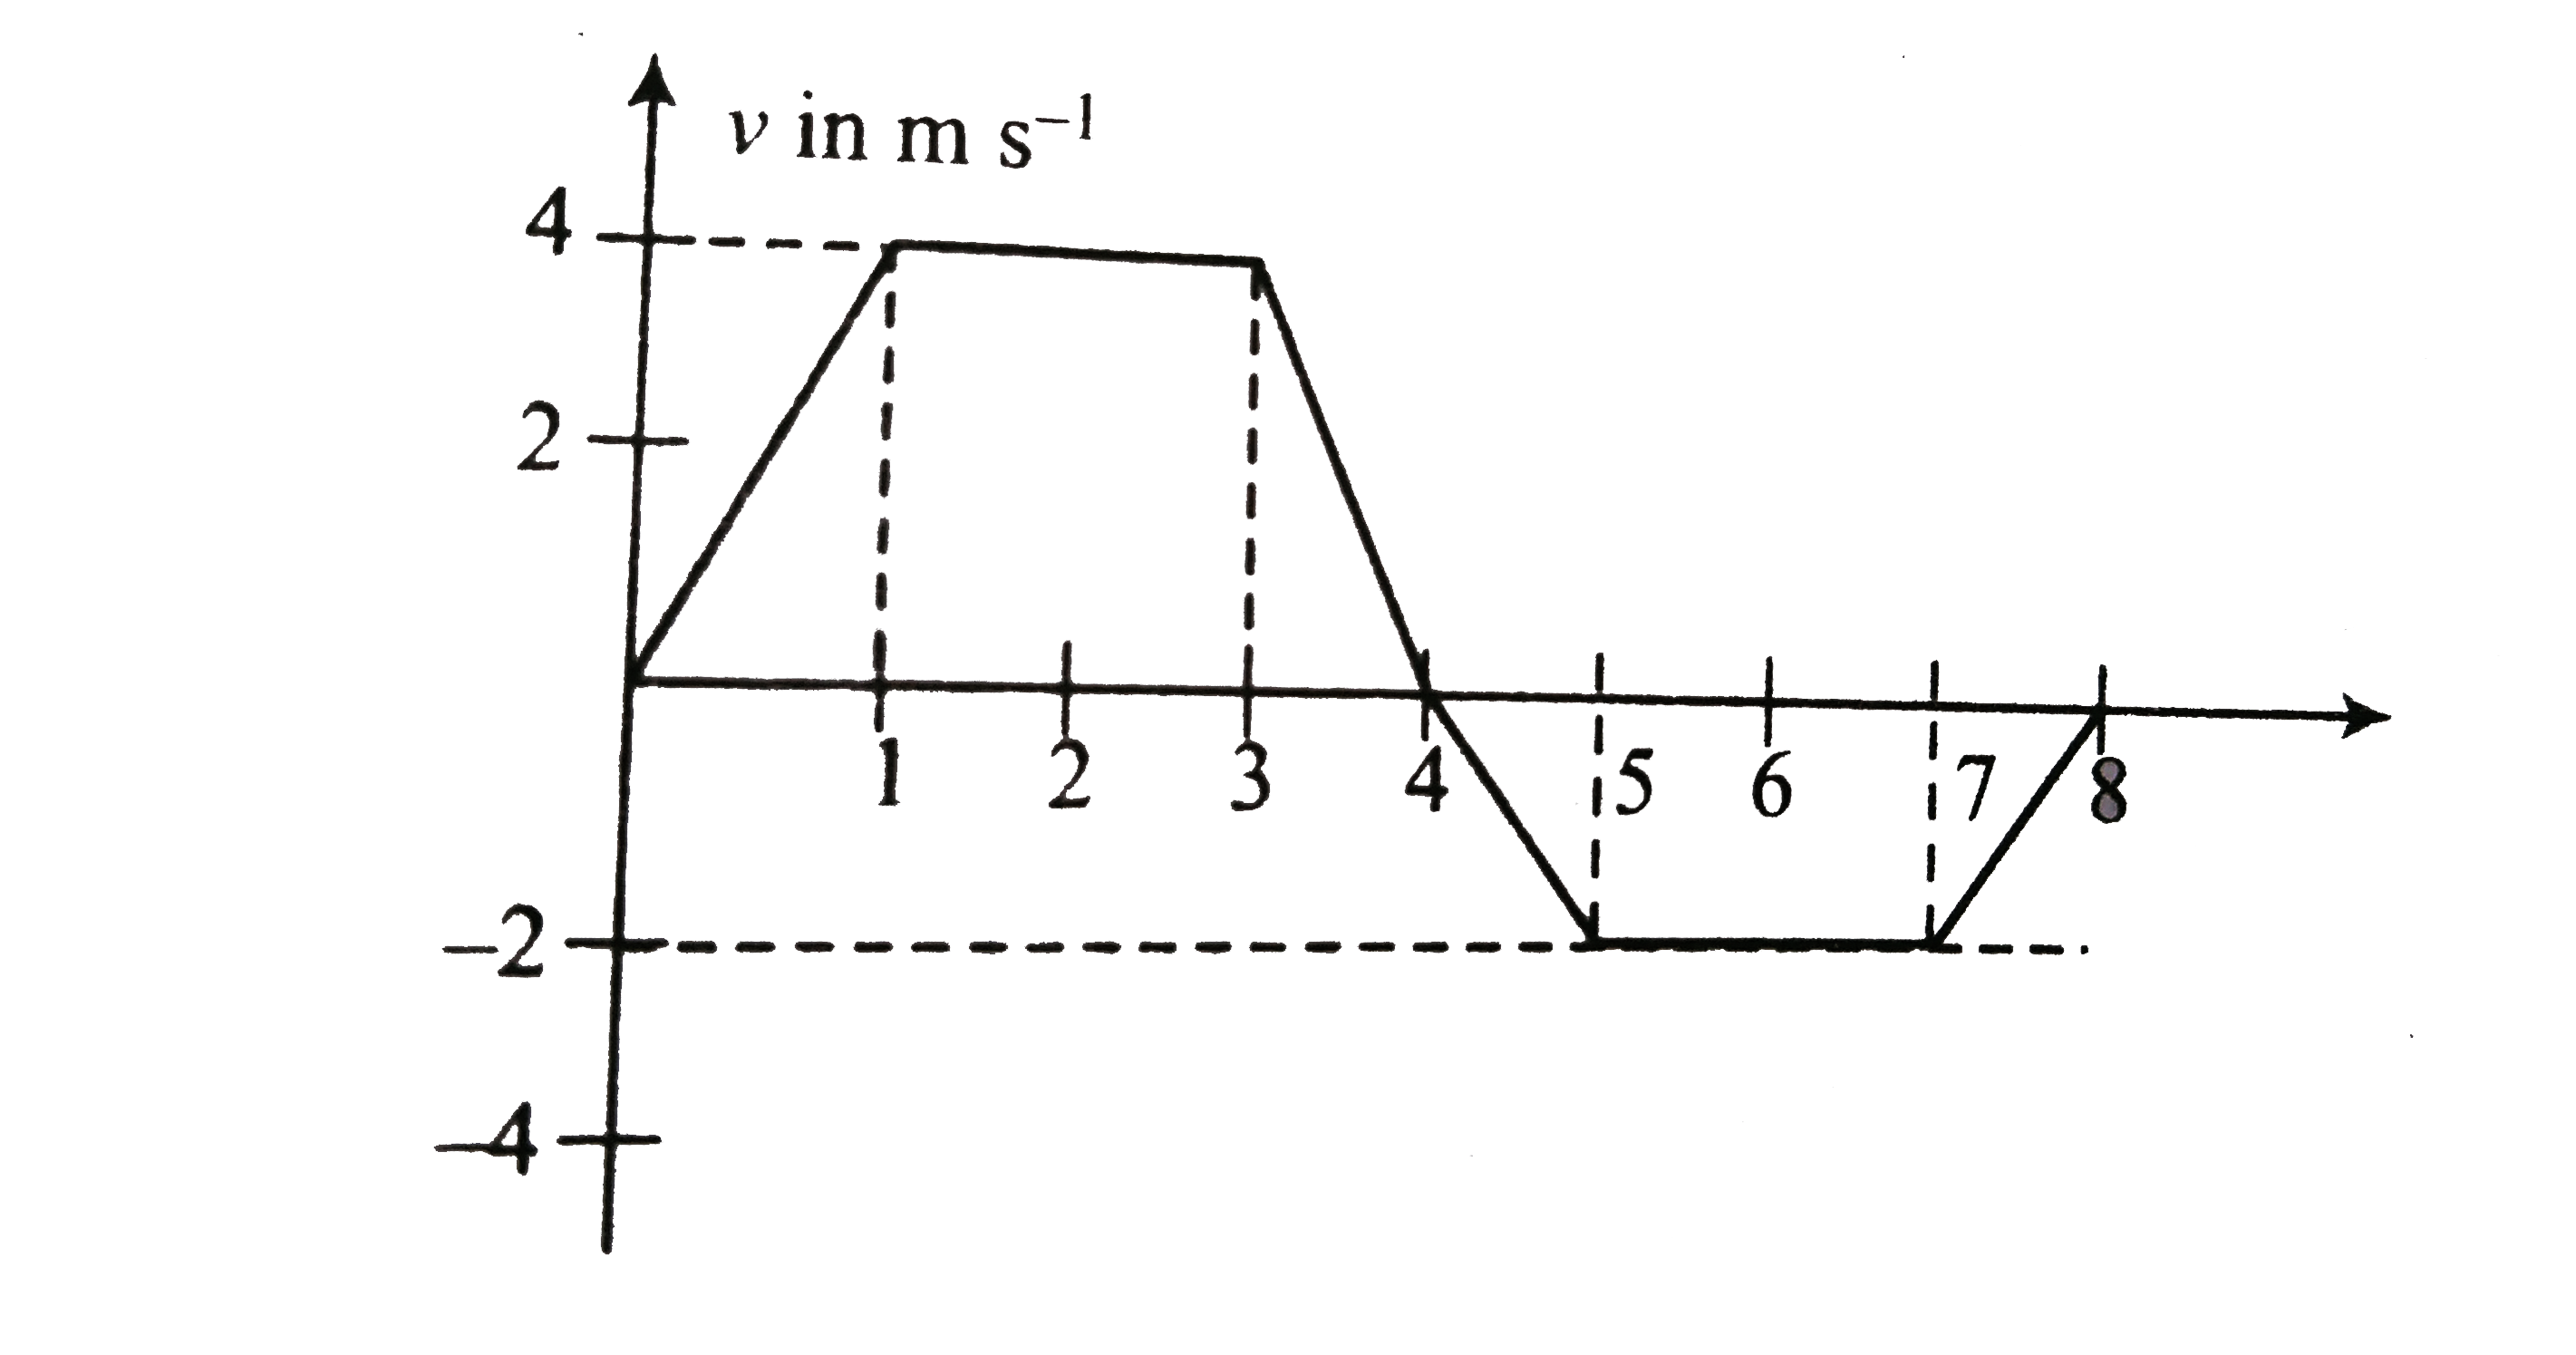
View SolutionThe velocity-time graph of a particle in straight line motion is veloity-time graph of a particle in straight line motion is shown in. The particle starts its motion from origin.
 .
.
Find the average acceleration from 2s to 6s.
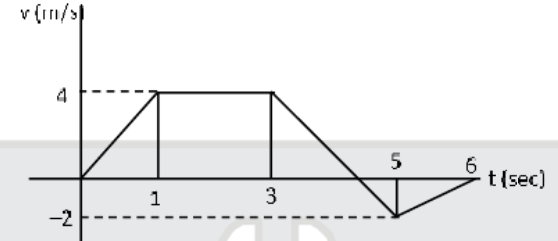
View Solutionvelocity time graph of a particle is shown in figure. Find displacement of the particle.
View SolutionThe x-t graph of a particle moving along a straight line is shown in figure
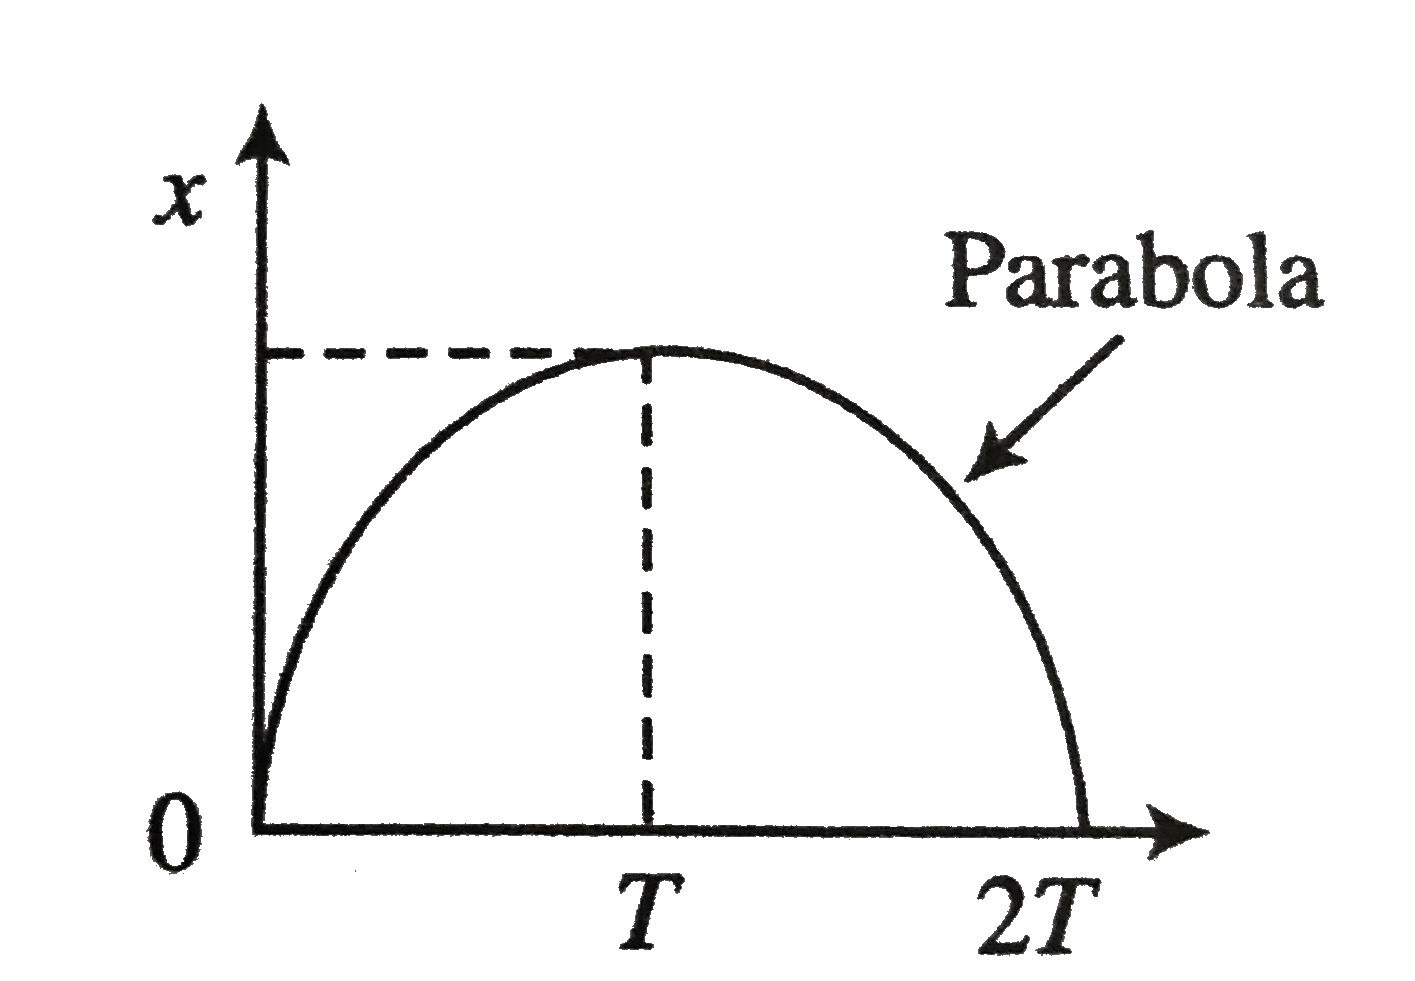
The speed-time graph of the particle is correctly shown by
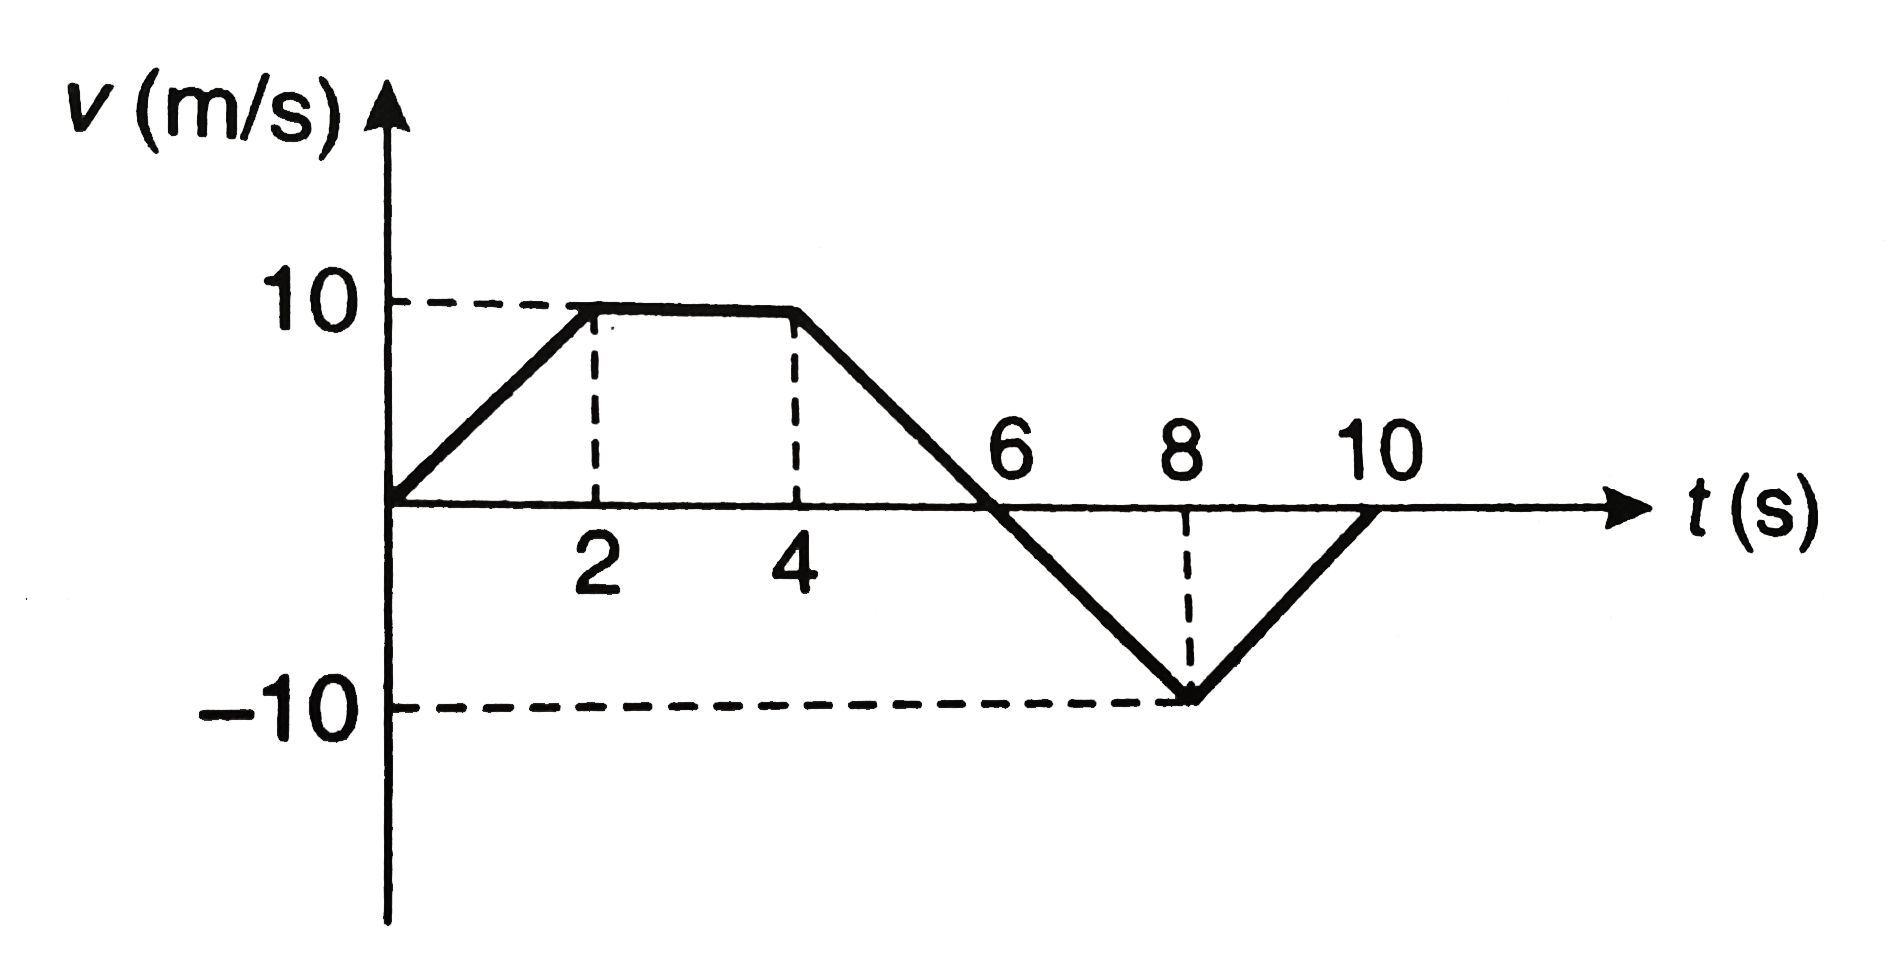
View SolutionVelocity-time graph of a particle moving in a straight line is shown in figure. At time t=0,s=−10m. Plot corresponding a-t and s-t graphs.
View Solution

