A graph is plotted between PVm along Y-axis and P along X-axis, where Vm is the molar volume of a real gas. Find the intercept along Y-axis.
(RT)−1
RT
(RT)2
1
The correct Answer is:B
Step by step video & image solution for A graph is plotted between PV_(m) along Y-axis and P along X-axis, where V_(m) is the molar volume of a real gas. Find the intercept along Y-axis. by Chemistry experts to help you in doubts & scoring excellent marks in Class 12 exams.
Updated on:21/07/2023Topper's Solved these Questions
- STATES OF MATTERBOOK - VMC MODULES ENGLISHCHAPTER - STATES OF MATTEREXERCISE - IMPECCABLE
50 Videos
- STATES OF MATTERBOOK - VMC MODULES ENGLISHCHAPTER - STATES OF MATTEREXERCISE - ENABLE
50 Videos
- SOME BASIC CONCEPTS OF CHEMISTRYBOOK - VMC MODULES ENGLISHCHAPTER - SOME BASIC CONCEPTS OF CHEMISTRYEXERCISE - IN - CHAPTER EXERCISE - H
8 Videos
- STATES OF MATTERBOOK - VMC MODULES ENGLISHCHAPTER - STATES OF MATTEREXERCISE - IN-CHAPTER EXERCISE-I
10 Videos
Similar Questions
A graph is plotted between PVm along Y-axis and P along X-axis whre Vm is the molar volume of a real gas Find the intercept along Y-axis .
View SolutionA graph is plotted by taking pressure along y-axis and centigrade temperature along X-axis for an ideal gas at constant volume. x intercept of the graph is
View SolutionA graph is plotted with PV/T on y-axis and mass of the gas along x-axis for different gases. The graph is
View SolutionIf a graph is plotted by taking spectral emissive power along y-axis and wavelength along X-axis then the area below the graph above wavelength axis is
View SolutionBy plotting log x/m on y-axis and log P on x-axis we s hould get
View Solutionif we move along y-axis then find the value of abscissa.
View SolutionA graph is drawn with 1u along x-axis and 1v along the y-axis. If the intercept on the x-axis is 0.5m−1, the focal length of the mirror is (in meter).
View SolutionDraw the graph of straight line y=−2x+3 use your graph of find :
the intercept on y-axis
View Solutiona graph between prssure P (along y-axis) and absolute temperature, T(along x-axis) for equal moles of two gases has been drawn . Given that volume of second gas is more than volume of first gas. Which of the following statement is correct?
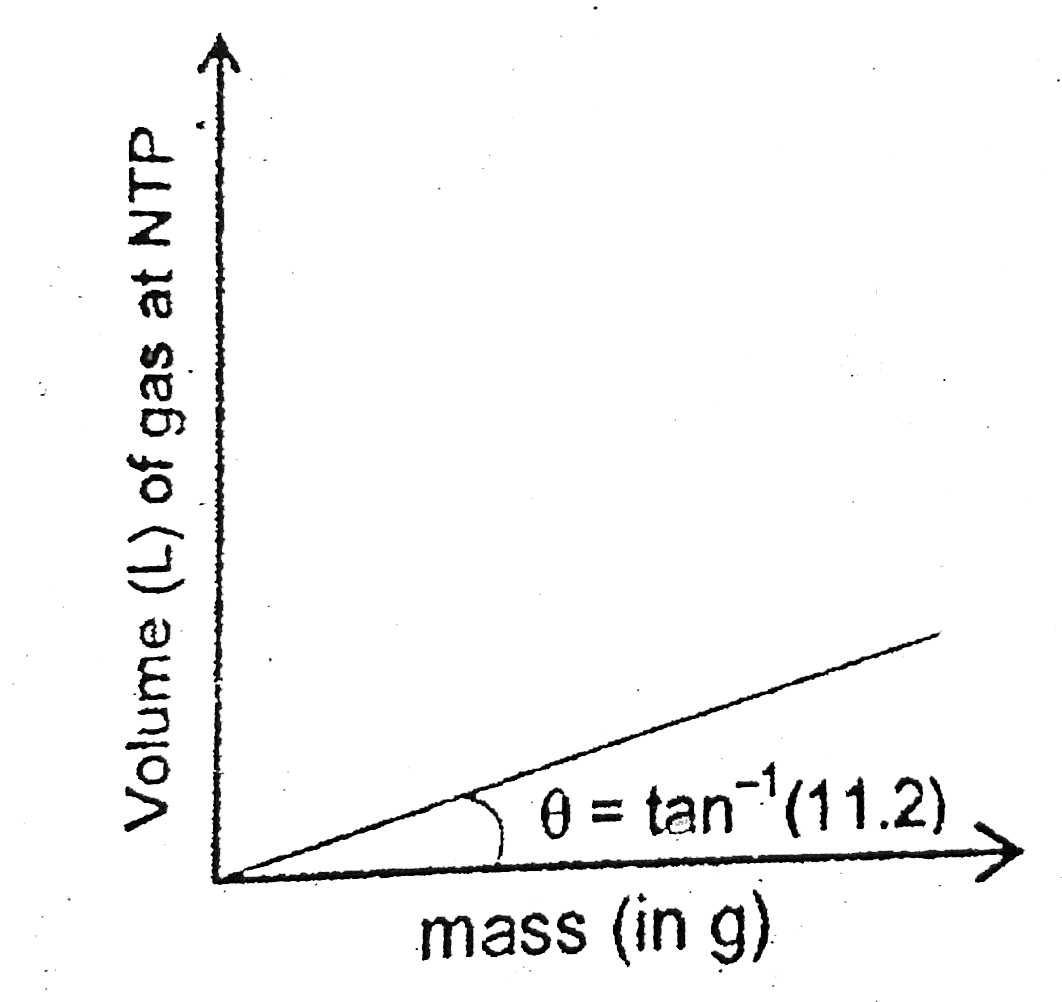
View SolutionA graph is plotted for gas 'C' , by putting its weight (in gm) on X-axis and the Volume (L) of gas at NTP on Y-axis. Select the correct statement :

View Solution
