The diagram shows a P - V graph of a thermodynamic behaviour of an ideal gas. Find out from this graph.
Work done in process A→B,B→C,C→D and D→A.
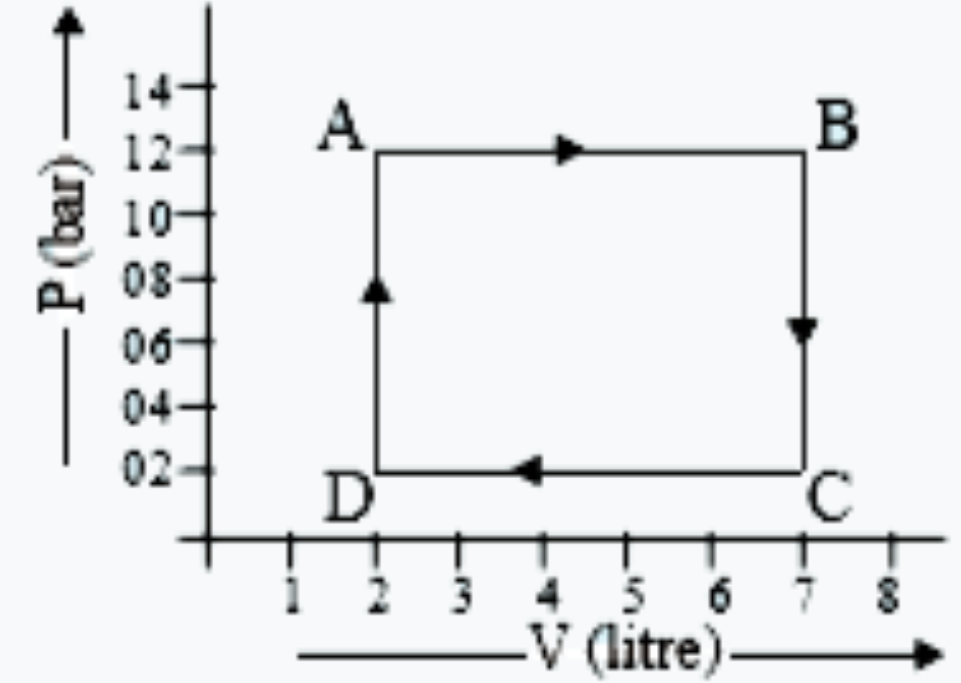
Process A→B.
The process is expansion, hence work is done by the gas.
Here, P = 12 bar =12×105Nm2 or (Pa)
ΔV=7−2=5 litre =5×10⁻³m3
∴W=−PΔV=−12×105×5×10−3=−6000J
negative sign shows that work is done by gas.
Process B→C.
Here, ΔV=0 therefore W = 0.
Process C→D
The process is contraction, hence work is done on system.
Here, P = 2 bar =2×10⁵Nm−2,
ΔV=2−7=−5 litre =−5×10⁻³m3.
∴W=−PΔV=−2×10⁵×−5×10−3=+1000J.
positive sign shows that work is done on gas.
Process D→A.
Here, ΔV=0, therefore, W = 0.
Topper's Solved these Questions
- CHEMICAL THERMODYNAMICS BOOK - VMC MODULES ENGLISHCHAPTER - CHEMICAL THERMODYNAMICS EXERCISE - SOLVED EXAMPLES
19 Videos
- CHEMICAL THERMODYNAMICS BOOK - VMC MODULES ENGLISHCHAPTER - CHEMICAL THERMODYNAMICS EXERCISE - PRACTICE EXERCISE
22 Videos
- CHEMICAL KINETICS BOOK - VMC MODULES ENGLISHCHAPTER - CHEMICAL KINETICS EXERCISE - JEE Advanced (Archive)
52 Videos
- CLASSIFICATION OF ELEMENTS AND PERIODICITY IN PROPERTIES BOOK - VMC MODULES ENGLISHCHAPTER - CLASSIFICATION OF ELEMENTS AND PERIODICITY IN PROPERTIES EXERCISE - JEE ADVANCE (ARCHIVE)
30 Videos
Similar Questions
The figure shows a P.V graph of the thermodynamic behavious of an ideal gas. Find out form this graph (i) work done by the gas in the process A→B,B→C,C→DandD→A. (ii) work done by the gas in complete cycle A→B→C→D→A.
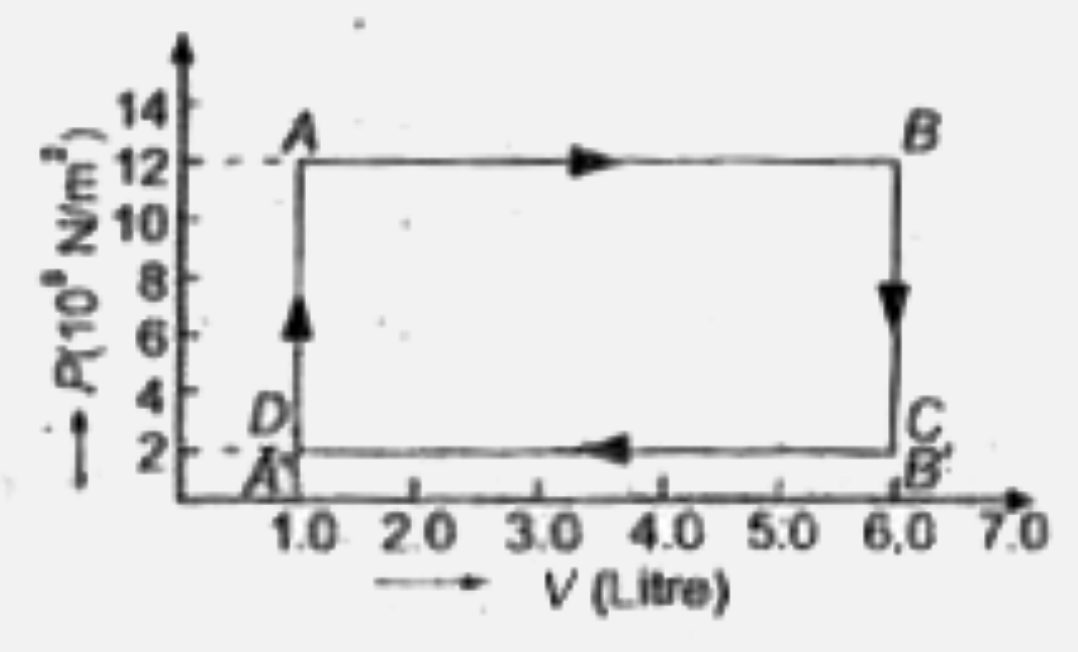
View SolutionP−V diagram of an ideal gas is as shown in figure. Work done by the gas in process ABCD is
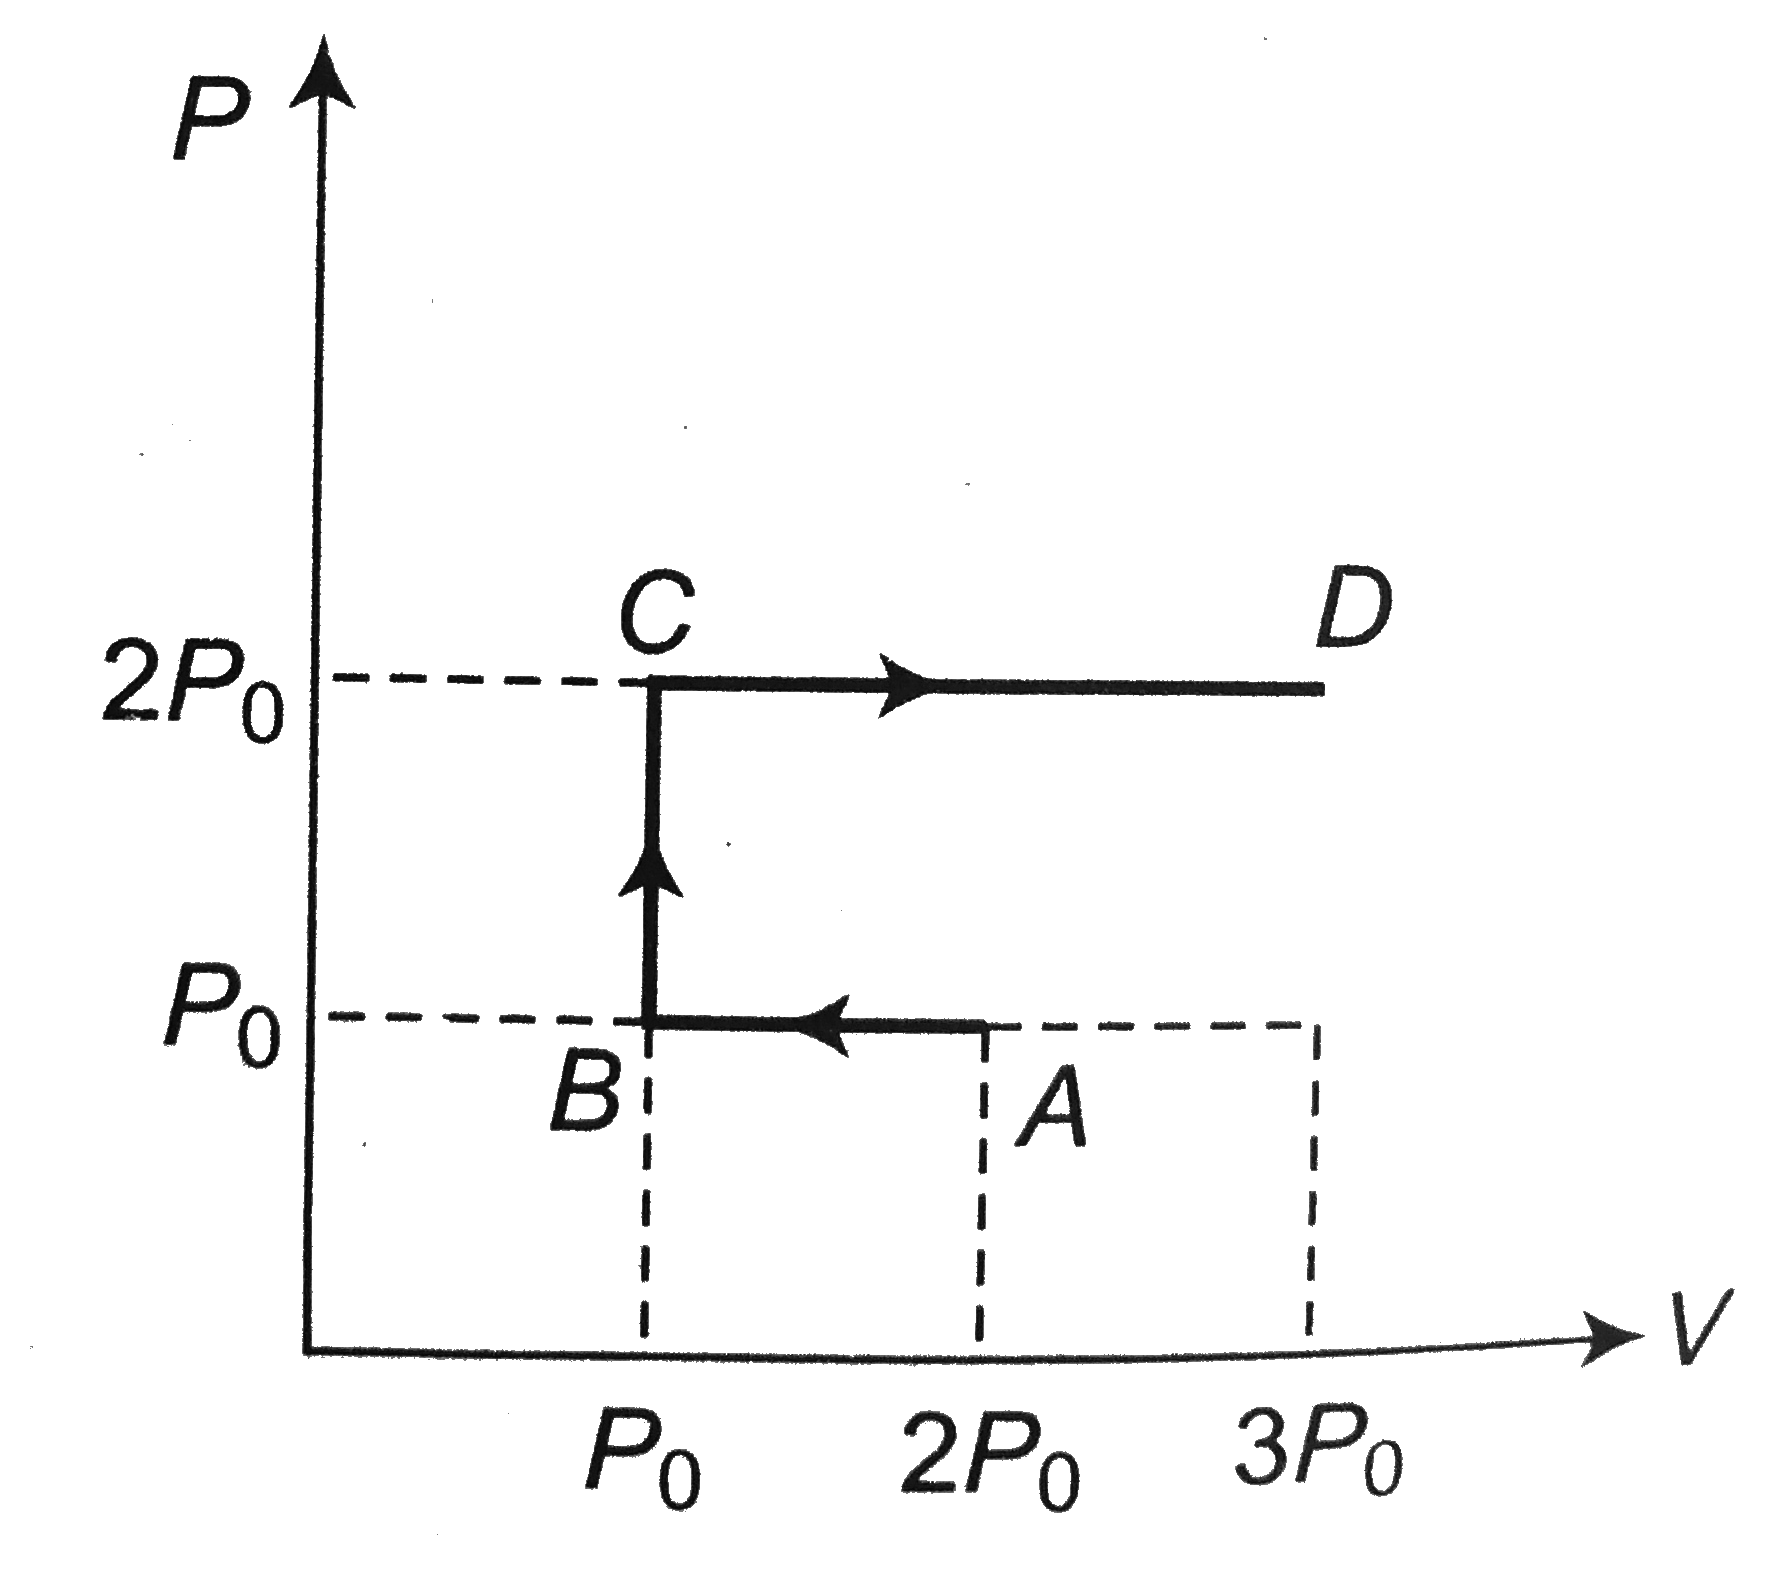
View Solution
Knowledge Check
The cyclic process for 1 mole of an ideal gas is shown in the V-T diagram. The work done in AB, BC and CA respectively is
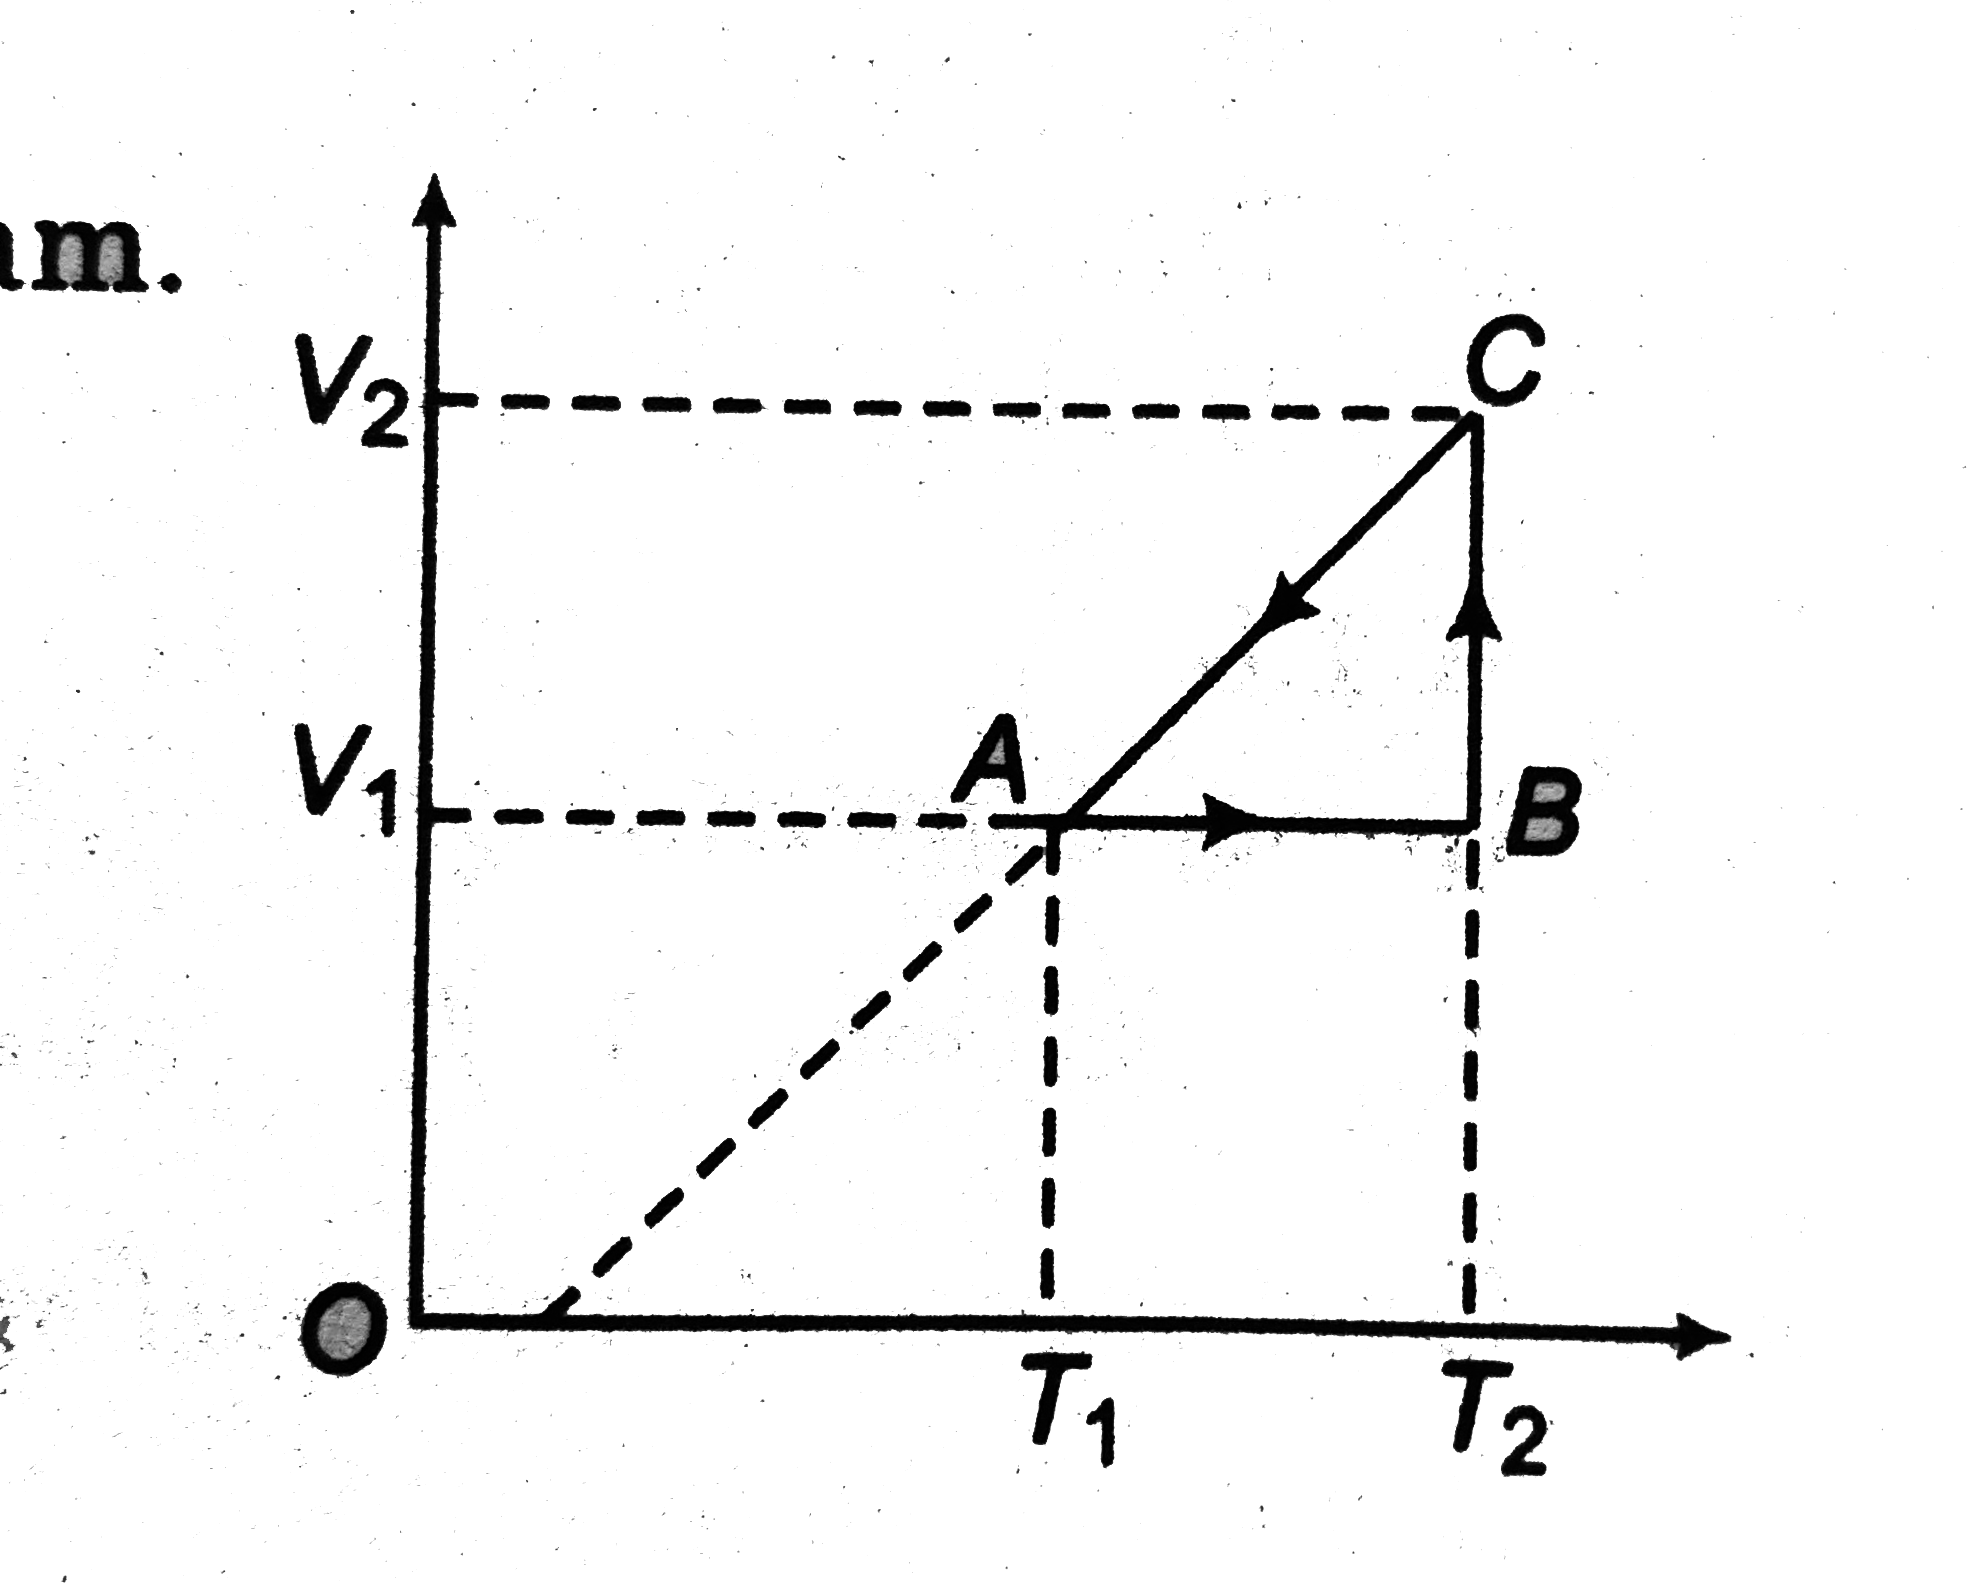 A0,RT1Ln(V1V2),R(T1−T2)BR,(T1−T2)R,RT1In(V1V2)C0,RT2ln(V2V1),RT1V1(V1−V2)D0,RT2ln(V1)V2,R(T1−T2)
P-V diagram of an ideal gas is as shown in figure. Work done by the gas in the process ABCD is

View SolutionP – V graph of an ideal gas is as shown in the diagram . Work done by the gas in the process ABCD is
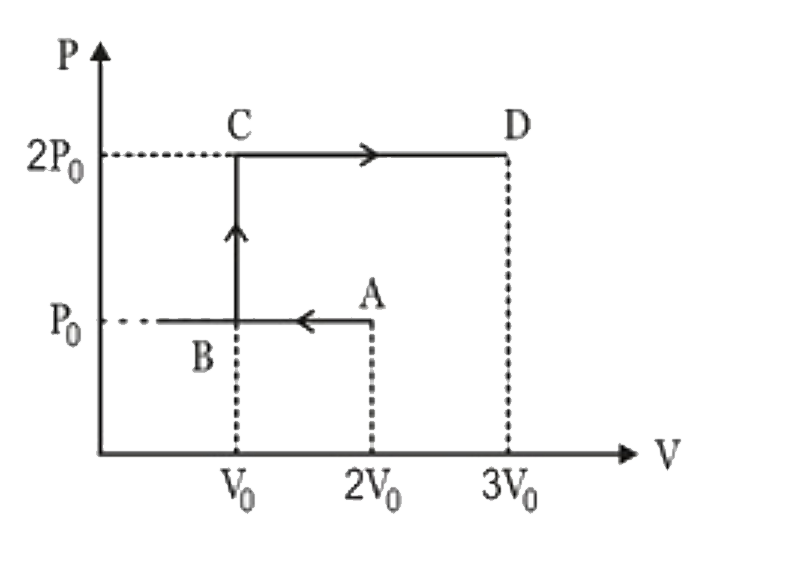
View SolutionIn the P-V diagram shown in figure ABC is a semicircle. The work done in the process A→B→C
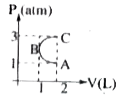
View SolutionAn ideal monoatomic gas follows a thermodynamic process as shown in pressure-volume (P-V) plot. The work done in process AB is

View Solutiongraph of an ideal gas is as shown in figure.
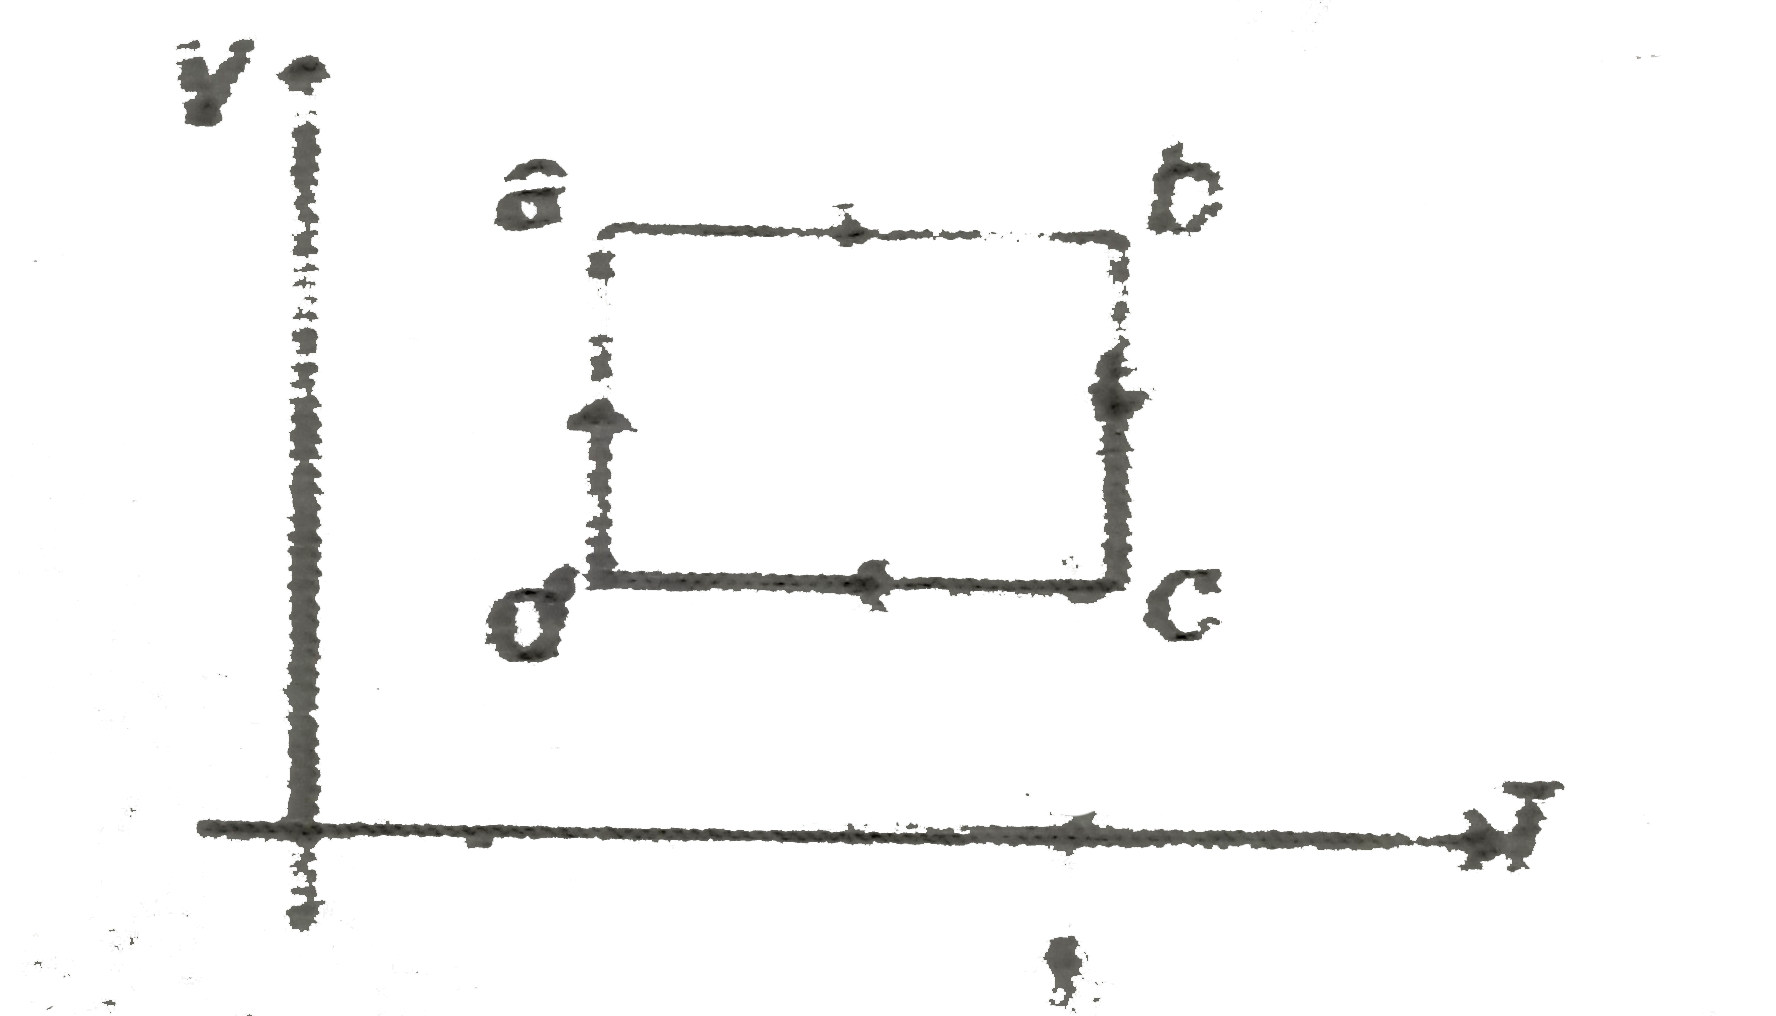
Work done by the gas in complete cyclic process about is
View SolutionThe cyclic process for 1 mole of an ideal gas is shown in the V-T diagram. The work done in AB, BC and CA respectively is

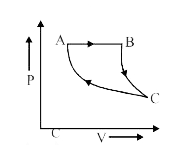
View SolutionFor a given thermodynamic process, the P – V diagram is as shown below:
Which of the following is the V – T diagram for the process?
A→B: isobaric
B→C: adiabatic
C→A : isothermal
View Solution
