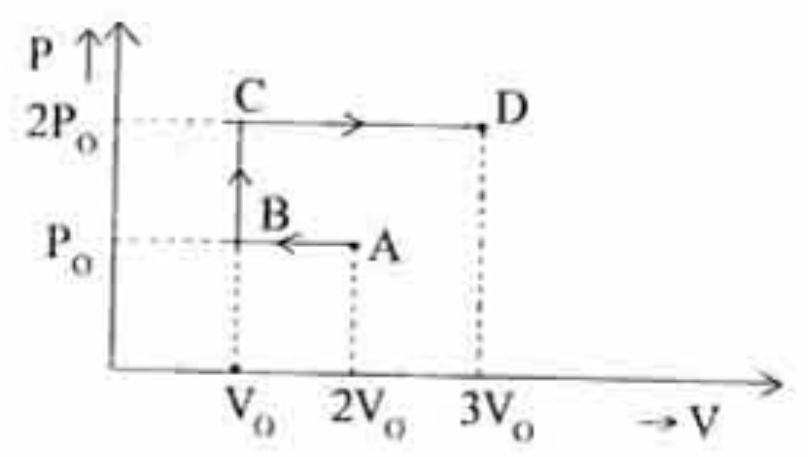
The figure shows a P.V graph of the thermodynamic behavious of an ideal gas. Find out form this graph (i) work done by the gas in the process A→B,B→C,C→DandD→A. (ii) work done by the gas in complete cycle A→B→C→D→A.
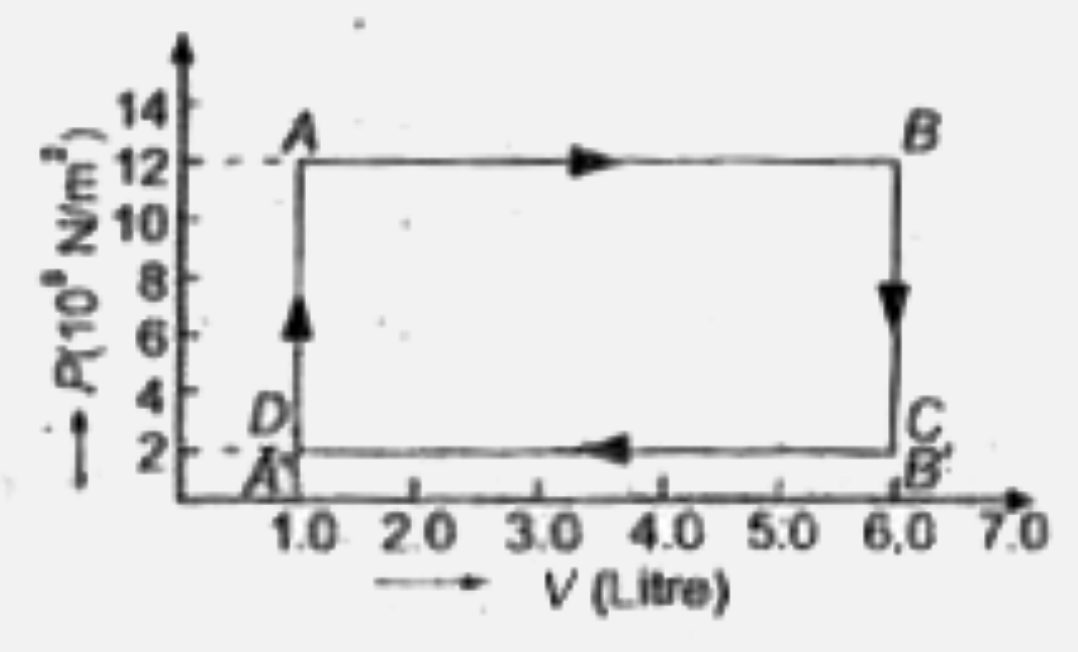
(i) The work done in a thermodynamic process is equal to the area enclosed between the P-V curve and the volume -exis.
Work done by the gas in the process A→B is
W1= area ABB A. =AB×A.A
=(6.0=1.0)litre ×(12×105)N/m2
=5.0×10⁻³m3×(12×105)N/m2
=6000N−m=6000 joule.
Work done in the process B→C is zero since volume remains constant.
Work done on the gas in the process C→D is
W2 = area DCB.A.
=DC×A.D=(−5.0×10−3)×(2×105)=−1000 joule. (Negative sign is taken because volume decreases)
Work W1 is positive, while D→A is also zero, because volume remains constant.
(ii) Work W1 is positive, while W2 is negative. Hence the net work done in the whole cycle is
W=W1−W2=6000−1000=5000 joule
This net work is done by the gas.
Similar Questions
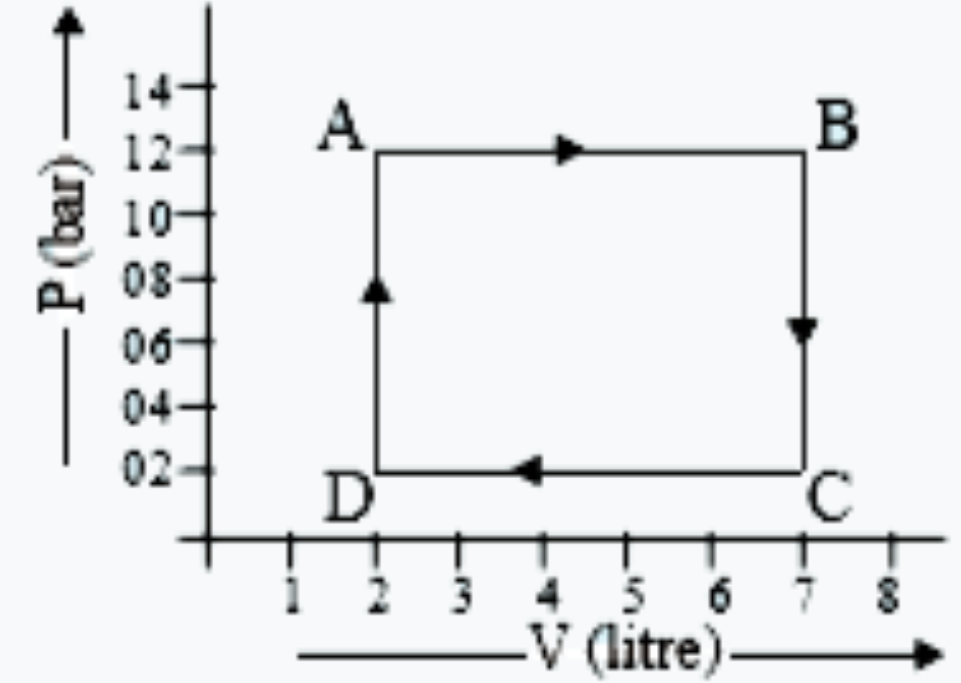
The diagram shows a P - V graph of a thermodynamic behaviour of an ideal gas. Find out from this graph.
Work done in process A→B,B→C,C→D and D→A.
View SolutionFind work done by the gas in the process shown in figure.
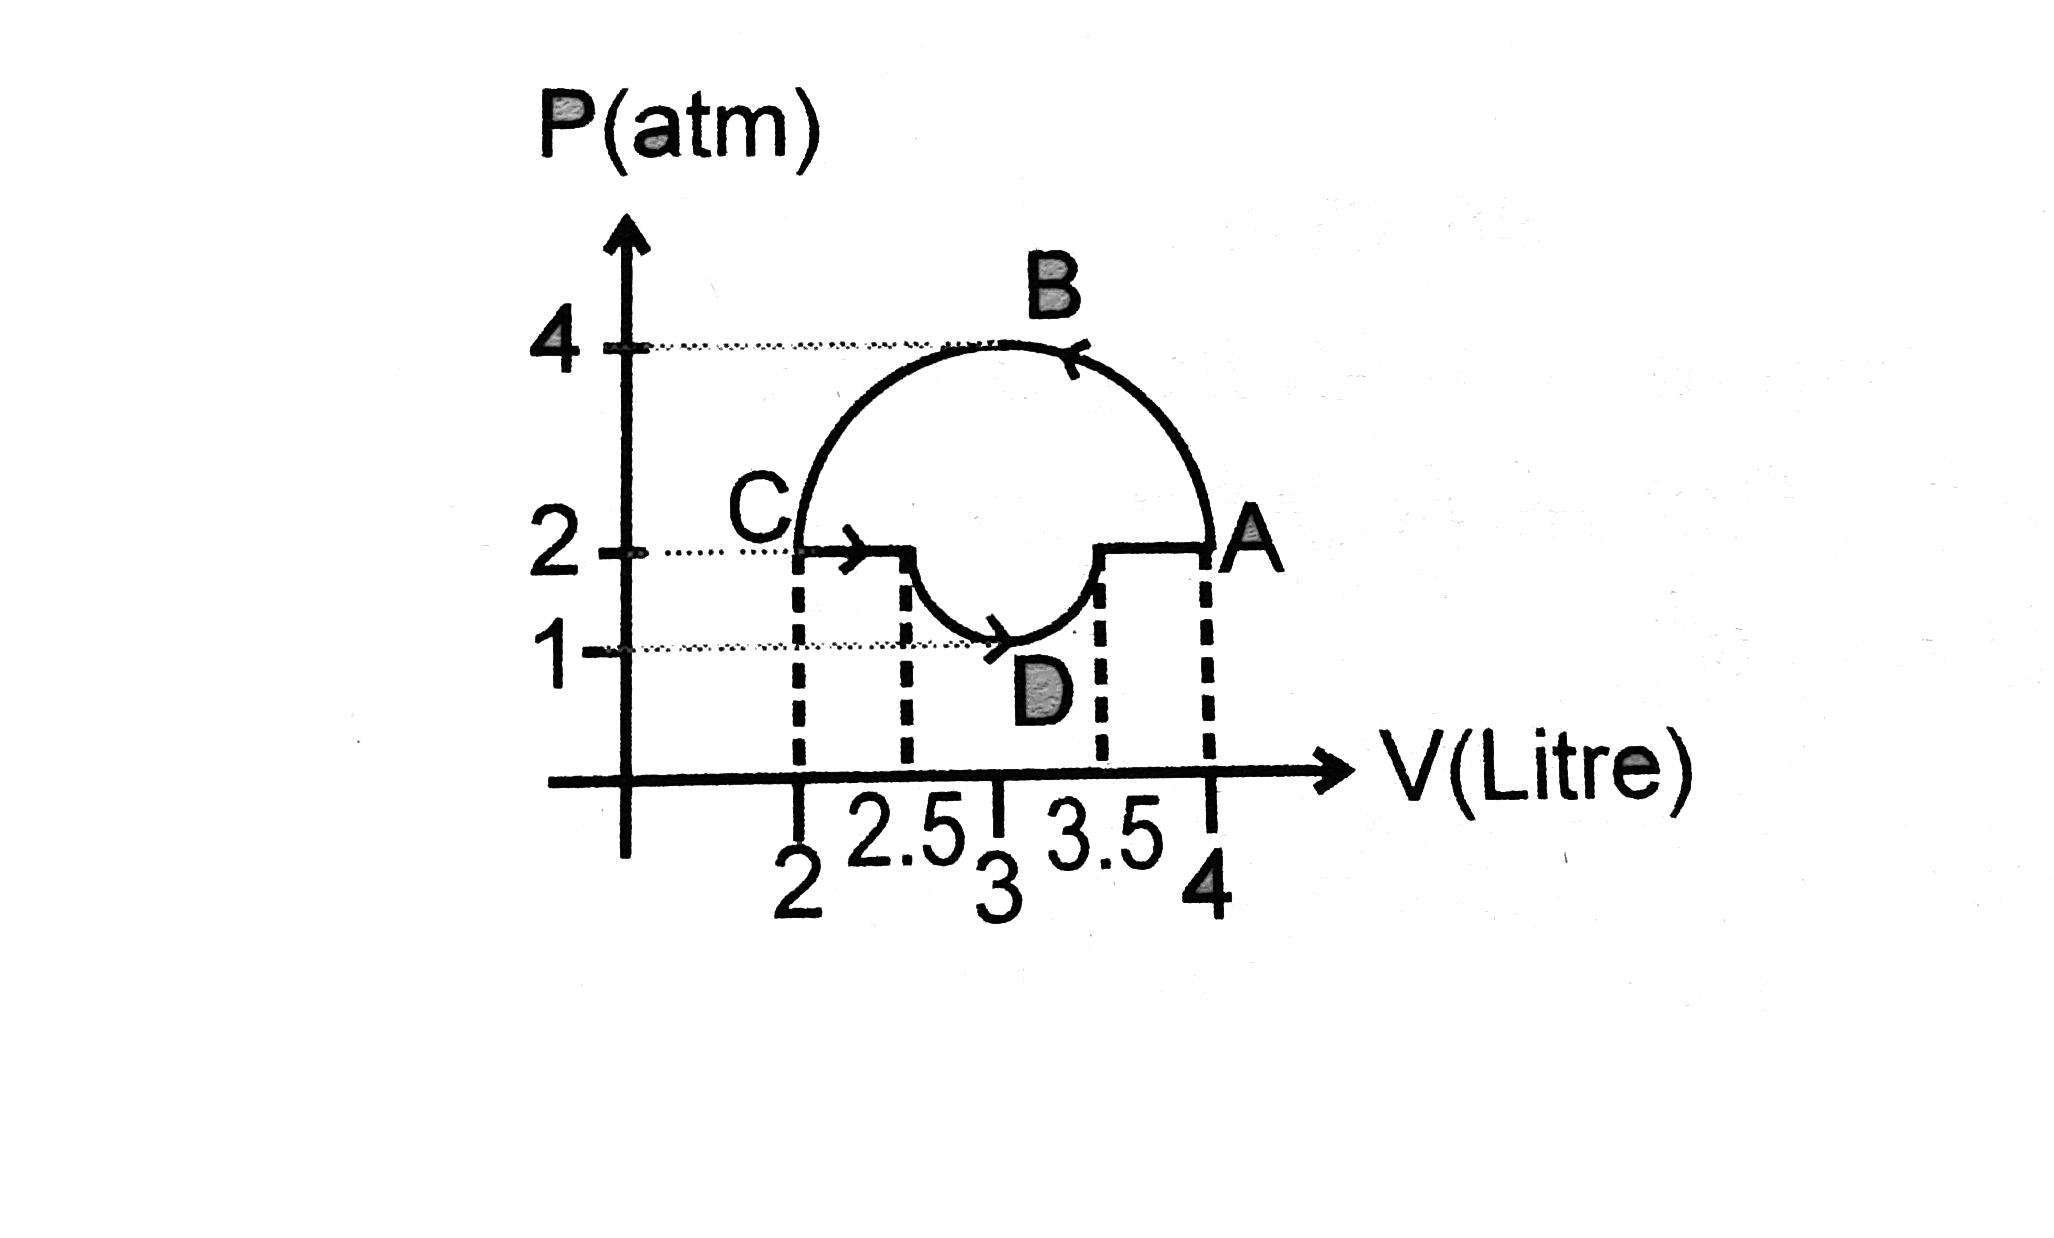
View SolutionFind work done by the gas in the process shown in figure.

View SolutionP – V graph of an ideal gas is as shown in the diagram . Work done by the gas in the process ABCD is
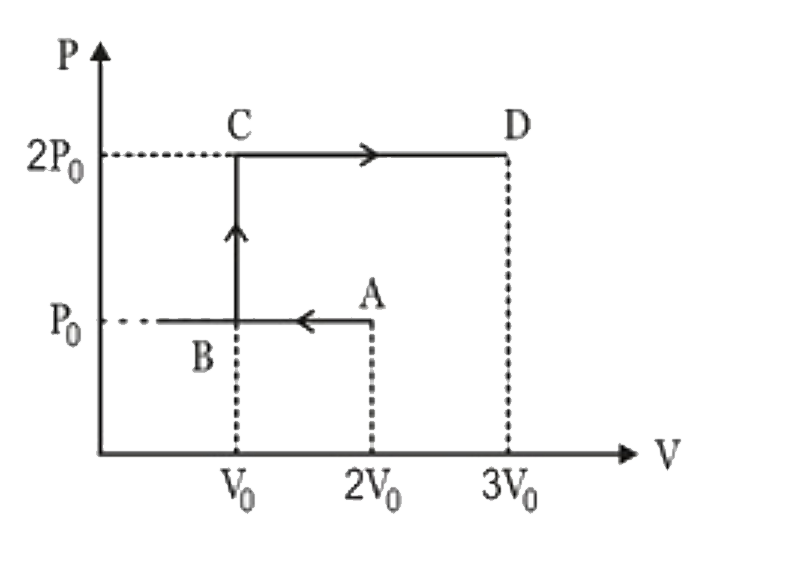
View SolutionP-V diagram of an ideal gas is as shown in figure. Work done by the gas in the process ABCD is

View SolutionThe work done by the gas in the process shown in given P-V diagram is
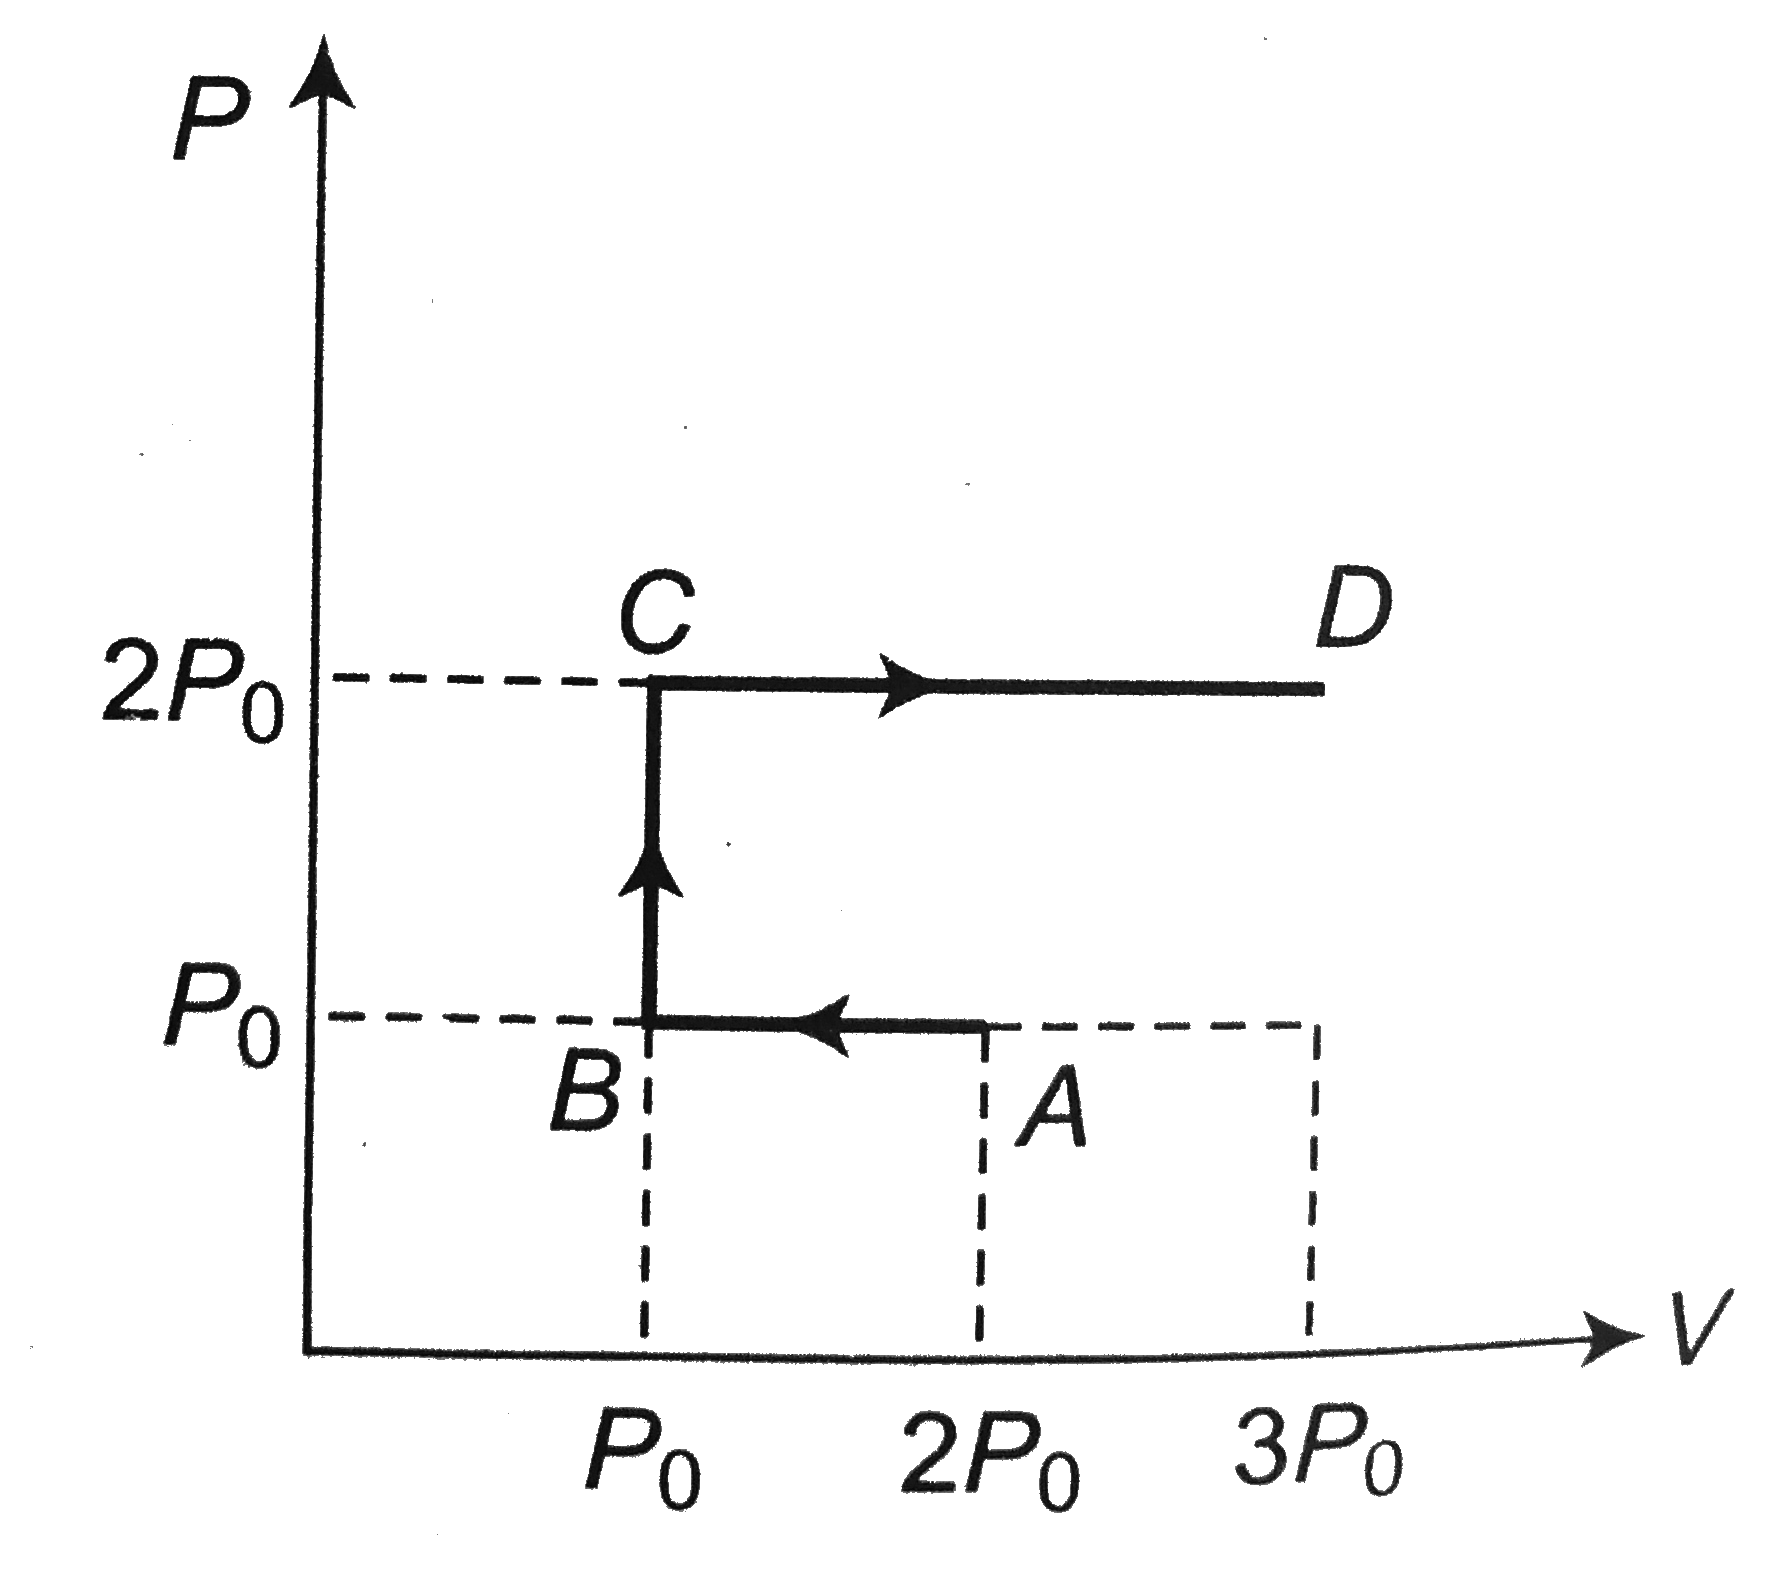
View SolutionFind work done by the gas in the process AB shown in the following figures.

View Solutiongraph of an ideal gas is as shown in figure.
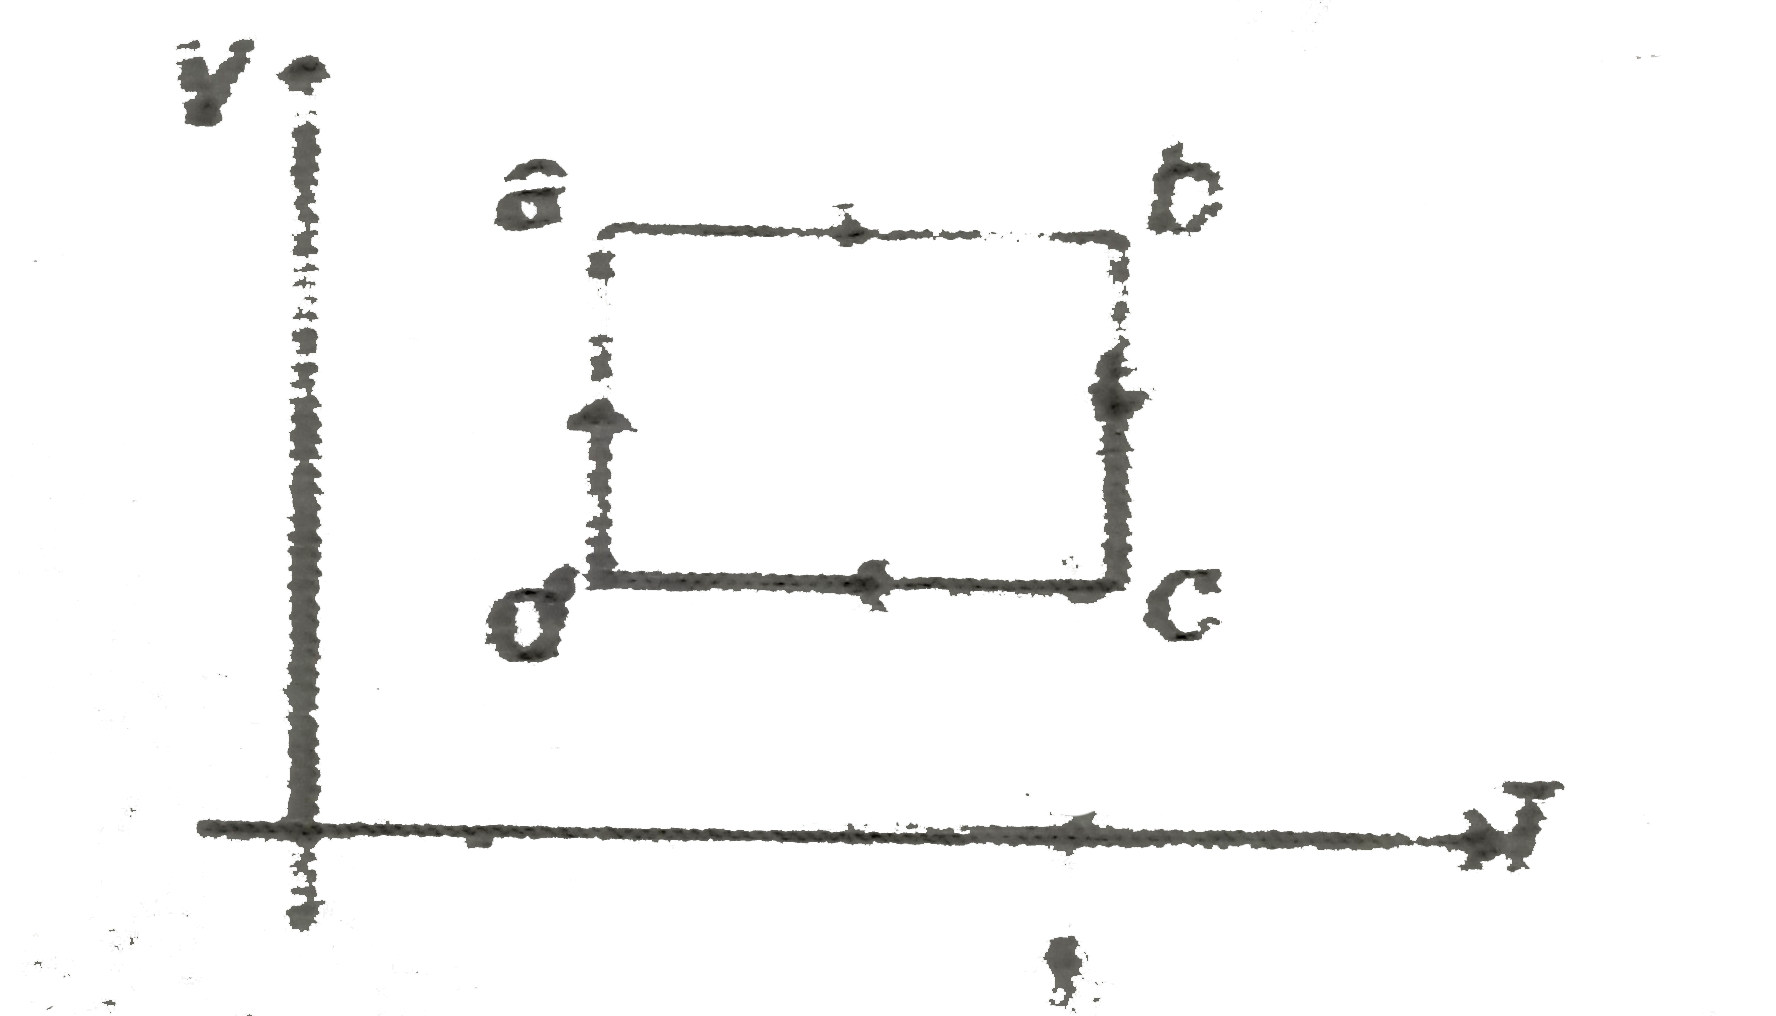
Work done by the gas in complete cyclic process about is
View SolutionP−V diagram of an ideal gas is as shown in figure. Work done by the gas in process ABCD is
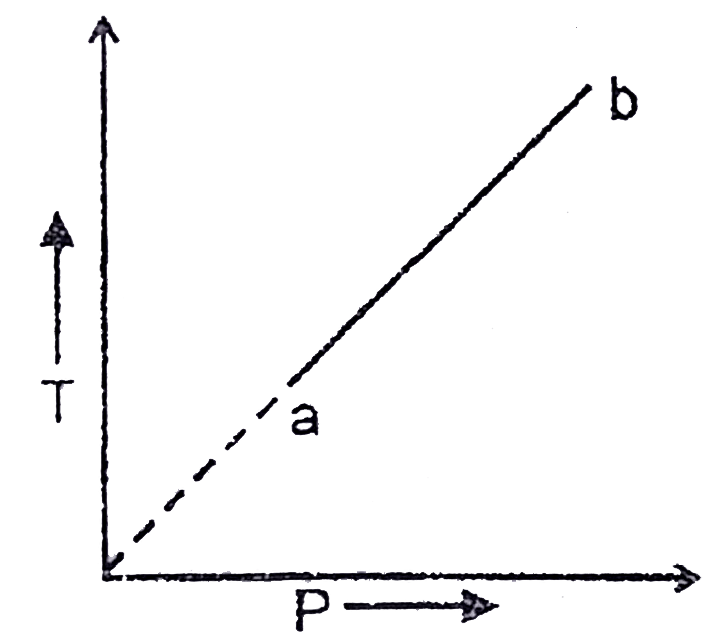
View SolutionAn ideal gas change from state a to state b as shown in Fig. what is the work done by the gas in the process?
View Solution