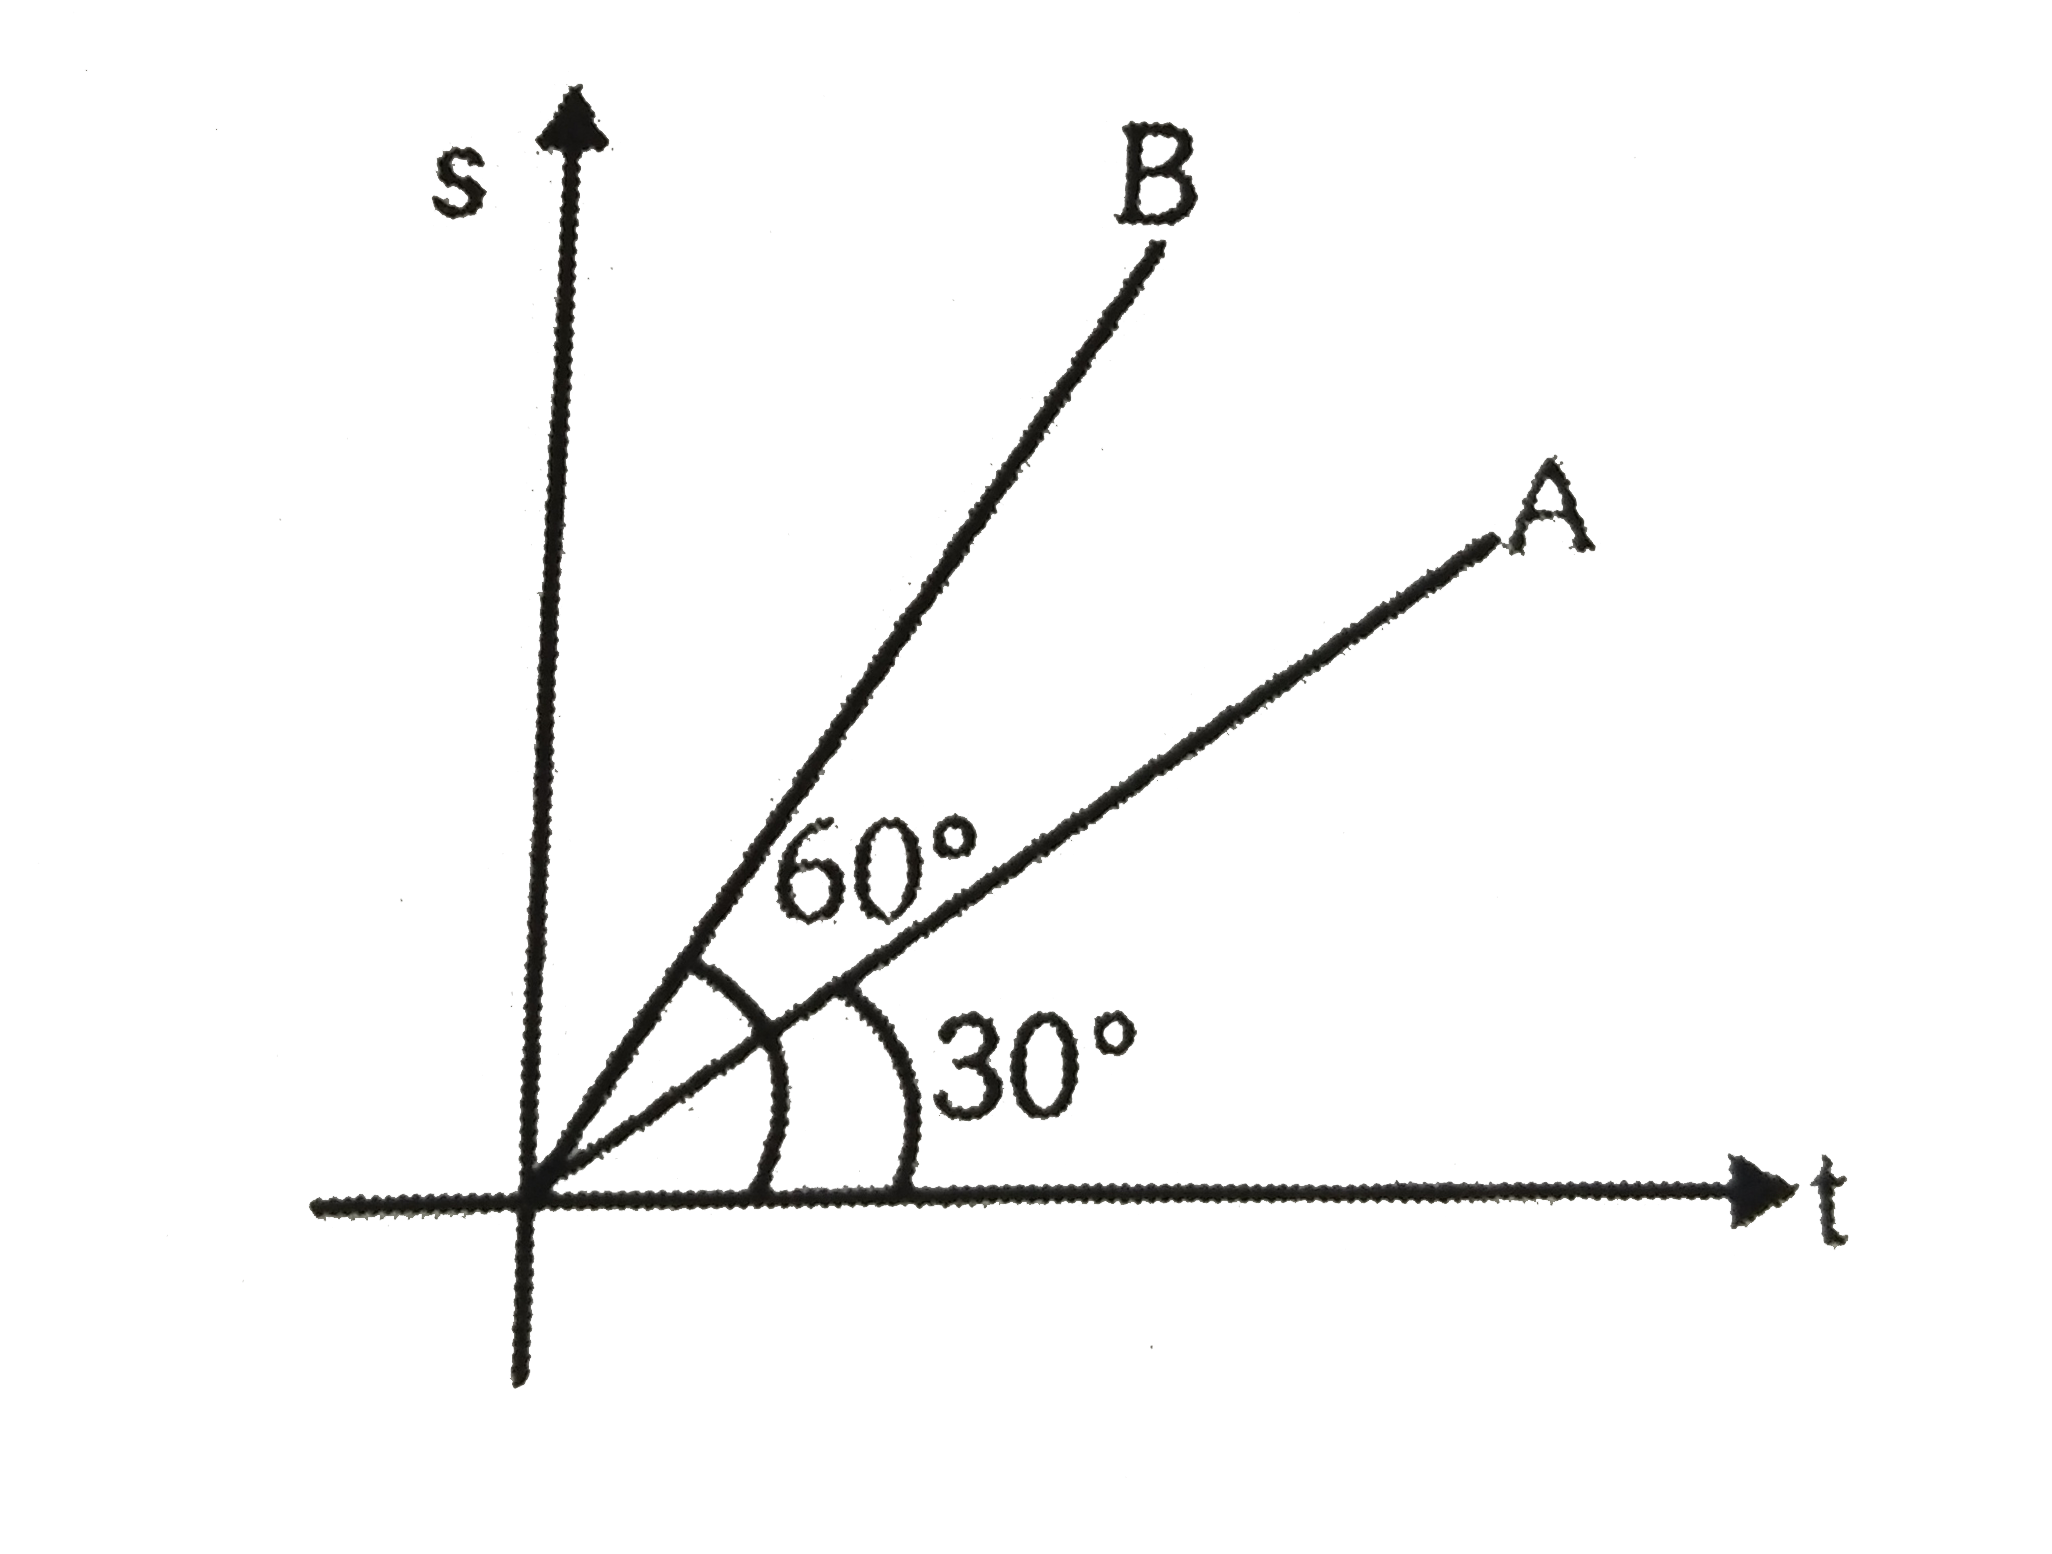
s-t graph of two particles A and B are shown in fig. Find the ratio of velocity of A to velocity of B.
Topper's Solved these Questions
- Motion in Straight Line BOOK - VMC MODULES ENGLISHCHAPTER - Motion in Straight Line EXERCISE - IN-CHAPTER EXERCISE-A
11 Videos
- Motion in Straight Line BOOK - VMC MODULES ENGLISHCHAPTER - Motion in Straight Line EXERCISE - IN-CHAPTER EXERCISE-B
10 Videos
- Motion in Straight Line BOOK - VMC MODULES ENGLISHCHAPTER - Motion in Straight Line EXERCISE - SOLVED EXAMPLES
20 Videos
- MOTION IN A STRAIGHT LINE & PLANE BOOK - VMC MODULES ENGLISHCHAPTER - MOTION IN A STRAIGHT LINE & PLANE EXERCISE - IMPECCABLE
52 Videos
- Motion in Two DimensionsBOOK - VMC MODULES ENGLISHCHAPTER - Motion in Two DimensionsEXERCISE - MCQ
2 Videos
Similar Questions
The displacement time graphs of two bodies A and B are shown in figure. The ratio of velocity of A to velocity of B,vA/vB is:

View SolutionThe displacement-time graphs of two particles P and Q are as shown in the figure. The ratio of their velocities VP and VQ will be

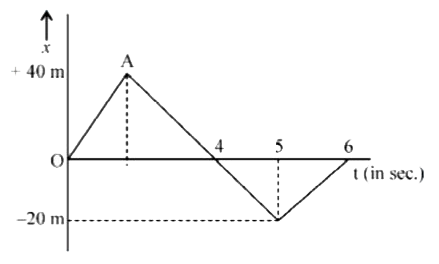
View Solutions-t graph of a particle in motion is shown in Fig. Calculate Average velocity
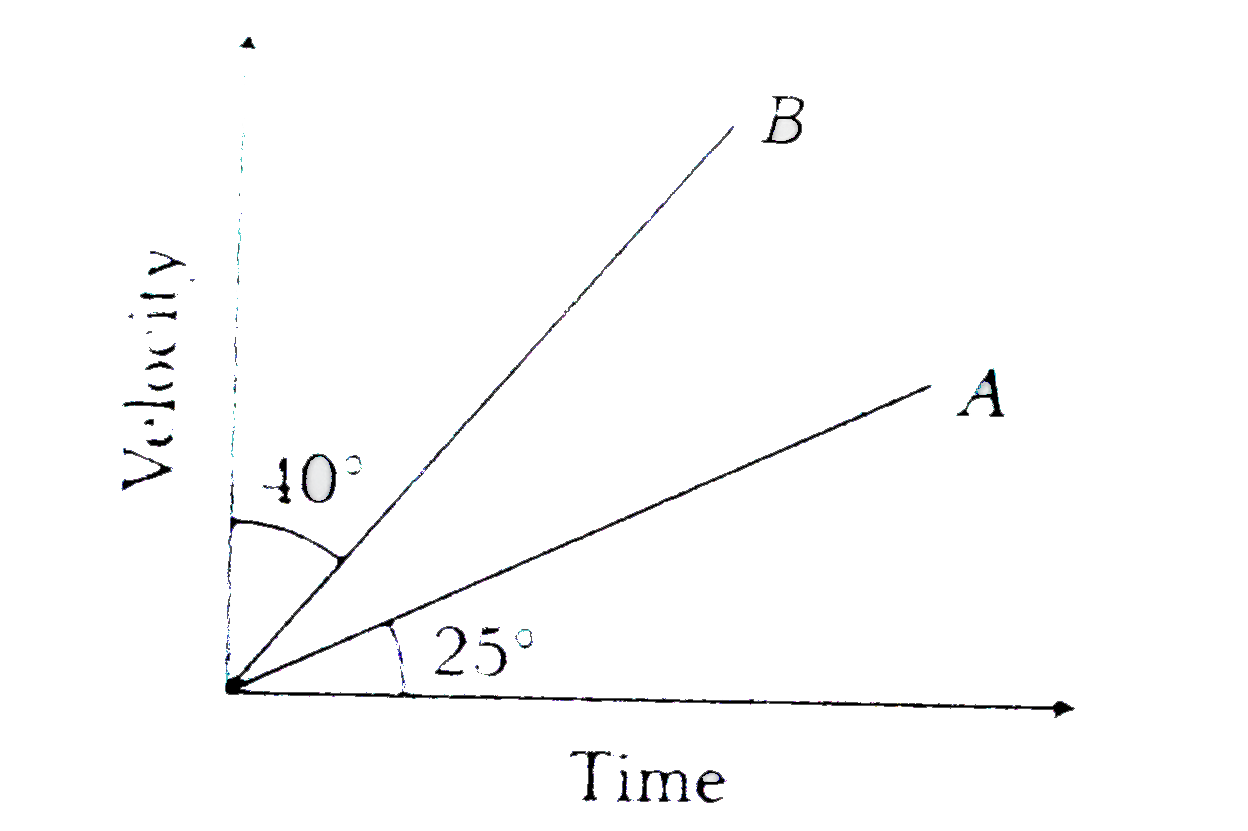
View SolutionThe velocity - time graph for two bodies A and B are shown in figure. Then, the acceleration of A and B are in the ratio
View Solutions-t graph of a particle in motion is shown in Fig. Calculate
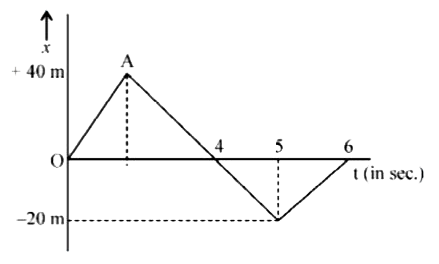
Average speed
View Solutions-t graph of a particle in motion is shown in Fig. Calculate
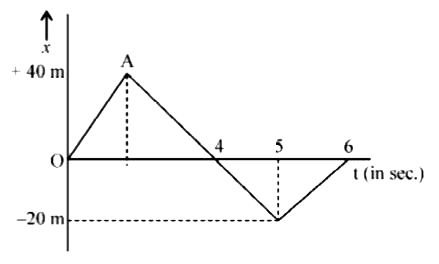
Displacement
View SolutionThe velocity − time graph of a particle is as shown in figure

View Solutionvelocity-time graph of a particle moving in a straight line is as shown in figure. At time t=0, velocity of the particle is zero. Find
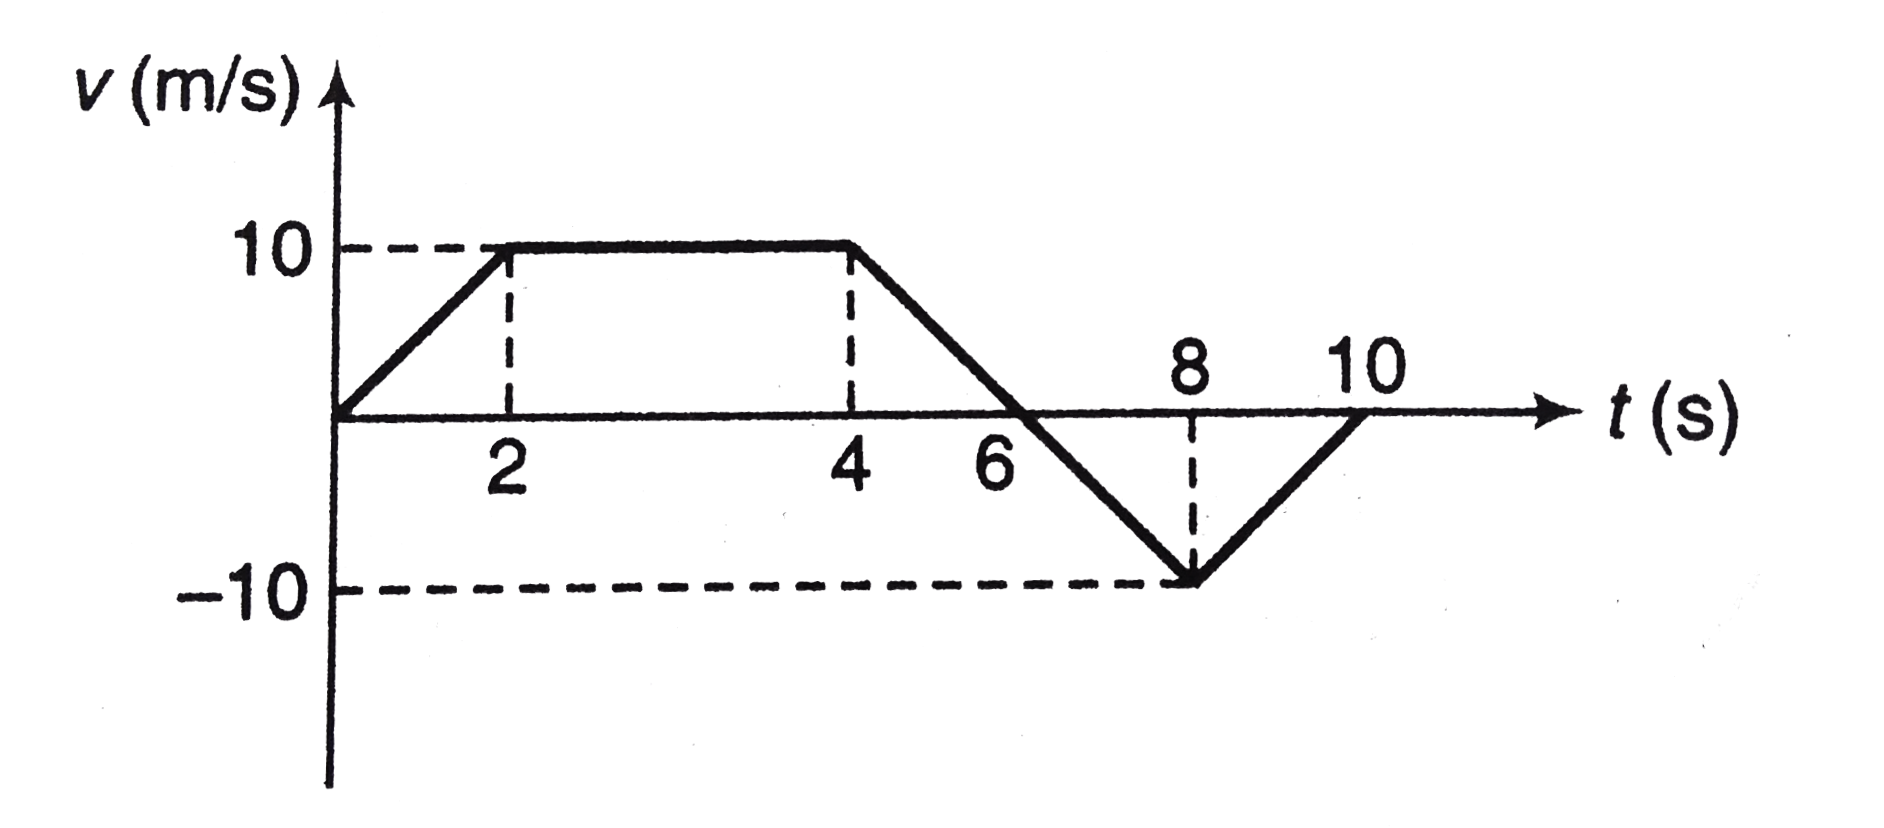
(a) average acceleration in a time interval from t=6s to t=12s,
(b) velocity of the particle at t=14s.
View Solution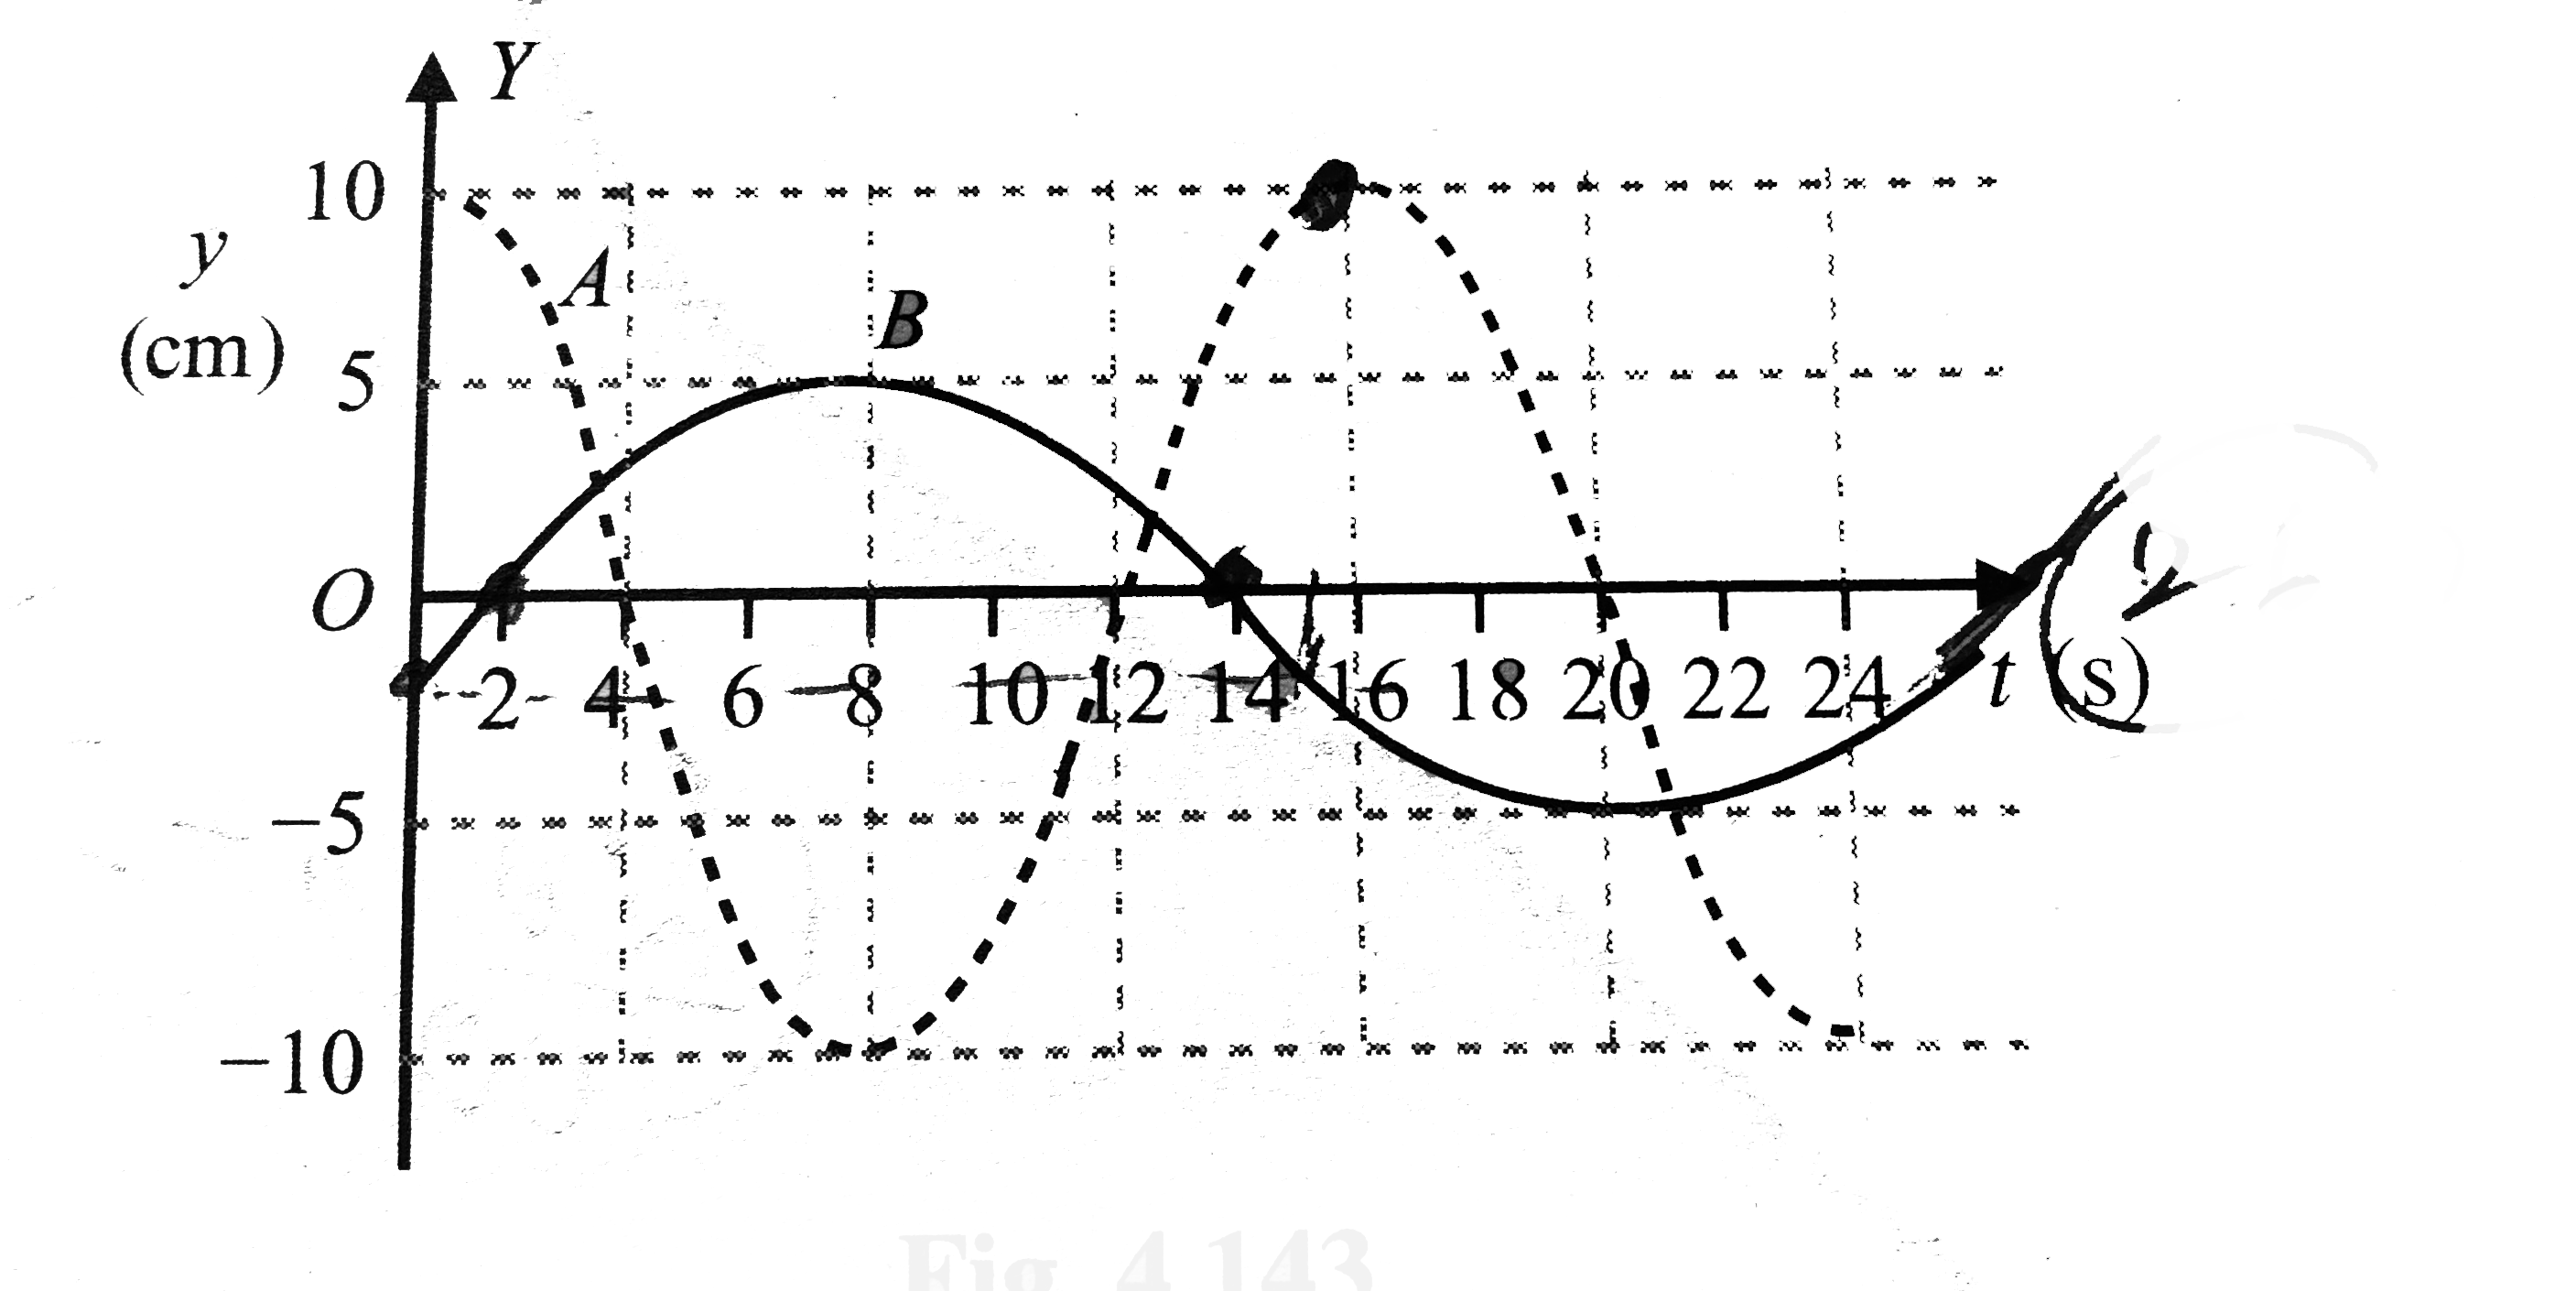
The following figure shows the displacement versus time graph for two particles A and B executing simple harmonic motions. The ratio of their maximum velocities is
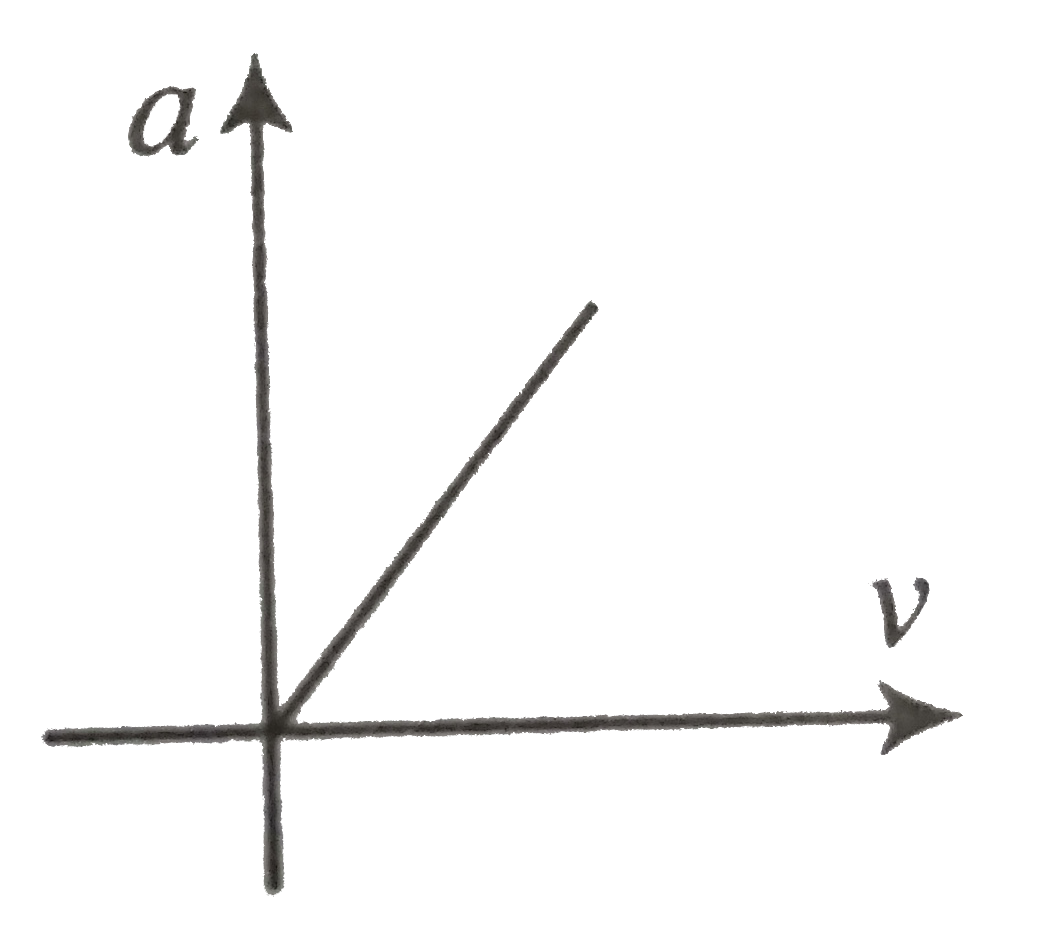
View SolutionThe acceleration - velocity graph of a particle moving in a straight line is shown in figure. Then the slope of the velocity- displacement graph
View Solution
