The curve showing the variation of pressure with temperature for a given amount of adsoption is called

adsorption isobar
adsorption isotherm
adsorption isotere
adsorption isochore
The correct Answer is:D
Step by step video & image solution for The curve showing the variation of pressure with temperature for a given amount of adsoption is called by Chemistry experts to help you in doubts & scoring excellent marks in Class 12 exams.
Updated on:21/07/2023Topper's Solved these Questions
- SURFACE CHEMISTRYBOOK - VMC MODULES ENGLISHCHAPTER - SURFACE CHEMISTRYEXERCISE - IN CHAPTER-C
6 Videos
- SURFACE CHEMISTRYBOOK - VMC MODULES ENGLISHCHAPTER - SURFACE CHEMISTRYEXERCISE - IN CHAPTER-D
9 Videos
- SURFACE CHEMISTRYBOOK - VMC MODULES ENGLISHCHAPTER - SURFACE CHEMISTRYEXERCISE - IN-CHAPTER-A
10 Videos
- STRUCTURE OF ATOMBOOK - VMC MODULES ENGLISHCHAPTER - STRUCTURE OF ATOMEXERCISE - IN-CHAPTER EXERCISE-F
7 Videos
- THE SOLID STATEBOOK - VMC MODULES ENGLISHCHAPTER - THE SOLID STATEEXERCISE - EXERCISE-J
10 Videos
Similar Questions
Knowledge Check
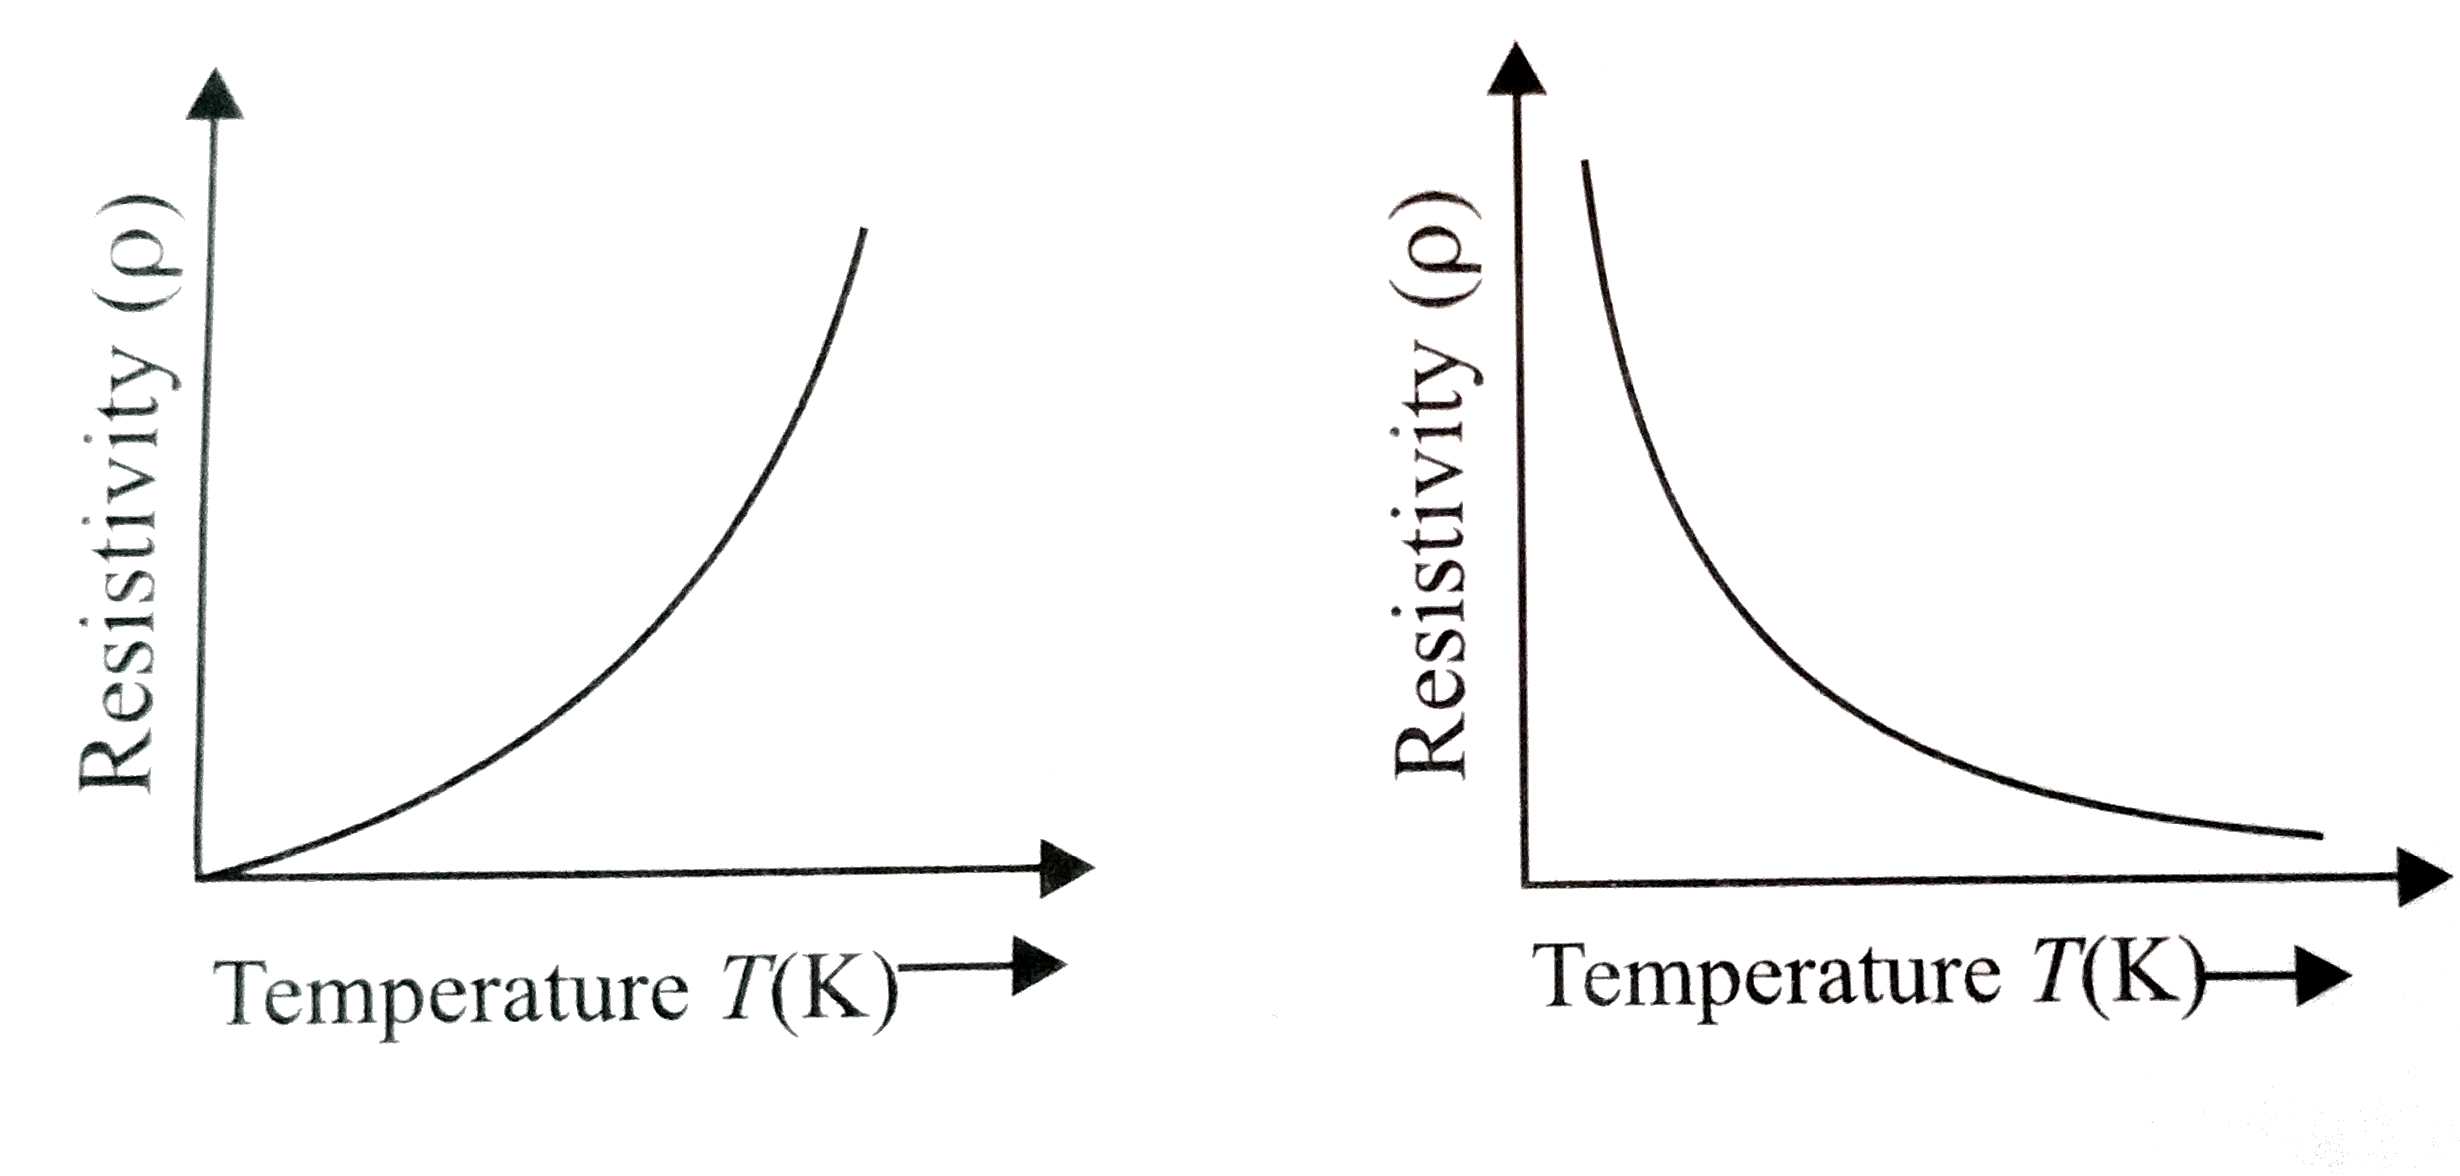
Figure (a) and figure (b) both are showing the variation of resistivity (p) with temperature (T) for some materials. Identify the types of these materials.
 AConductor and semiconductorBConductor and InsulatorCInsulator and semiconductorDBoth are conductor
Show on a graph, the variation of resistivity with temperature for a typical semiconductor.
View SolutionDraw a graph showing variation of resistivity with temperature for nichrome. Which property of nichrome is used to make standard resistance coils?
View SolutionThe relationship which describes the variation of vapour pressure with temperature is called
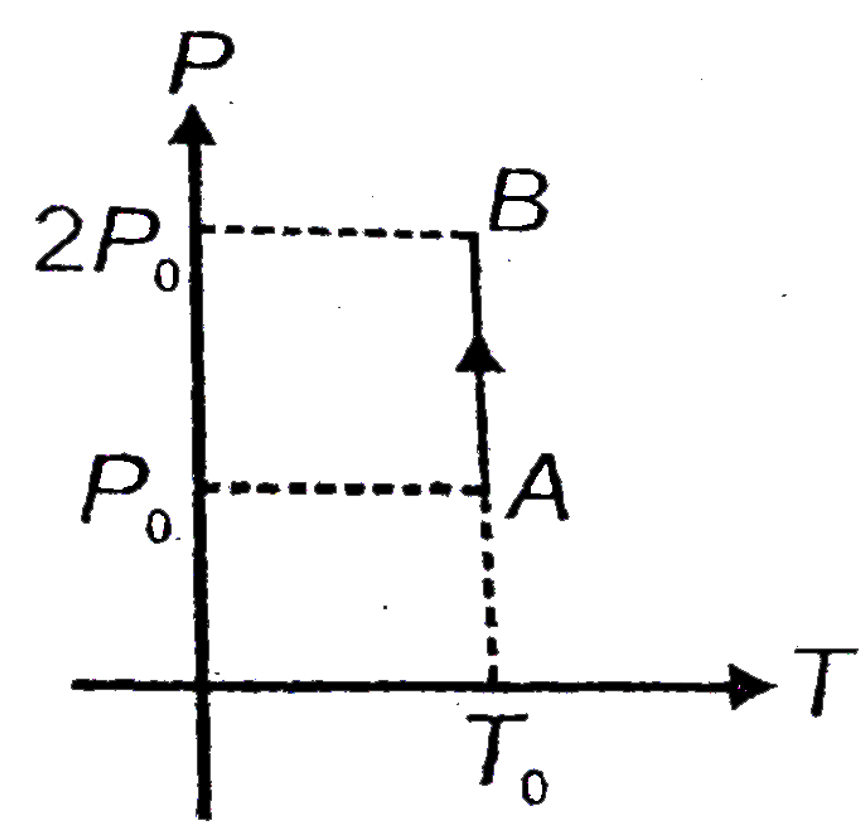
View SolutionFor a given mass of gas the variation of pressure versus temperature is shown in the figure. What is the ratio of volume of the gas at points A and B.
 .
.
View SolutionPlots showing the variation of the rate constant (k) with temperature (T) are given below. The plot that follows the Arrhenius equation is
View SolutionA local variation of climate is called
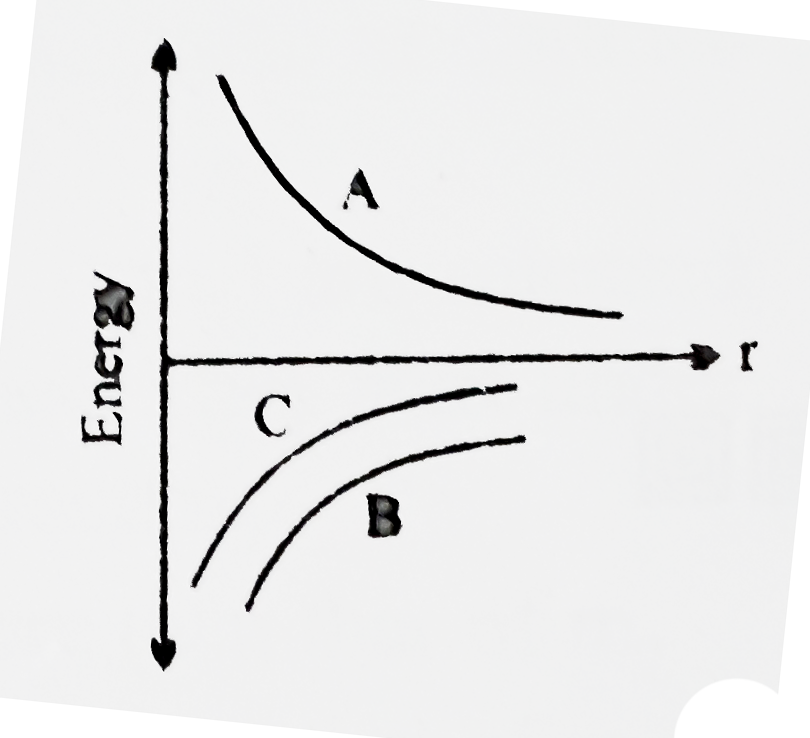
View SolutionThe figure shows the variation of energy with the orbit radius of a body in circular planetary motion. Find the correct statements about the curves A,B and C

View Solution
