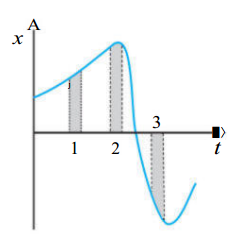
Figure 3.24 gives the x-t plot of a particle in one-dimensional motion. Three different equal intervals of time are shown. In which interval is the average speed greatest, and in which is it the least ? Give the sign of average velocity for each interval.
 Solution in Punjabi
Step by step video & image solution for Figure 3.24 gives the x-t plot of a particle in one-dimensional motion. Three different equal intervals of time are shown. In which interval is the average speed greatest, and in which is it the least ? Give the sign of average velocity for each interval. by Physics experts to help you in doubts & scoring excellent marks in Class 11 exams.
Updated on:21/07/2023Topper's Solved these Questions
Similar Questions
State, for each of the following physical quantities, if it is a scalar or a vector : volume, mass, speed, acceleration, density, number of moles, velocity, angular frequency, displacement, angular velocity.
View SolutionWhich of the following examples represent periodic motion?
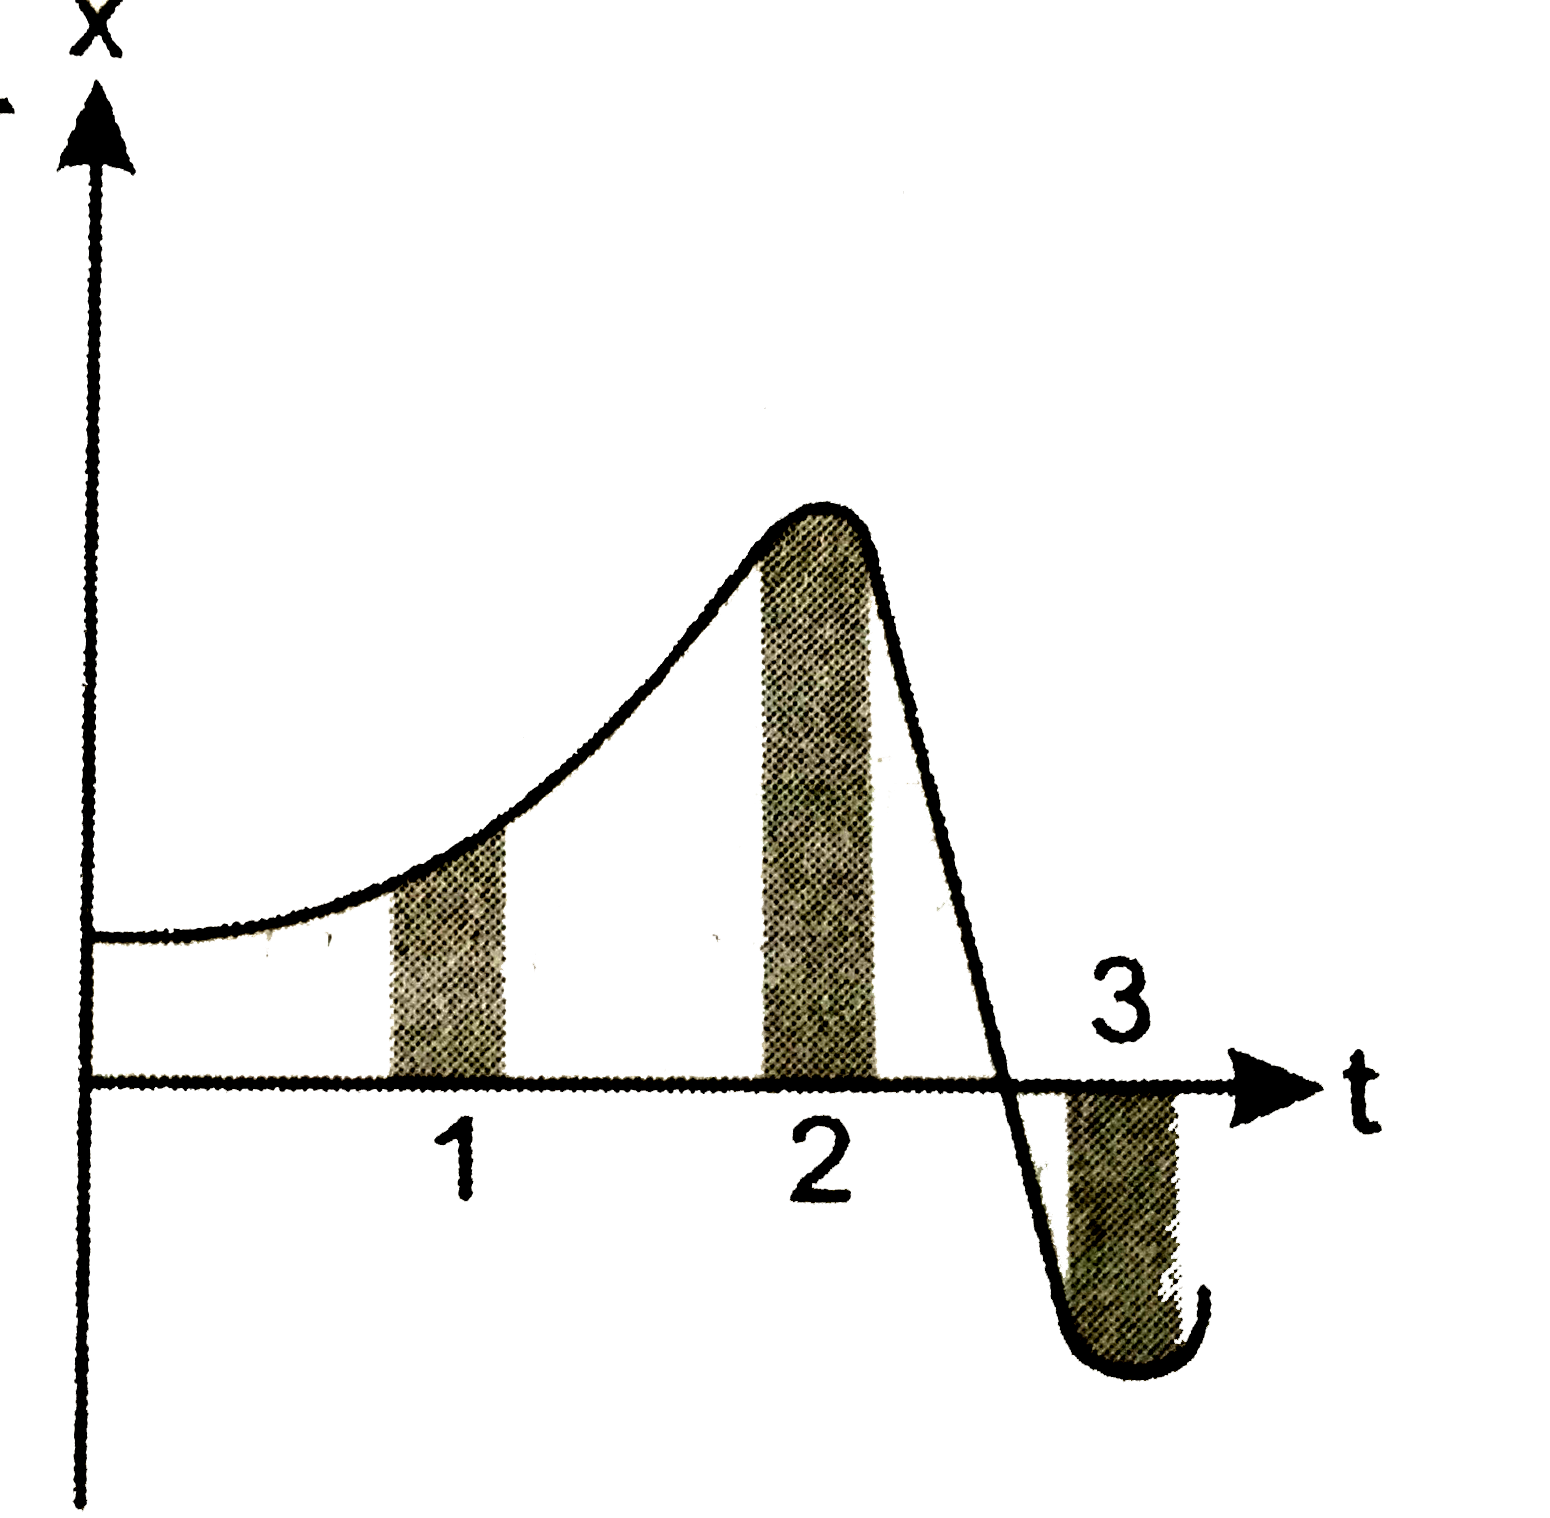
View SolutionFig. 2 (NCT).9 show the x-t plot of a particle in one dimensional motion. Three different equal intervals of time are shown. In which interval the average speed is greatest and in which it is the least ? Give the sign of average speed for each interval. .
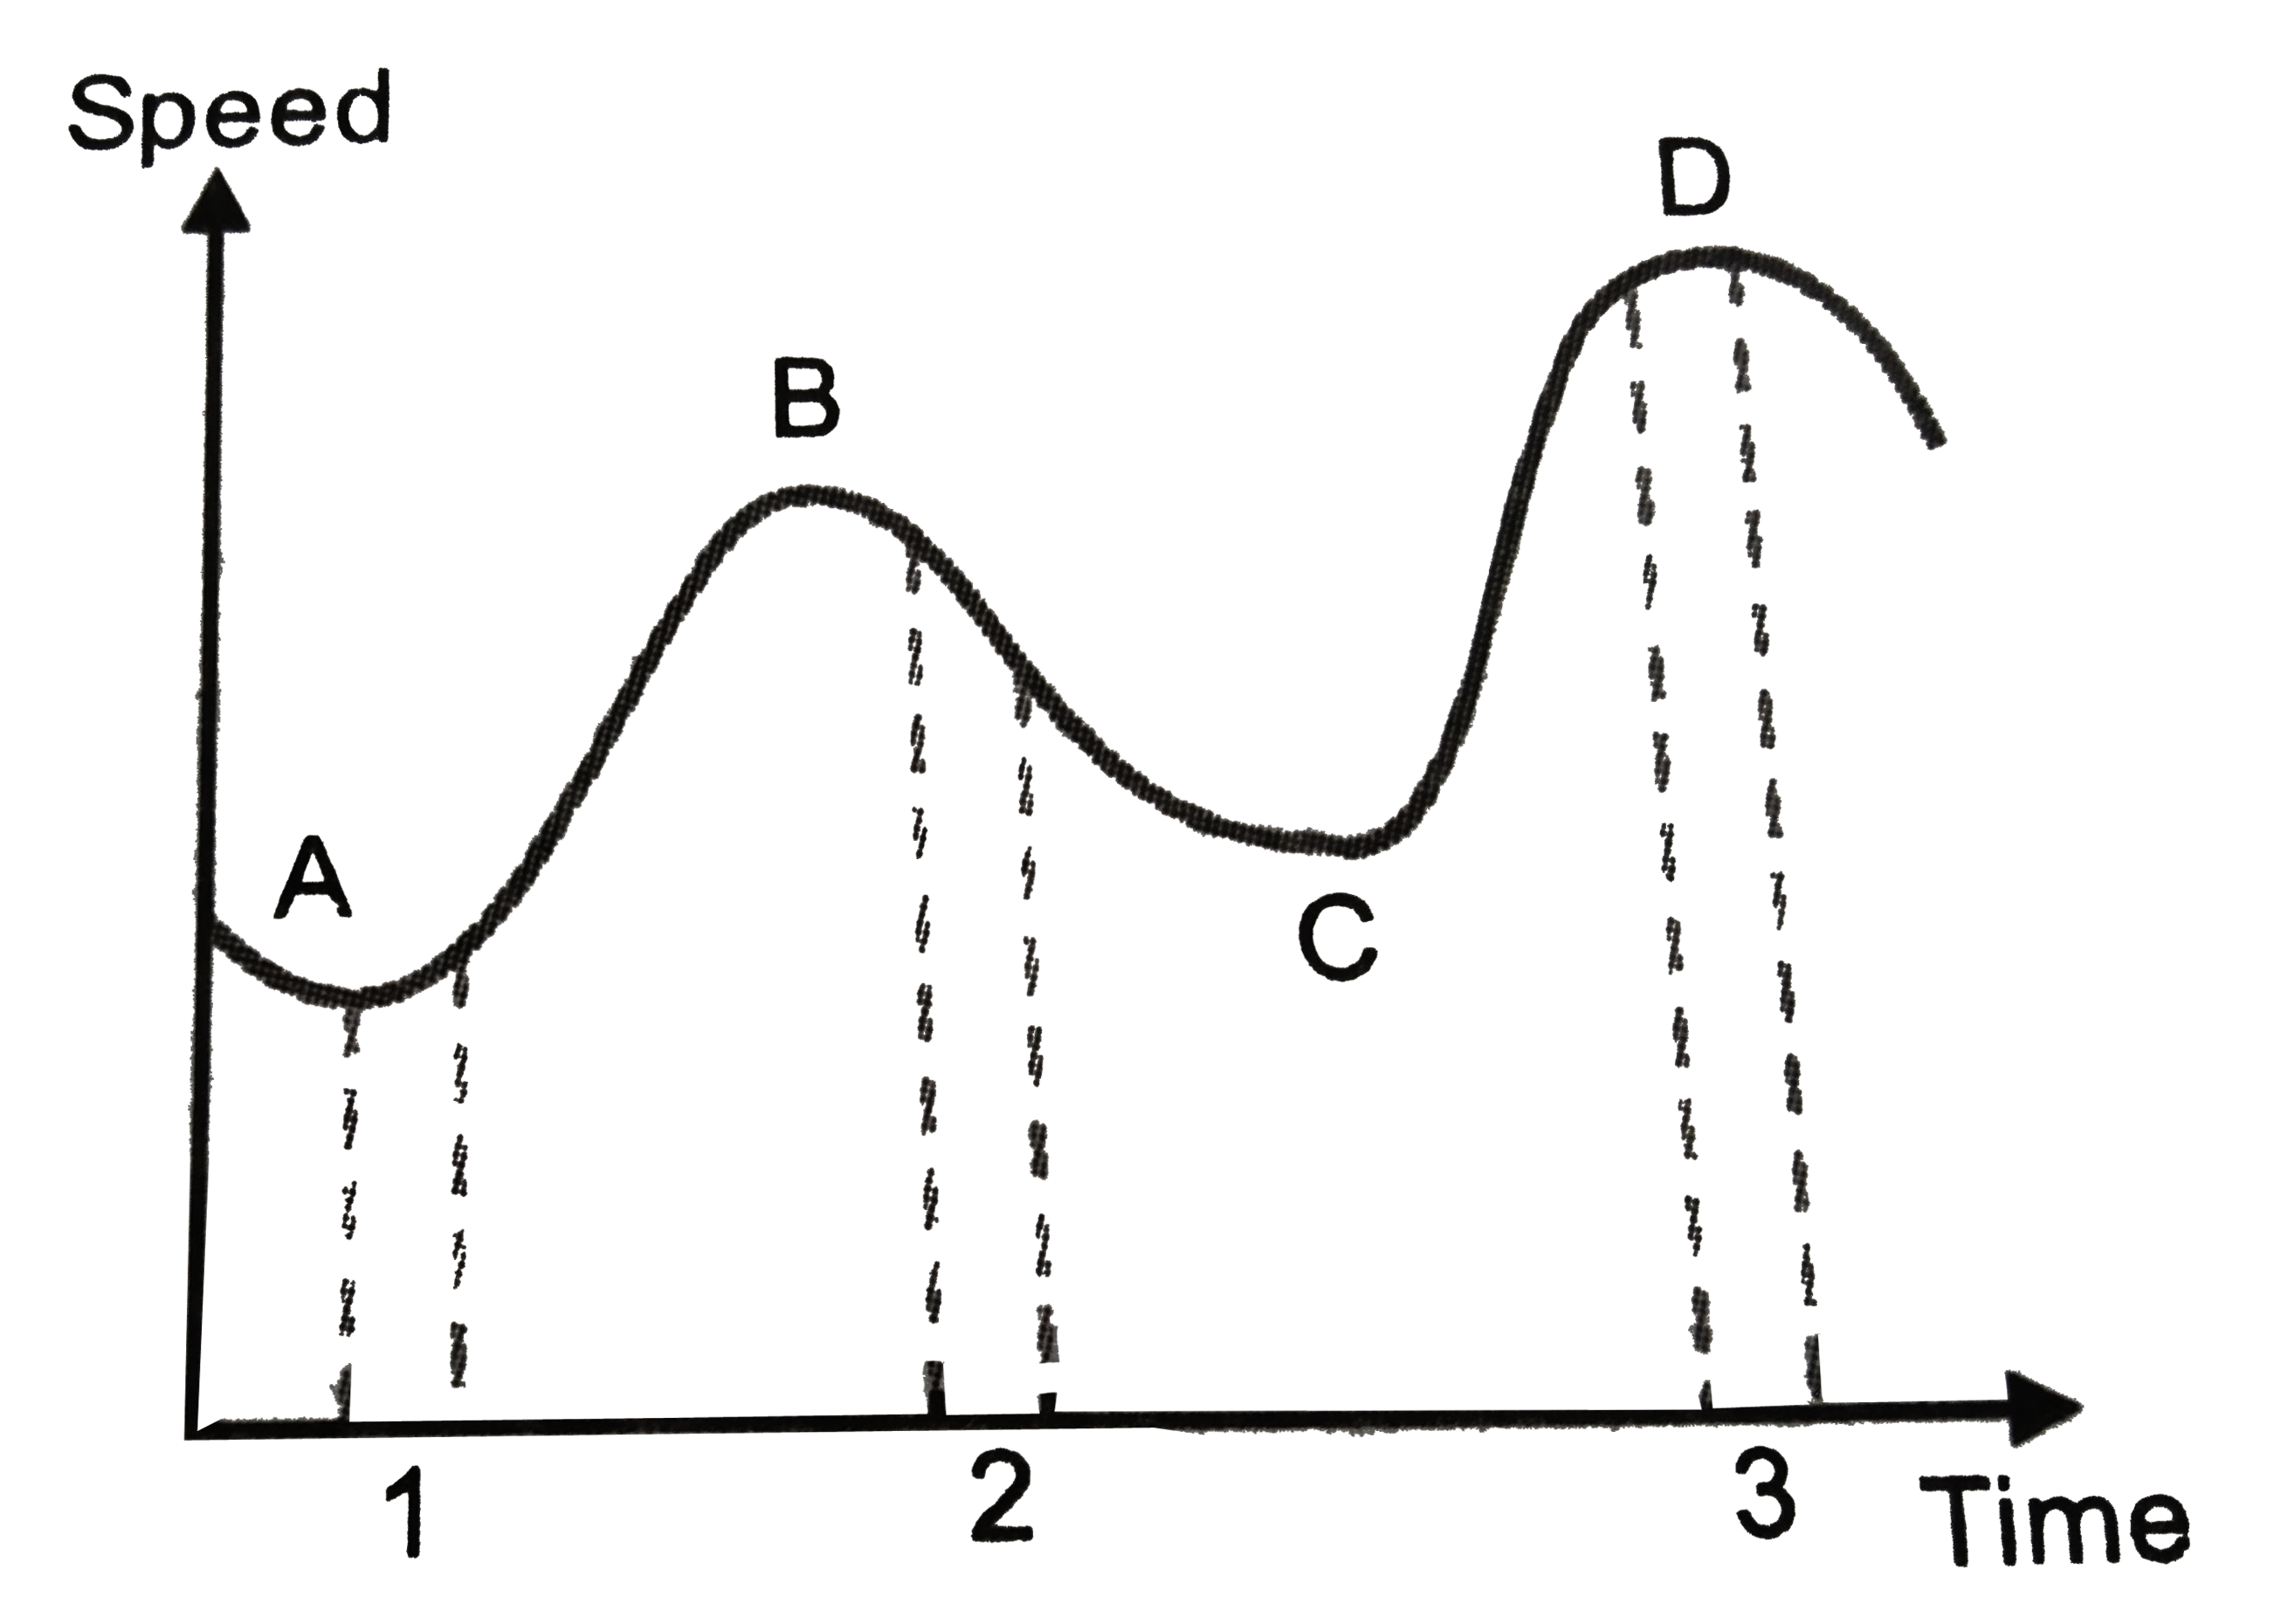
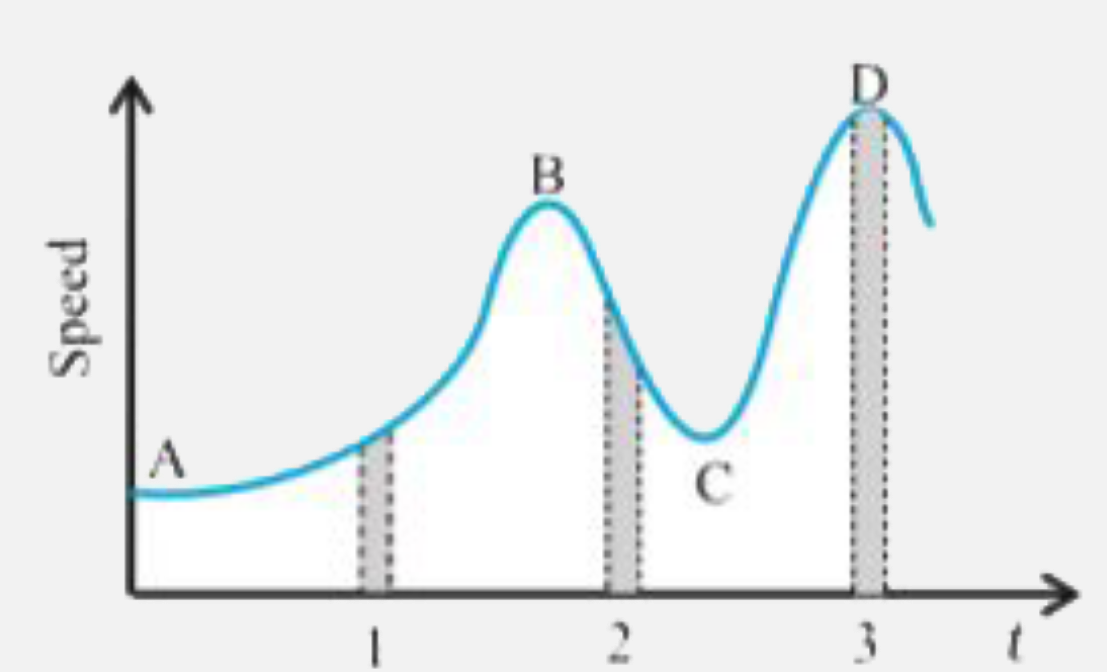
View SolutionFig. 2 (NCT). 10 . Give a speed-tiem graph of a particle in one dimenstional motion. Three different equal intervals of time are shwon. In which interval is the average acceleration graeatest in magnitude ? In which interval is the average speed greatest ? Choosing the positive direction as the constant direction of motion, give the signs of u and a in the three intervals. What are the acclerations at teh points A,B,C and D ?
 .
.
View Solutionचित्र किसी कण की एकविमीय गति का x−t ग्राफ दर्शाता है। इसमें तीन समान अन्तराल दिखाये गये है। किस अन्तराल में औसत चाल अधिकतम है और किसमें न्यूनतम है? प्रत्येक अन्तराल के लिए औसत वेग का चिन्ह बताइए।
View SolutionFigure. gives the x-t plot of a particle in one-dimensional motion. Three different equal intervals of time are shown. In which interval is the average speed greatest, and in which is it the least ? Give the sign of average velocity for each interval.
View SolutionFigure. gives a speed-time graph of a particle in motion along a constant direction. Three equal intervals of time are shown. In which interval is the average acceleration greatest in magnitude ? In which interval is the average speed greatest ? Choosing the positive direction as the constant direction of motion, give the signs of v and a in the three intervals. What are the accelerations at the points A, B, C and D ?
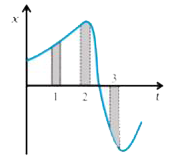
View SolutionFigure. gives the x-t plot of a particle in one-dimensional motion. Three different equal intervals of time are shown. In which interval is the average speed greatest, and in which is it the least ? Give the sign of average velocity for each interval.
View SolutionFigure. gives a speed-time graph of a particle in motion along a constant direction. Three equal intervals of time are shown. In which interval is the average acceleration greatest in magnitude ? In which interval is the average speed greatest ? Choosing the positive direction as the constant direction of motion, give the signs of v and a in the three intervals. What are the accelerations at the points A, B, C and D ?
View SolutionFig. show the x-t plot of a particle in one dimensional motion. Three different equal intervals of time are shown. In which interval the average speed is greatest and in which it is the least? Give the sign of average speed for each interval. .
View SolutionFigure gives the x-t plot of a particle in one dimensional motion. Three different equal intervals of time are shown. In which interval is the average speed greatest and in which is it the least ? Give the sign of average velocity for each interval.

View SolutionFigure gives a speed - time graph of a particle in motion along a constant direction. Three equal intervals of time are shown. In which interval is the average acceleration greatest in magnitude ? In which interval is the average speed greatest? Choosing the positive direction as the constant direction of motion give the signs of vand a in the three intervals. What are the acclerations at the points A, B, C and D?
View SolutionFig. 2 (NCT).9 show the x-t plot of a particle in one dimensional motion. Three different equal intervals of time are shown. In which interval the average speed is greatest and in which it is the least ? Give th sign of average speed for each interval. .
View SolutionIn the x-t plot of a particle in one dimensional motion. Four different equal intervals of time are shown. In which interval, average speed is greatest
View Solution
