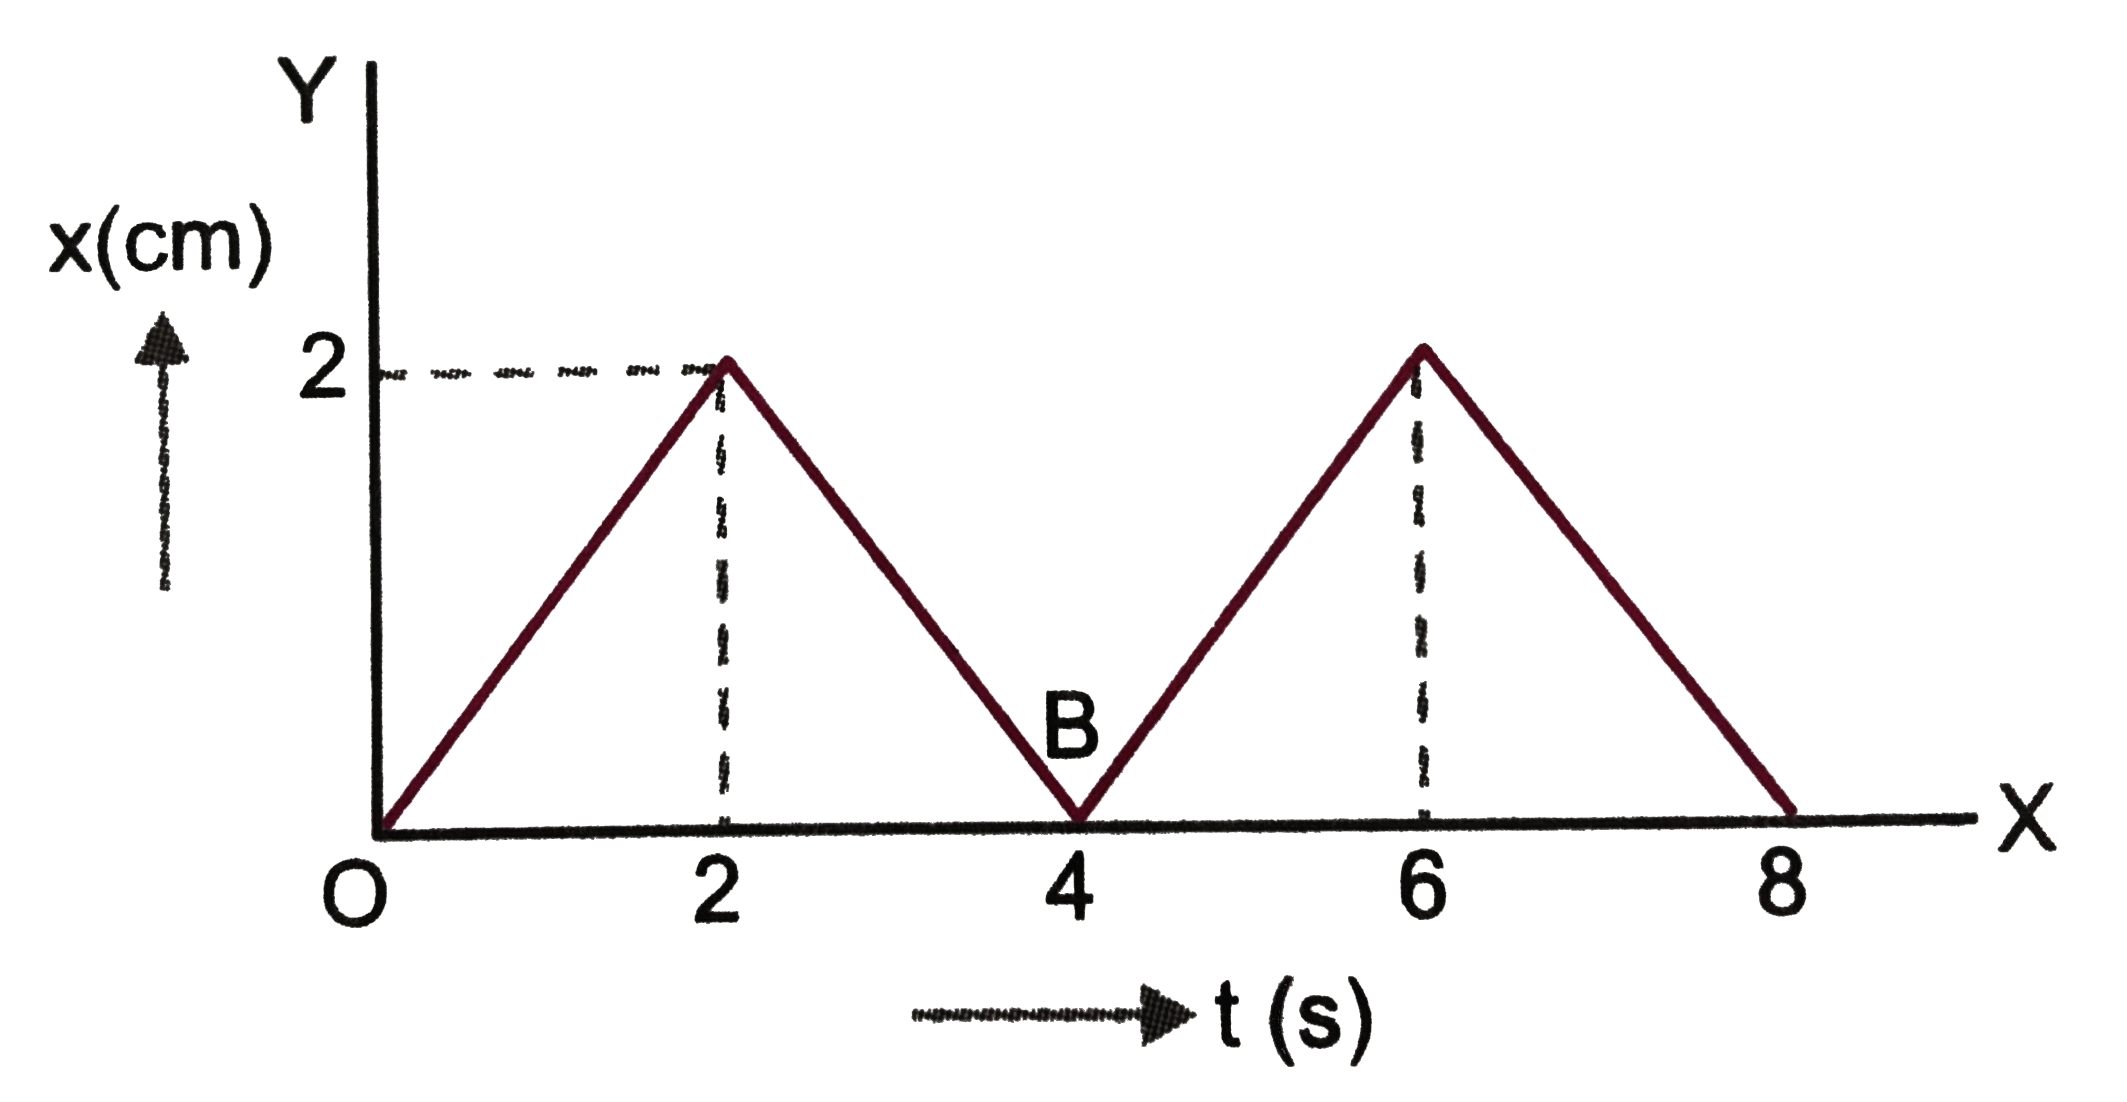
Figure shows the position - time graph of a body of mass 0.04 kg . Suggest a suitable physical context for this motion . What is the time between by the body ? What is the magnitude of each impulse ?
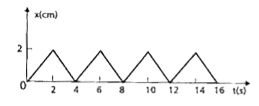
Here , m = 0.04 kg position time graph shows that the particle moves from x = 0 at 0 to x = 2 cm at A in 2 sec .
As x−t graph is a st. line the motion is with a constant velocity .
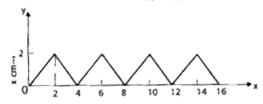
From x = 2 cm at A , particle goes to x = 0 at B in 2 sec .
As AB is stline , motion is with constant velocity N = 1 cm/s
velocity N = 1 cm/s
−10−2 m/s Negative sign indicates the reversal of direction of motion . thsi is being repeated .We can visualise a ball moving between two walls located at x = 0 and x = 2 cm , getting rebounded repeatedly on striking against each wall on every collision with a wall , linear momentum of the ball changes . Therefore , teh ball receives impulse after every two seconds . Magnitude of impulse = Total change in lineas momentum .
=mu−(mv)
=mu−mv=m(u−v)
=0.04(10−2+10−2)
=0.08×10−2
=8×10⁻⁴ kg m/s .
Similar Questions
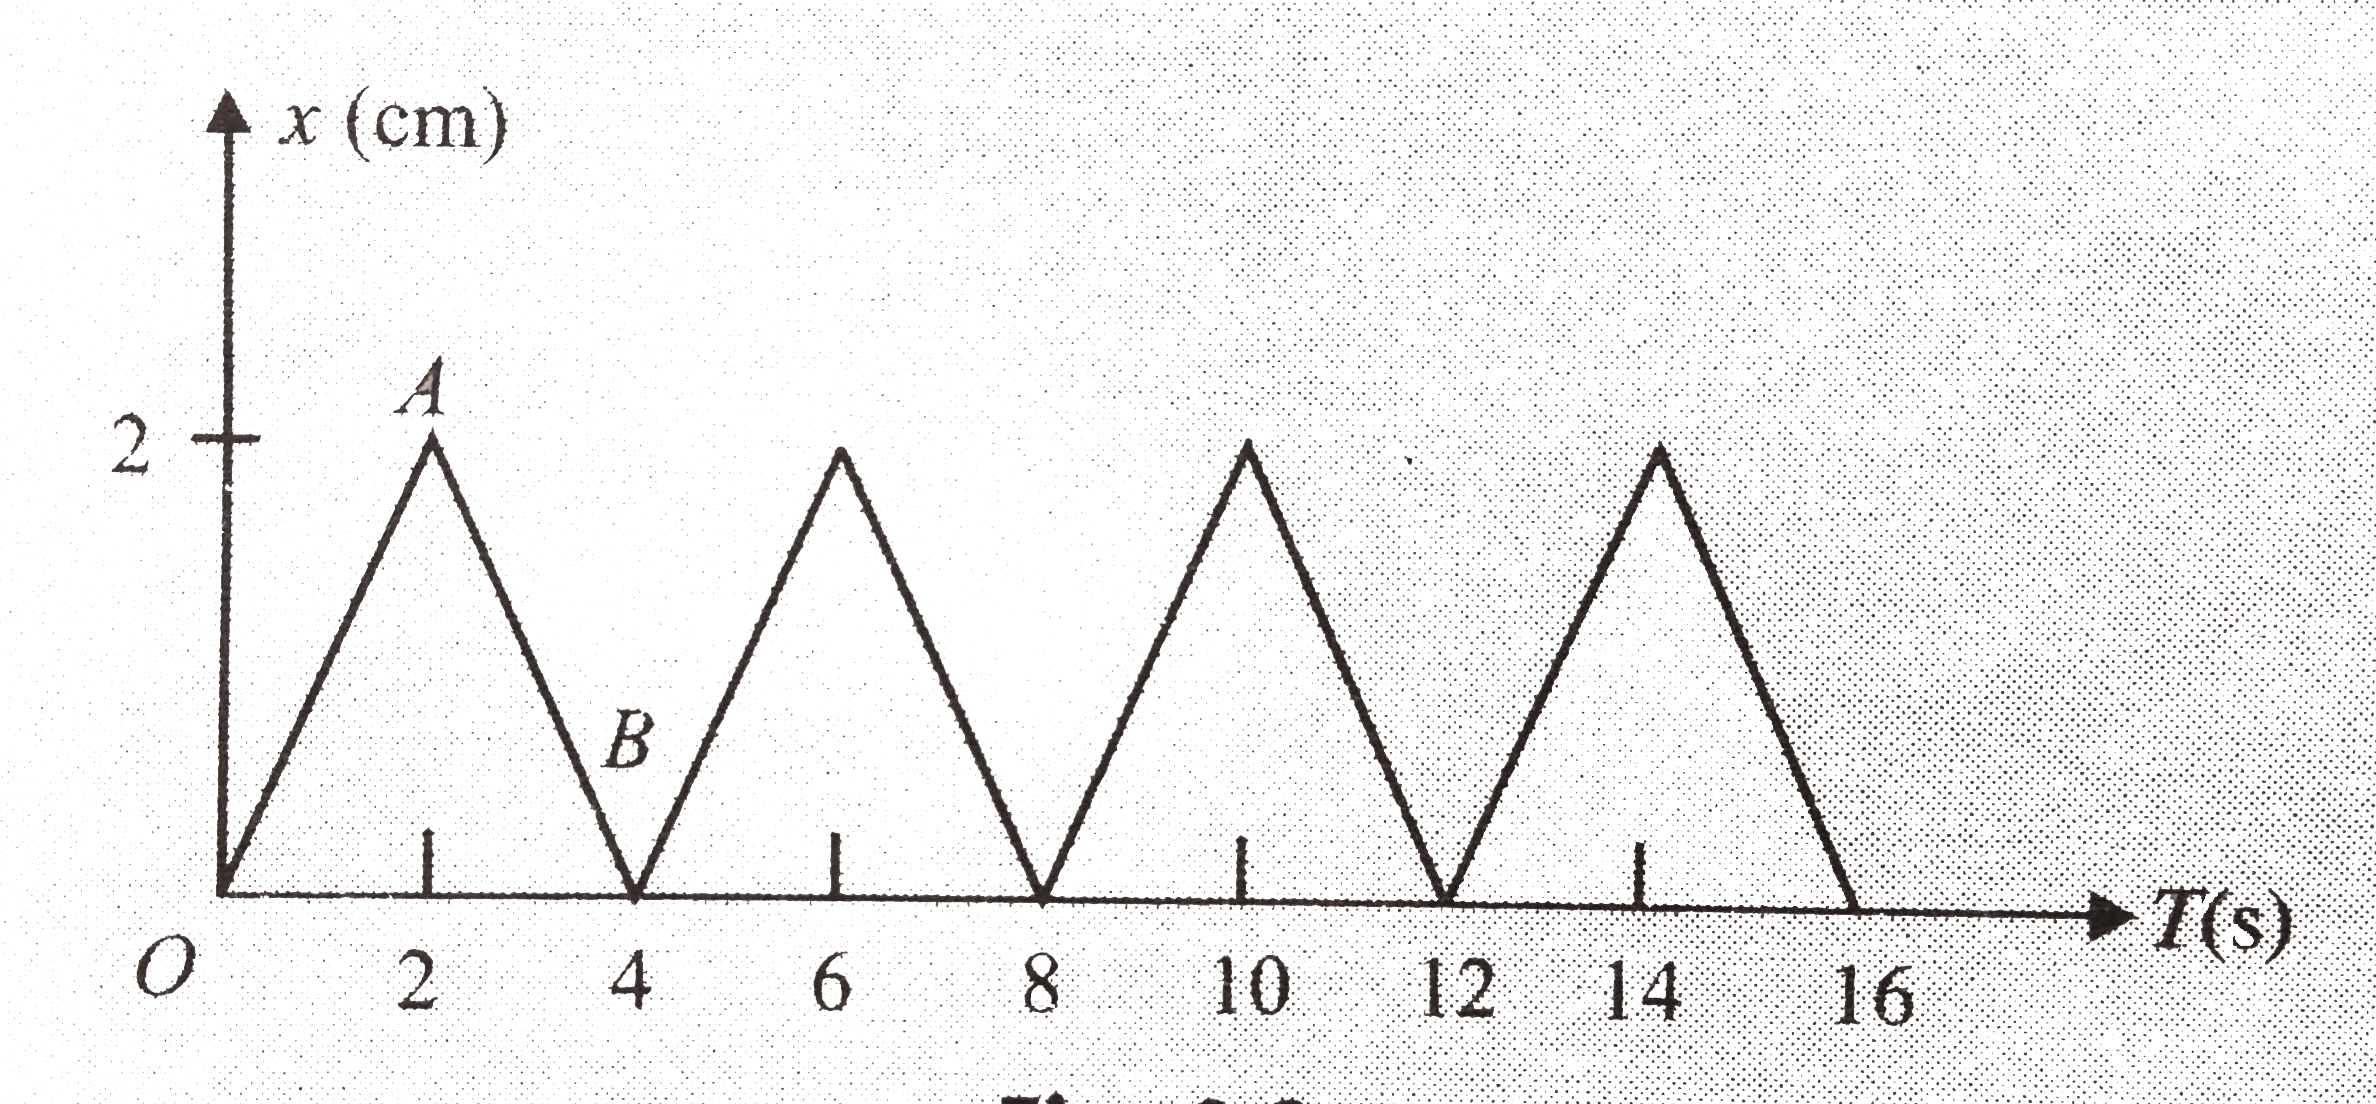
Figure shows the position-time graph of a particle of mass 0.04kg. Suggest a suitable physical context for this motion. What is the time between two consecutive impulses received by the particle? What is the magnitude of each impulse?
 View Solution
Figure shows the position-time graph of a particle of mass 0.04kg. Suggest a suitable physical context for this motion. What is the time between two consecutive impulses received by the particle? What is the magnitude of each impluse?
 View Solution
Knowledge Check
- Question 1 - Select One
The position-time graph of a body of mass 0.04kg is shown in the figure. The time between two consecutive impulses received by the body and the magnitude of each impulse is
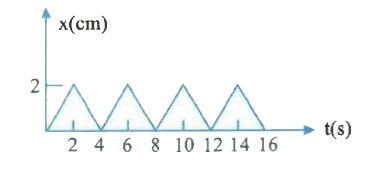 A4sec,4×10−4kgm/sB2sec,8×10−4kgm/sC6sec,4×10−4kgm/sD8sec,8×10−4kgm/s
 - Question 2 - Select One
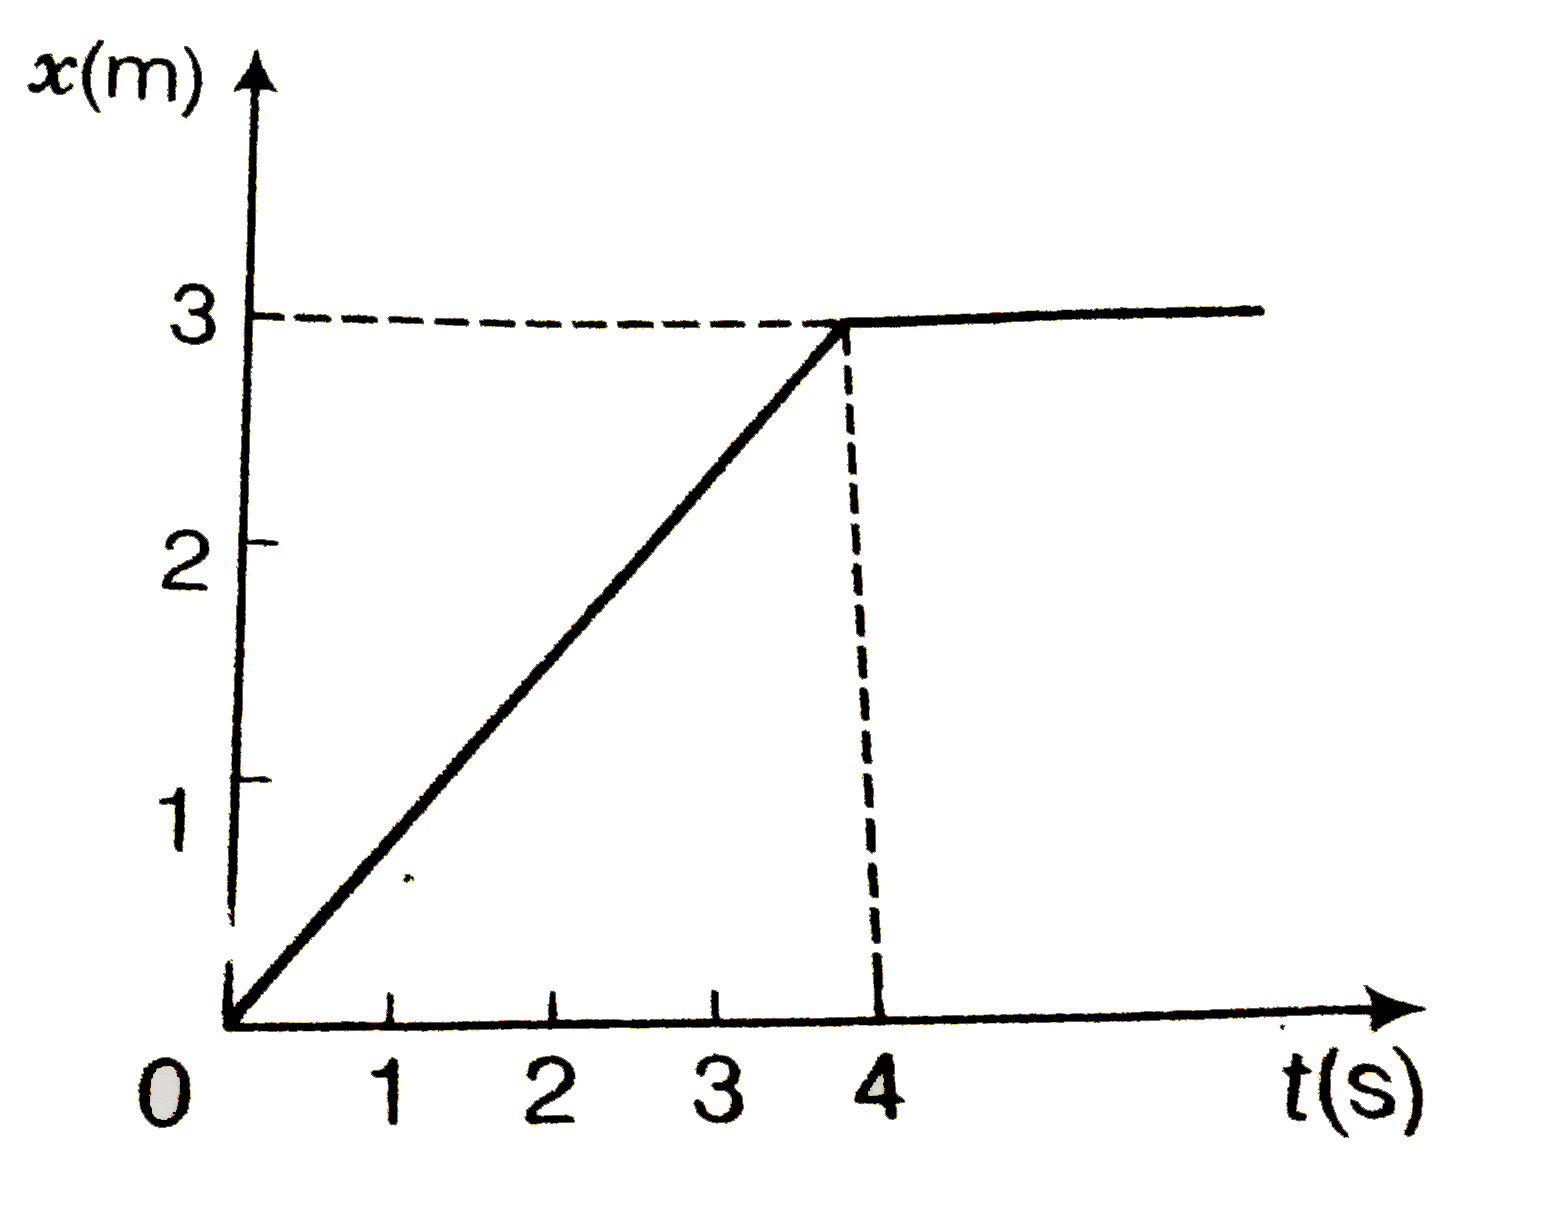
The position time graph of a body of mass 2kg is as given in What is the impulse on the body at t=0 s and t=4s ?
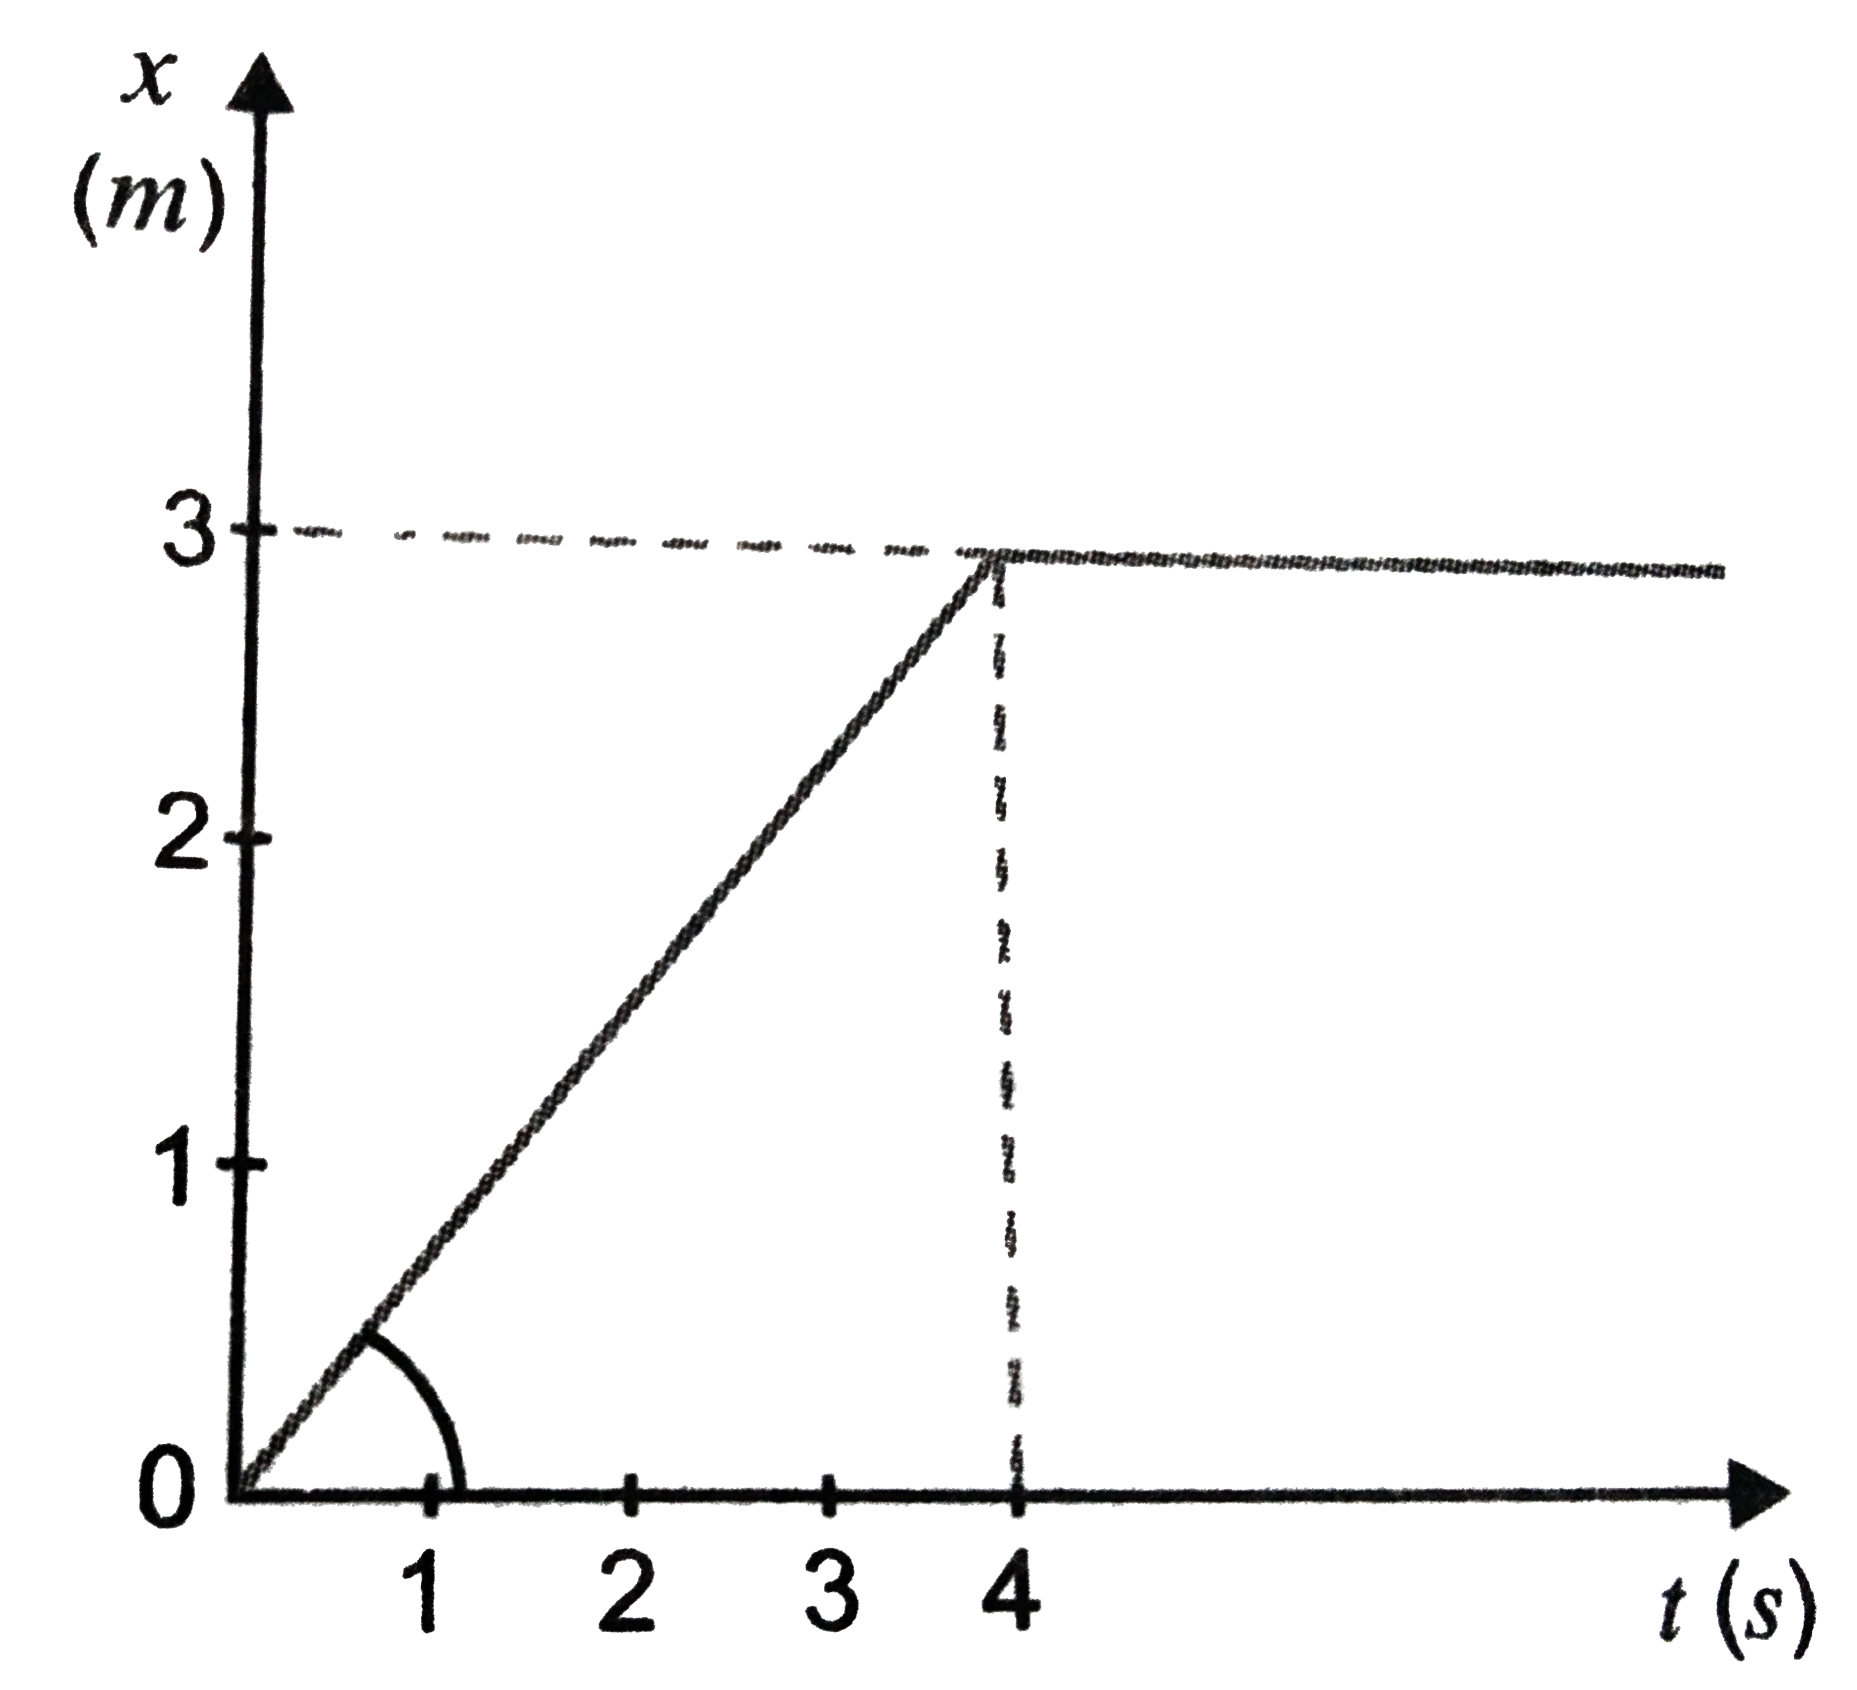 . A23kgms−1B−23kgms−1C32kgms−1D−32kgms−1
Figure shows the position-time graph of a particle of mass 0.04kg. Suggest a suitable physical context for this motion. What is the time between two consecutive impulses received by the particle? What is the magnitude of each impluse?
 View Solution
Shows the position time graph of a particle of mass 0.04 kg Suggest a suitable physical context for this motion What is the time between two conscutive impulse recevived by the particle ? What is the magnitude of each impulse ?
 View Solution
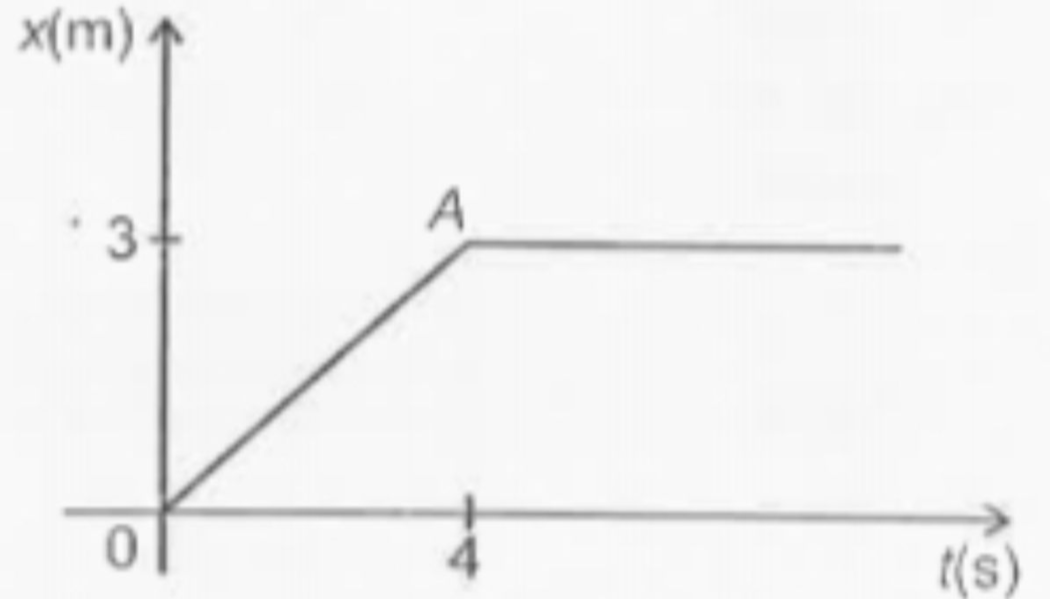
The figure shows the position time graph of a particle of mass 40 kg. What is the force acting on the particle of 0<t<4 s
 View Solution
The position time graph of a body of mass 2kg is as given in What is the impulse on the body at t=0 s and t=4s ?
 . View Solution
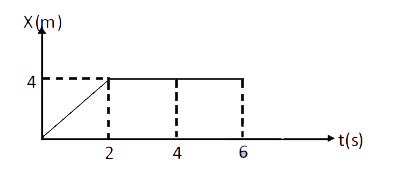
The position-time graph of a particle of mass 0.1 kg is shown. The impulse at t = 2s is :
 View Solution
The position-time graph of a body of mass 2 kg is as given in figure . What is the impulse on the body at t = 0 s and t = 4 s .
 View Solution

