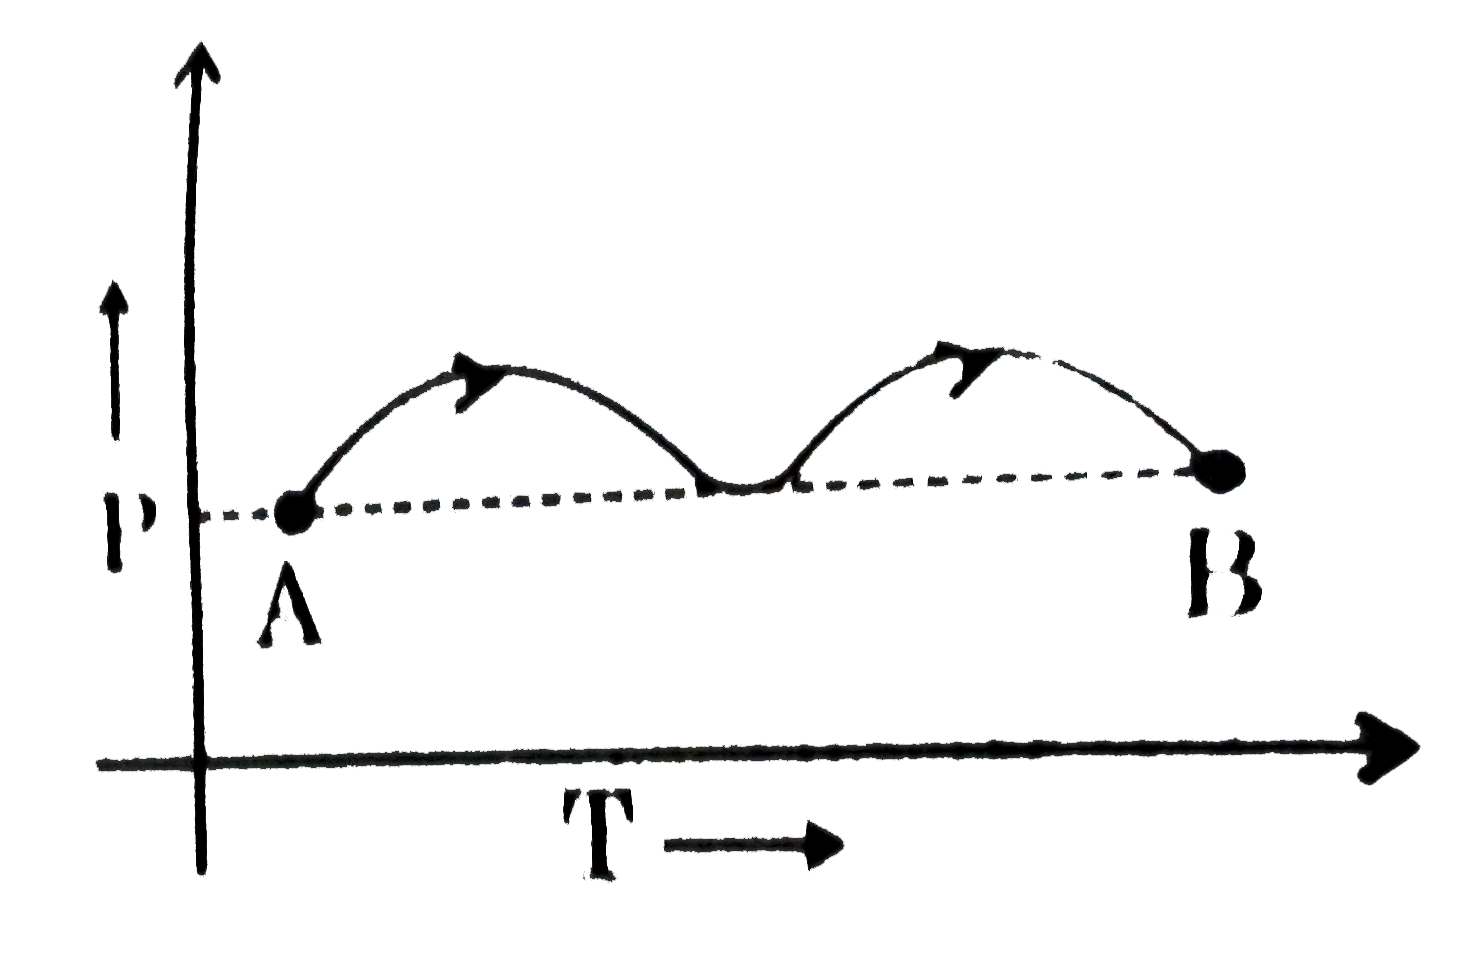
The P-T graph, as given below, was observed for a process on an ideal gas. Which of the statement is true ?

w=+ve,ΔH=+ve
w=−ve,ΔH=−ve
w=−ve,ΔH=+ve
w=+ve,ΔH=−ve
The correct Answer is:C
Step by step video & image solution for The P-T graph, as given below, was observed for a process on an ideal gas. Which of the statement is true ? by Chemistry experts to help you in doubts & scoring excellent marks in Class 12 exams.
Updated on:21/07/2023Similar Questions
Knowledge Check
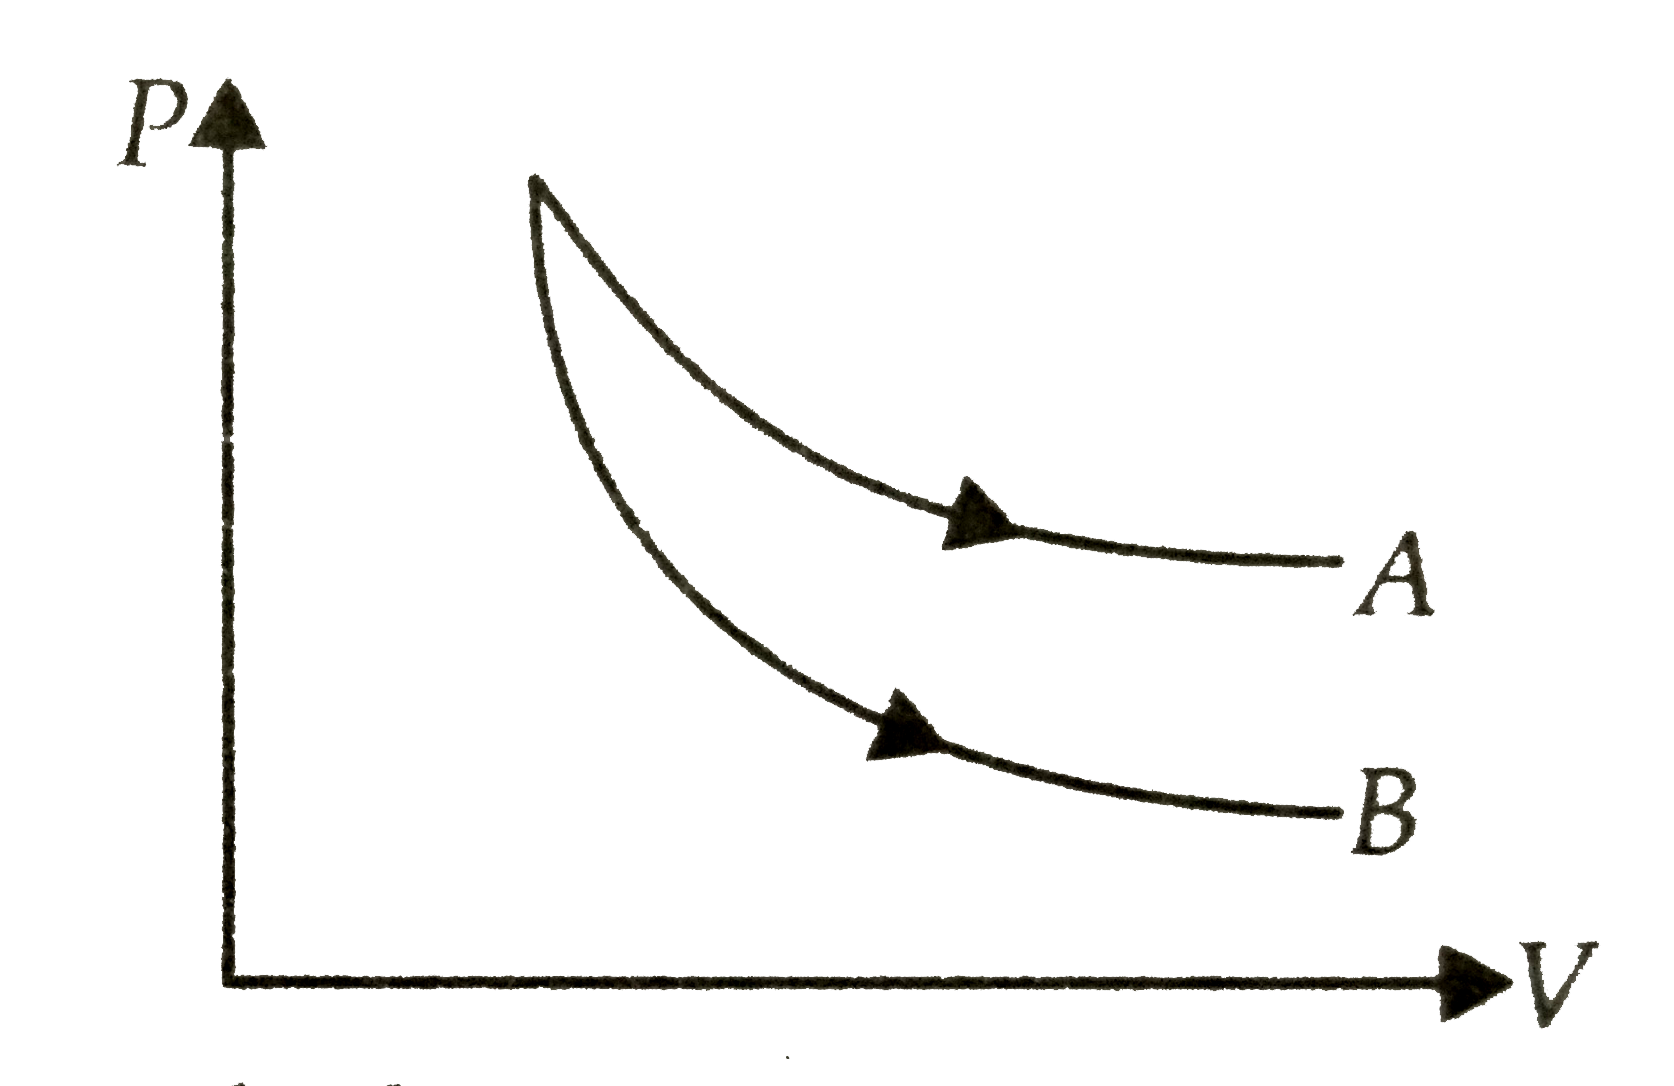
The given P-V diagram expansion of a gas which one of the following statement is true?
 A1. A is isothermal and B is adiabatic processB2. A is adiabatic and B is isothermal processC3. Both are isothermal processD4. Both are adiabatic process
In a given process on an ideal gas, dW = 0 and dQ<0. Then for the gas
Athe temperature will decreaseBthe volume will increasesCthe pressure will remain constantDthe temperature will increase
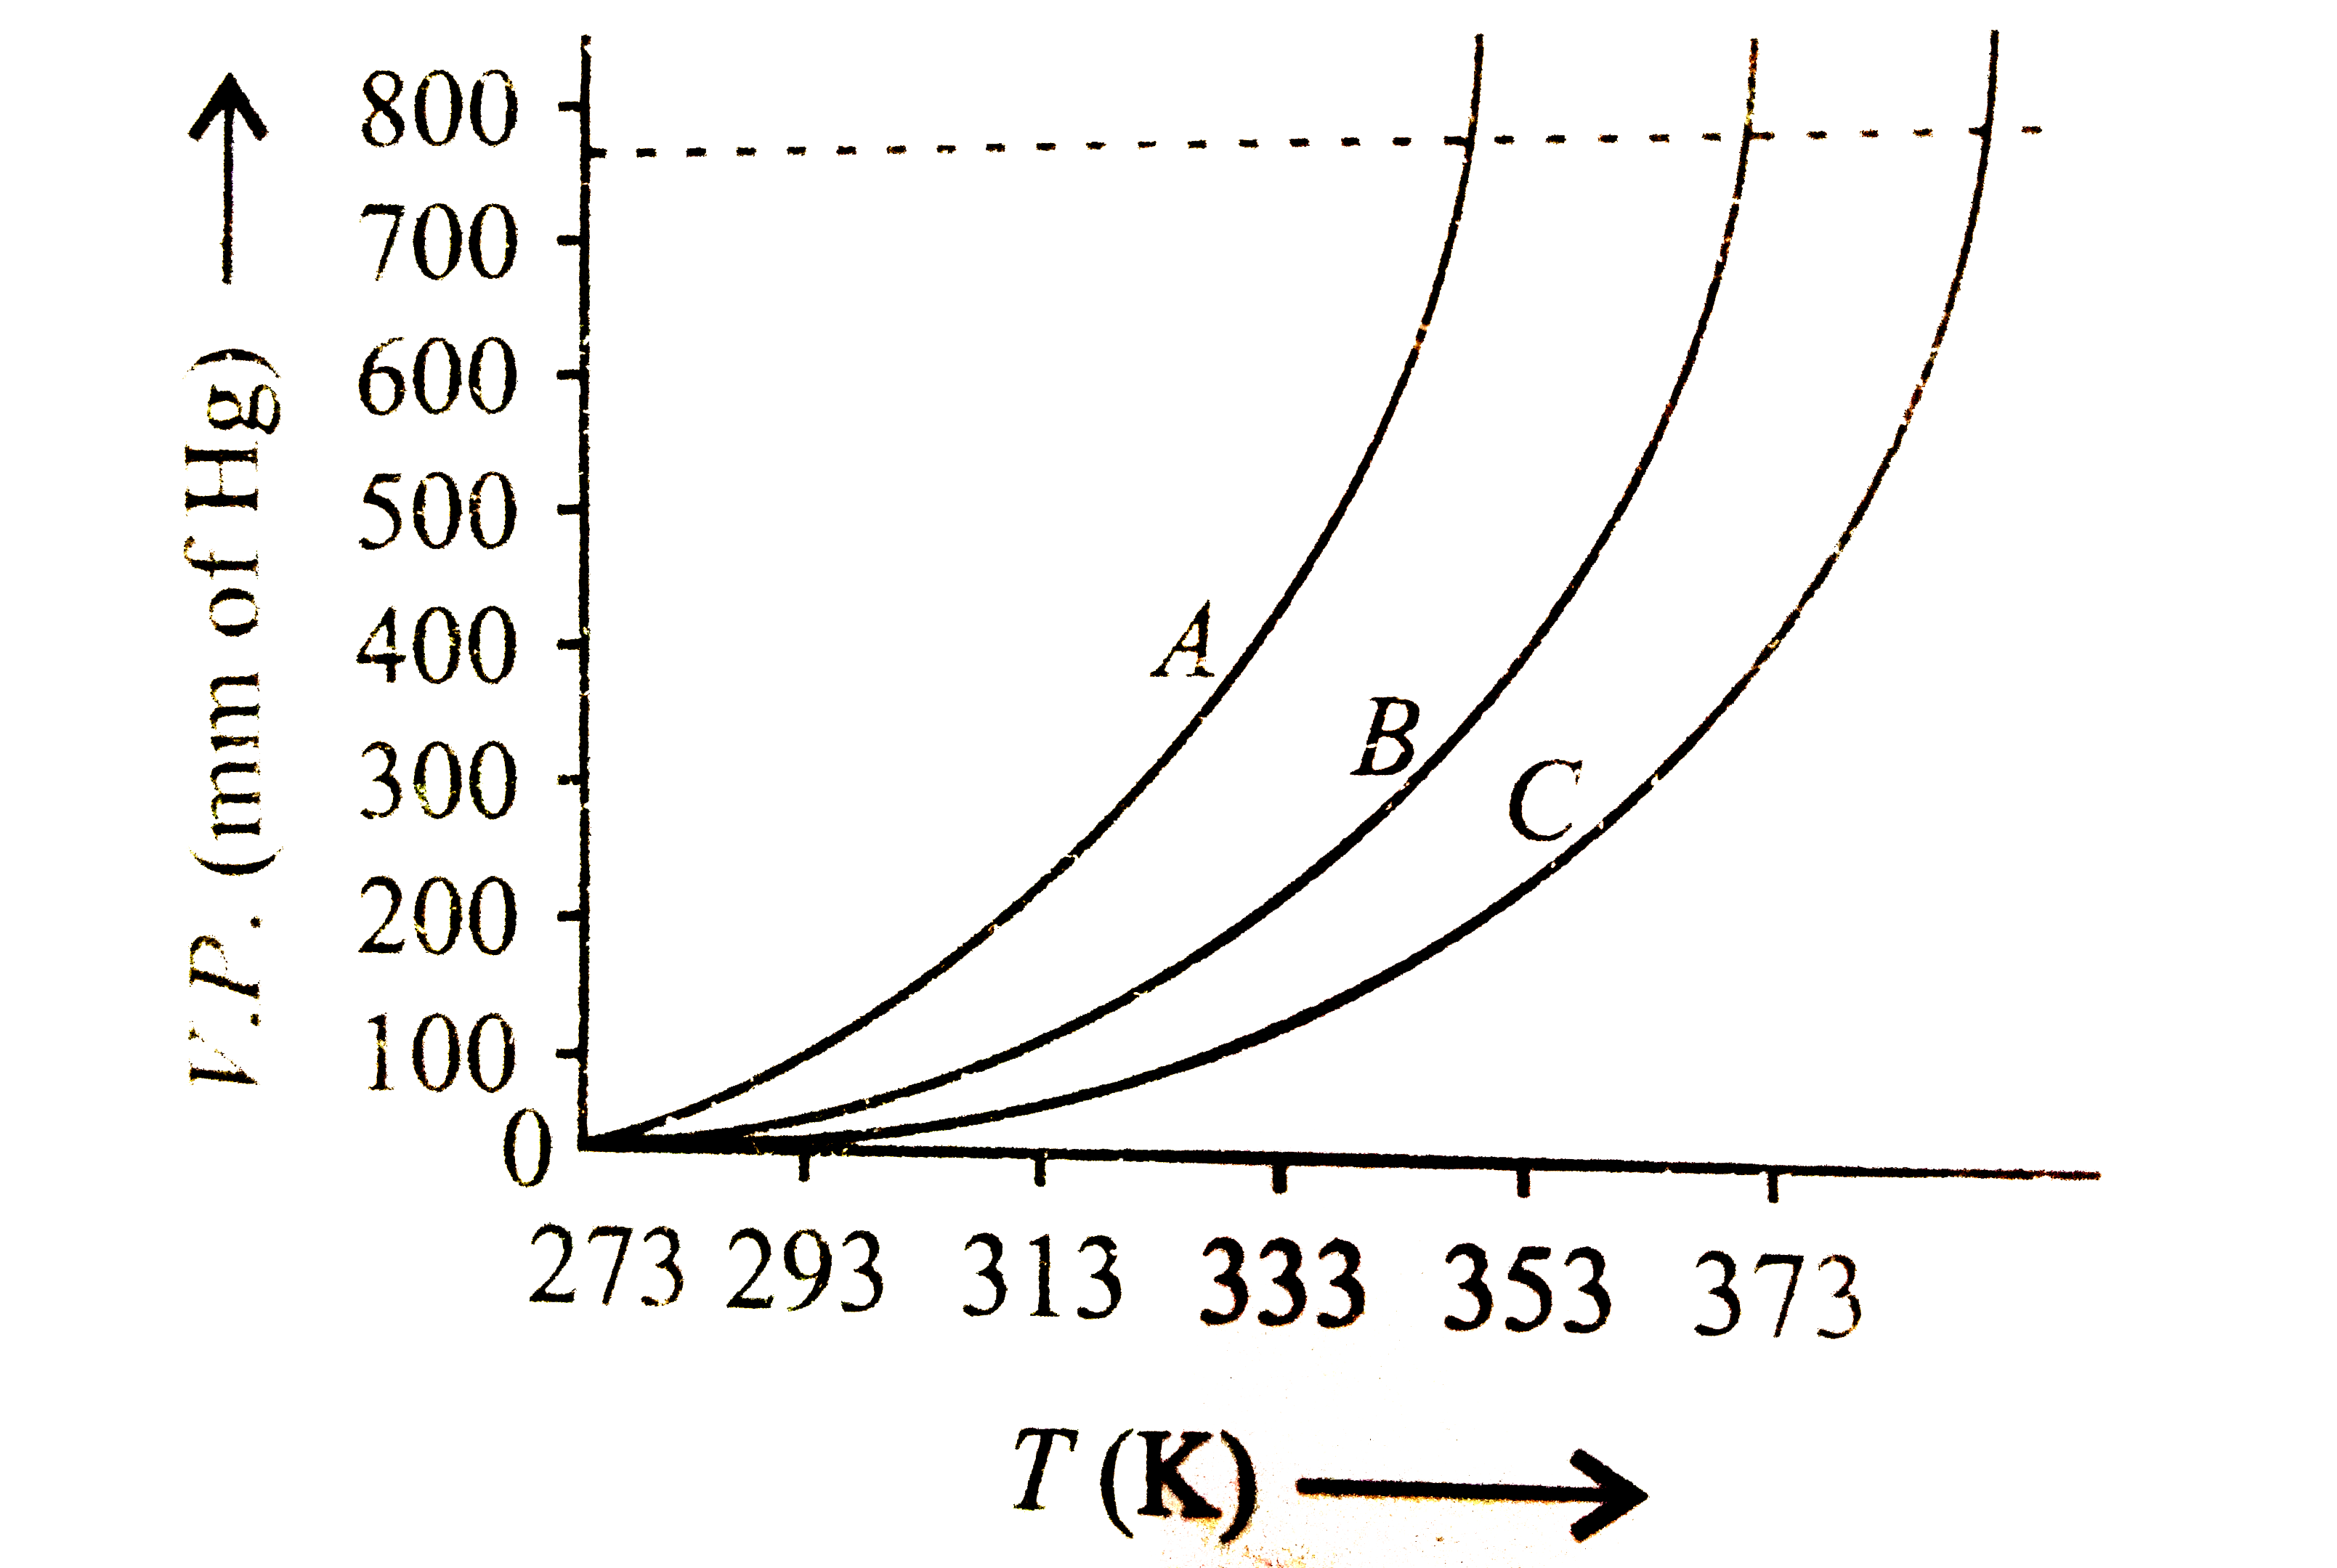
The graph below shows V-p curve for three processes. Choose the correct statement(s) :

View SolutionWhich is not true in case of an ideal gas?
View SolutionFor adiabatic process of an ideal gas the value of dPP is equals to
View SolutionWhich of the following graph does not belong to isothermal process for an ideal gas?
View SolutionIn a given process on an ideal gas, dW=0 and dQ is negative, then for the gas:
View SolutionGiven that y=acos(tP−qx), where t represents distance is metre. Which of the following statements is true ?
View Solution

